KNN Regression [SS]Another indicator release, I know.
But note, this isn't intended to be a stand-alone indicator, this is just a functional addition for those who program Machine Learning algorithms in Pinescript! There isn't enough content here to merit creating a library for (it's only 1 function), but it's a really useful function for those who like machine learning and Nearest Known Neighbour Algos (or KNN).
About the indicator:
This indicator creates a function to perform KNN-based regression.
In contrast to traditional linear regression, KNN-based regression has the following advantages over linear regression:
Advantages of KNN Regression vs. Linear Regression:
🎯 Non-linearity: KNN is a non-parametric method, meaning it makes no assumptions about the underlying data distribution. This allows it to capture non-linear relationships between features and the target variable.
🎯Simple Implementation: KNN is conceptually simple and easy to understand. It doesn't require the estimation of parameters, making it straightforward to implement.
🎯Robust to Outliers: KNN is less sensitive to outliers compared to linear regression. Outliers can have a significant impact on linear regression models, but KNN tends to be less affected.
Disadvantages of KNN Regression vs. Linear Regression:
🎯 Resource Intensive for Computation: Because KNN operates on identifying the nearest neighbors in a dataset, each new instance has to be searched for and identified within the dataset, vs. linear regression which can create a coefficient-based model and draw from the coefficient for each new data point.
🎯Curse of Dimensionality: KNN performance can degrade with an increasing number of features, leading to a "curse of dimensionality." This is because, in high-dimensional spaces, the concept of proximity becomes less meaningful.
🎯Sensitive to Noise: KNN can be sensitive to noisy data, as it relies on the local neighborhood for predictions. Noisy or irrelevant features may affect its performance.
Which is better?
I am very biased, coming from a statistics background. I will always love linear regression and will always prefer it over KNN. But depending on what you want to accomplish, KNN makes sense. If you are using highly skewed data or data that you cannot identify linearity in, KNN is probably preferable.
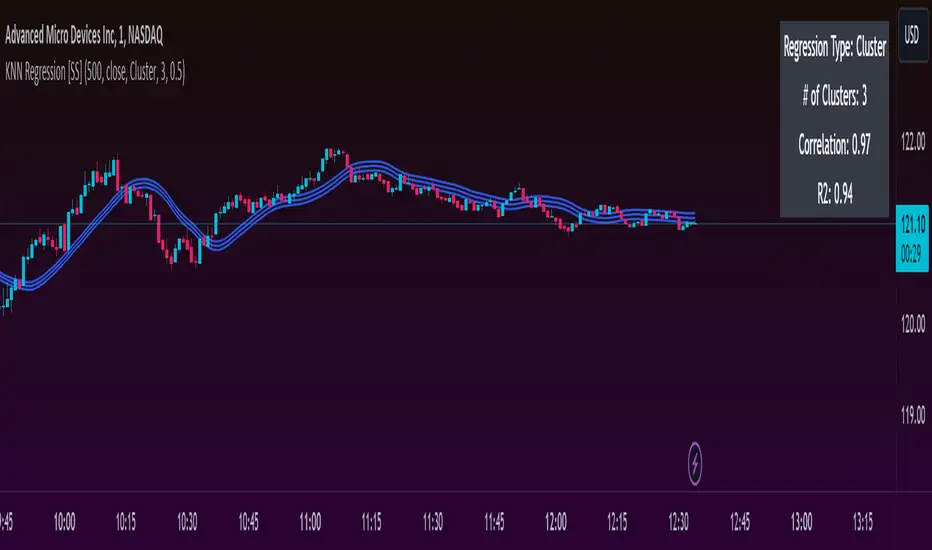
However, if you require precise estimations of ranges and outliers, such as creating co-integration models, I would advise sticking with linear regression. However, out of curiosity, I exported the function into a separate dummy indicator and pulled in data from QQQ to predict SPY close, and the results are actually very admirable:
And plotted with showing the standard error variance:
Pretty impressive, I must say I was a little shocked, it's really giving linear regression a run for its money. In school I was taught LinReg is the gold standard for modeling, nothing else compares. So as with most things in trading, this is challenging some biases of mine ;).
Functionality of the function
I have permitted 3 types of KNN regression. Traditional KNN regression, as I understand it, revolves around clustering. ( Clustering refers to identifying a cluster, normally 3, of identical cases and averaging out the Dependent variable in each of those cases) . Clustering is great, but when you are working with a finite dataset, identifying exact matches for 2 or 3 clusters can be challenging when you are only looking back at 500 candles or 1000 candles, etc.
So to accommodate this, I have added a functionality to clustering called "Tolerance". And it allows you to set a tolerance level for your Euclidean distance parameters. As a default, I have tested this with a default of 0.5 and it has worked great and no need to change even when working with large numbers such as NQ and ES1!.
However, I have added 2 additional regression types that can be done with KNN.
#1 One is a regression by the last IDENTICAL instance, which will find the most recent instance of a similar Independent variable and pull the Dependent variable from that instance. Or
#2 Average from all IDENTICAL instances.
Using the function
The code has the instructions for integrating the function into your own code, the parameters, and such, so I won't exhaust you with the boring details about that here.
But essentially, it exports 3, float variables, the Result, the Correlation, and the simplified R2.
As this is KNN regression, there are no coefficients, slopes, or intercepts and you do not need to test for linearity before applying it.
Also, the output can be a bit choppy, so I tend to like to throw in a bit of smoothing using the ta.sma function at a deault of 14.
For example, here is SPY from QQQ smoothed as a 14 SMA:
And it is unsmoothed:
It seems relatively similar but it does make a bit of an aesthetic difference. And if you are doing it over 14, there is no data loss and it is still quite reactive to changes in data.
And that's it! Hopefully you enjoy and find some interesting uses for this function in your own scripts :-).
Safe trades everyone!
Search in scripts for "bias"
MarketronShows you how the asset on the chart is trending versus the market. You can customise the market that it uses, and there are some common markets programmed in as options.
Displays moving averages and a simple red/green bias.
You could do this yourself by typing, e.g., ADAUSDT/TOTAL into the asset box in TradingView and adding some EMAs manually and then interpreting them by eye. There's no hidden technology in this indicator. It just makes it a lot easier.
You can choose various bias options.
I'm not sure if it will work at resolutions lower than one day, depending on the level of your TradingView plan.
These are all the user-configurable settings and what they do.
Market (Auto) – Choose from various preselected markets.
Market Ticker Manual Override – You can type in the ticker for your market if it's not in the list. If you do, it overrides the Auto list.
Show Classic EMAs – Show customisable Exponential Moving Averages.
Bias Mode – Derive the red/green bias from whether price is above/below the Classic EMAs, or from a custom EMA function, or both.
Show Bias Background – Colour the background, or not, with the directional bias.
EMA 1 Length (smallest) – The length for the smallest EMA.
EMA 2 Length – Length for the second EMA.
EMA 3 Length – Length for the third EMA.

Zigzag Trend/Divergence DetectorPullbacks are always hardest part of the trade and when it happen, we struggle to make decision on whether to continue the trade and wait for recovery or cut losses. Similarly, when an instrument is trending well, it is often difficult decision to make if we want to take some profit off the table. This indicator is aimed to make these decisions easier by providing a combined opinion of sentiment based on trend and possible divergence.
⬜ Process
▶ Use any indicator to find trend bias. Here we are using simple supertrend
▶ Use any oscillator. I have added few inbuilt oscillators as option. Default used is RSI.
▶ Find divergence by using zigzag to detect pivot high/low of price and observing indicator movement difference between subsequent pivots in the same direction.
▶ Combine divregence type, divergence bias and trend bias to derive overall sentiment.
Complete details of all the possible combinations are present here along with table legend
⬜Chart Legend
C - Continuation
D - Divergence
H - Hidden Divergence
I - Indeterminate
⬜ Settings
▶ Zigzag parameters : These let you chose zigzag properties. If you check "Use confirmed pivots", then unconfirmed pivot will be ignored in the table and in the chart
▶ Oscillator parameters : Lets you select different oscillators and settings. Available oscillators involve
CCI - Commodity Channel Index
CMO - Chande Momentum Oscillator
COG - Center Of Gravity
DMI - Directional Movement Index (Only ADX is used here)
MACD - Moving average convergence divergence (Can chose either histogram or MACD line)
MFI - Money Flow Index
MOM - Momentum oscillator
ROC - Rate Of Change
RSI - Relative Strength Index
TSI - Total Strength Index
WPR - William Percent R
BB - Bollinger Percent B
KC - Keltner Channel Percent K
DC - Donchian Channel Percent D
ADC - Adoptive Donchian Channel Percent D ( Adoptive-Donchian-Channel )
▶ Trend bias : Supertrend is used for trend bias. Coloring option color candles in the direction of supertrend. More option for trend bias can be added in future.
▶ Stats : Enables you to display history in tabular format.
Overview of settings present here:
⬜ Notes
Trend detection is done only with respect to previous pivot in the same direction. Hence, if chart has too many zigzags in short period, try increasing the zigzag length or chart timeframe. Similarly, if there is a steep trend, use lower timeframe charts to dig further.
Oscillators does not always make pivots at same bar as price. Due to this some the divergence calculation may not be correct. Hence visual inspection is always recommended.
⬜ Possible future enhancements
More options for trend bias
Enhance divergence calculation. Possible options include using oscillator based zigzag as primary or using close prices based zigzag instead of high/low.
Multi level zigzag option - Can be messy to include more than one zigzag. Option can be added to chose either Level1 or Level2 zigzags.
Alerts - Alerts can only be added for confirmed pivots - otherwise it will generate too many unwanted alerts. Will think about it :)
If I get time, I will try to make a video.

Market Efficiency DashboardDescription
This indicator is an analytical tool designed to visualize the relationship between price action and market efficiency. Based on the Choppiness Index (CI), this indicator identifies whether the market is in a state of Range Contraction (Consolidation) or Range Expansion (Trending) . This implementation introduces a unique 50-pivot baseline to better differentiate between these two market characters, providing traders with an objective view of volatility cycles.
Key Features
Volatility Cycle Logic: A refined implementation of the Choppiness Index that assists in filtering market noise during low-volatility periods.
Pivot-50 Visualization: A custom geometric layout that separates range contraction from trend expansion for faster visual interpretation.
Multi-Timeframe (MTF) Data Handling: Enables the monitoring of higher-timeframe efficiency cycles without switching charts.
Trend Context Filter: Integrates a 200-period EMA to provide a directional baseline relative to the current market state.
Real-Time Status Dashboard: A real-time data table providing a summary of current market efficiency and trend bias.
Signal Refinement: Includes optional smoothing (EMA/SMA/WMA) to reduce calculation "jitter" and provide clearer structural signals.
Inputs Overview
Choppiness Length: Sets the lookback period for the efficiency calculation (Default: 14).
Calculation Timeframe: Allows the user to select the source timeframe for the index data.
Smoothing Method: Users can choose between multiple moving average types to filter the raw index output.
Threshold Levels: Customizable Fibonacci-based levels (61.8 and 38.2) used to define the boundaries of "Choppy" and "Trending" environments.
EMA Filter: Toggle for the 200-period Exponential Moving Average used for directional bias.
How to Use
Context Identification: Observe the histogram’s position relative to the 50-pivot. Bars expanding upward toward the 61.8 level indicate the market is coiling/congested.
Trend Confirmation: Bars expanding downward toward the 38.2 level indicate the market is moving efficiently in a specific direction.
Bias Alignment: When the Trend Bias is Bullish and the state is Trending, price discovery is likely occurring to the upside. Conversely, a Bearish bias in a Trending state suggests efficient movement to the downside.
Risk Management: Rising choppiness levels often precede a period of trend exhaustion or reversal, signaling a potential time to reduce exposure.
How it Helps
This tool is designed to assist in objective decision-making by identifying the current "market character." By distinguishing between trending and non-trending environments, it helps traders select the appropriate strategy for the current context—avoiding trend-following entries during sideways markets and identifying when a market has entered a period of price expansion.
Alerts
Trend Starting: Triggers when the index crosses below the lower threshold, suggesting a transition into an efficient trend.
Squeeze/Consolidation: Notifies the user when the index crosses above the upper threshold, indicating range contraction.
Midpoint Cross: Signals when the index crosses the 50-level, marking a shift in market momentum.
⚠️ Disclaimer:
This script/indicator is not endorsed by, affiliated with, sponsored by, or connected to TradingView in any manner. The author is not a TradingView partner.
This script/indicator and all related content are provided “as is” and “as available,” without any warranties of any kind, express or implied. The content is strictly for educational and informational purposes and does not constitute financial, investment, trading, or legal advice.
The author makes no representations or guarantees regarding accuracy, reliability, profitability, or future performance. Use of this script/indicator is entirely at the user’s own risk, and the author assumes no liability for any losses, damages, or financial consequences arising from its use.

HTF Frequency Zone [BigBeluga]🔵 OVERVIEW
HTF Frequency Zone highlights the dominant price level (Point of Control) and the full high–low expansion of any higher timeframe — Daily, Weekly, or Monthly. It captures the frequency of closes inside each HTF candle and plots the most traded “frequency zone”, allowing traders to easily see where price spent the most time and where buy/sell pressure accumulated.
This tool transforms each higher-timeframe bar into a fully visualized structure:
• Top = HTF high
• Bottom = HTF low
• Midline = HTF Frequency POC
• Color-coded zones = bullish or bearish bias
• Labels = counts of bullish and bearish candles inside the HTF range
It is designed to give traders an immediate understanding of high-timeframe balance, imbalance, and price attraction zones.
🔵 CONCEPTS
HTF Partitioning — Each Weekly/Daily/Monthly candle is converted into a dedicated zone with its own High, Low, and Frequency Point of Control.
Frequency POC (Most Touched Price) — The indicator divides the HTF range into 100 bins and counts how many times price closed near each level.
Dominant Zone — The level with the highest frequency becomes the HTF “Value Zone,” plotted as a bold central line.
Directional Bias —
• Bullish HTF zone
• Bearish HTF zone
Internal Candle Counting — Within each HTF period the indicator counts:
• Buy candles (close > open)
• Sell candles (close < open)
This reveals whether intraperiod flow was bullish or bearish.
HTF Structure Blocks — High, Low, and POC are connected across the entire higher-timeframe duration, showing the real shape of HTF balance.
🔵 FEATURES
Automatic HTF Zone Construction — Generates a complete price zone every time the selected timeframe flips (Daily / Weekly / Monthly).
Dynamic High & Low Extraction — The indicator scans every bar inside the HTF window to find true extremes of the range.
100-Level Frequency Scan — Each close within the period is assigned to a bin, creating a detailed distribution of price interaction.
HTF POC Highlighting — The most frequent price level is plotted with a bold red line for immediate visual clarity.
Bull/Bear Coloring —
• Green → Bullish HTF zone.
• Orange → Bearish HTF zone.
Zone Shading — High–Low range is filled with a semi-transparent color matching trend direction.
Buy/Sell Candle Counters — Printed at the top and bottom of each HTF block, showing how many internal candles were bullish or bearish.
POC Label — Displays frequency count (how many touches) at the POC level.
Adaptive Threshold Warning — If bars inside the HTF window are too few (<10), the indicator warns the trader to switch timeframe.
🔵 HOW TO USE
Higher-Timeframe Biasing — Read the zone color to determine if the HTF candle leaned bullish or bearish.
Value Zone Reactions — Price often reacts to the Frequency POC; use it as support/resistance or liquidity magnet.
Range Context — Identify when price is trading near HTF highs (breakout potential) or lows (reversal potential).
Momentum Evaluation — More bullish internal candles = internal buying pressure; more bearish = internal selling pressure.
Swing Trading — Use HTF zones as the “macro map,” then execute trades on lower timeframes aligned with the zone structure.
Liquidity Awareness — The HTF POC often aligns with algorithmic liquidity levels, making it a strong reaction point.
🔵 CONCLUSION
HTF Frequency Zone transforms raw higher-timeframe candles into detailed distribution zones that reveal true market behavior inside the HTF structure. By showing highs, lows, buying/selling activity, and the most interacted price level (Frequency POC), this tool becomes invaluable for traders who want to align executions with powerful HTF levels, liquidity magnets, and structural zones.

Z-EMA Fusion BandsDesigned with crypto markets in mind, particularly Bitcoin , it builds on the concept that the 1-Week 50 EMA often serves as a long-term bull/bear market threshold — an area where institutional bias, momentum shifts, and cyclical rotations tend to occur.
🔹 Core Components & Synergies:
1. 1W 50 EMA (Higher Timeframe)
- This EMA is calculated on a weekly timeframe, regardless of your current chart.
- In crypto, price above the 1W 50 EMA typically aligns with long-term bull market phases, while extended periods below can signify bearish macro structure.
- The slope of the EMA is also analyzed to add directional confidence to trend strength.
2. ±1 Standard Deviation Bands
- Surrounding the 50 EMA, these bands visualize normal price dispersion relative to trend.
- When price consistently hugs or breaks outside these bands, it often reflects market expansion, volatility events, or mean-reversion opportunity.
3. Z-Score Gradient Fill
- The area between the bands is filled using a Z-score-based gradient, which dynamically adjusts color based on how far price is from the EMA (in terms of standard deviations).
- Color shifts from aqua (near EMA) to fuchsia (far from EMA) help you spot price compression, equilibrium, or overextension at a glance.
- The fill also uses transparency scaling, making it fade as price stretches further, emphasizing the core structure.
4. Directional EMA Coloring
- The EMA line itself is colored based on:
- The slope of the EMA (rising/falling)
- Whether the HTF candle is bullish or bearish
- This provides intuitive color-coded confirmation of momentum alignment or potential exhaustion.
5. Price/EMA Divergence Detection
- The script detects bullish and bearish divergence between price and the EMA (rather than using a traditional oscillator).
- Bullish Divergence: Price makes a lower low, EMA makes a higher low.
- Bearish Divergence: Price makes a higher high, EMA makes a lower high.
- These signals often mark transitional zones where momentum fades before a trend reversal or correction.
📊 Suggested Uses:
🔸 Swing and Position Trading:
- Use the 1W 50 EMA as a macro-trend anchor.
- Stay long-biased when price is above with positive slope, and short-biased when below.
- Consider entries near band edges for mean-reversion plays, especially if confluence forms with divergence signals.
🔸 Volatility-Based Filtering:
- Use the Z-score fill to identify volatility compression (near EMA) or expansion (edge of bands).
- Combine this with breakout strategies or dynamic position sizing.
🔸 Divergence Confirmation:
- Combine divergence markers with HTF EMA slope for high-probability setups.
- Bullish div + EMA flattening/rising can signal the start of accumulation after a macro dip.
🔸 Multi-Timeframe Analysis:
- Works well as a structural overlay on intraday charts (1H, 4H, 1D).
- Use this indicator to track long-term bias while executing lower timeframe trades.
⚠️ Disclaimer:
This indicator is designed for educational and informational purposes only. It does not constitute financial advice or a recommendation to buy or sell any asset.
Always use proper risk management, and combine with your own analysis, tools, and strategy. Performance in past market conditions does not guarantee future results.

Directional Indicator Crossovers v1[JopAlgo]Directional Indicator Crossovers v1 — the classic DMI, made clearer and easier to act on
We'd like to introduce you to a more relaxed, streamlined version of DI. While it may not seem like it at first glance, we've taken the D+/D- method as a starting point and developed our own version of this indicator: two lines, a smooth green/red field indicating who's in control, and clear crossover alerts for a flip. We deliberately chose the step line representation because it closely matches the candlestick patterns on the chart. Designed to help you react faster—without clutter.
What you’ll see
+DI (green) and −DI (red) using classic Wilder smoothing.
A soft control zone between the lines: green when +DI dominates, red when −DI dominates.
Crossover alerts (no labels, no background flooding)—just the turning points.
Why this helps
Instant bias: the shaded field tells you who’s in control without reading values.
Cleaner execution: minimal visuals keep focus on the handoff (+DI↔−DI) and your price levels.
Actionable by design: built-in alerts fire right at the flip to route into your workflow.
How to read it
Bias: Green zone → buyers lead. Red zone → sellers lead.
Trigger: Consider entries on the DI crossover that aligns with your higher-timeframe context (trend, S/R, OB).
Patience in chop: If flips are frequent in tight ranges, wait for sustained zone dominance or confirm on a higher TF.
Exit/flip: Opposite crossover or a clear loss of dominance.
Settings that matter
DI Length (default 14): Higher = calmer, fewer flips. Lower = faster, more signals.
Visuals: Keep the control zone on for quick reads; hide crossover marks if you prefer pure lines.
Alerts: Enable bullish and bearish DI cross alerts; connect to notifications or webhooks as needed.
Starter presets
Intraday (15m–1H): DI Length 12–14 for quicker handoffs.
Swing (4H–1D): DI Length 14–20 for cleaner signals.
Choppy assets: Nudge length higher to dampen noise.
Where it shines (and limits)
Best: Liquid markets (crypto majors, indices, large caps) where handoffs matter.
Works elsewhere: Still useful on slower pairs; extend length for stability.
Limit: Frequent flips in low-range sessions—pair with HTF bias or structure.
Alerts included
Bullish DI Crossover: +DI crosses above −DI.
Bearish DI Crossover: −DI crosses above +DI.
Attribution & License
Built on the Directional Movement Index concept by J. Welles Wilder Jr. (1978).
Independent Pine v6 implementation (not derived from TradingView’s built-in source).
Released as Open Source (MPL-2.0)—please keep the license header intact.
Disclaimer
For educational purposes only; not financial advice. Trading involves risk. Test first, use clear levels, and manage risk. This project is independent and not affiliated with or endorsed by TradingView.
Keltner Channel Enhanced [DCAUT]█ Keltner Channel Enhanced
📊 ORIGINALITY & INNOVATION
The Keltner Channel Enhanced represents an important advancement over standard Keltner Channel implementations by introducing dual flexibility in moving average selection for both the middle band and ATR calculation. While traditional Keltner Channels typically use EMA for the middle band and RMA (Wilder's smoothing) for ATR, this enhanced version provides access to 25+ moving average algorithms for both components, enabling traders to fine-tune the indicator's behavior to match specific market characteristics and trading approaches.
Key Advancements:
Dual MA Algorithm Flexibility: Independent selection of moving average types for middle band (25+ options) and ATR smoothing (25+ options), allowing optimization of both trend identification and volatility measurement separately
Enhanced Trend Sensitivity: Ability to use faster algorithms (HMA, T3) for middle band while maintaining stable volatility measurement with traditional ATR smoothing, or vice versa for different trading strategies
Adaptive Volatility Measurement: Choice of ATR smoothing algorithm affects channel responsiveness to volatility changes, from highly reactive (SMA, EMA) to smoothly adaptive (RMA, TEMA)
Comprehensive Alert System: Five distinct alert conditions covering breakouts, trend changes, and volatility expansion, enabling automated monitoring without constant chart observation
Multi-Timeframe Compatibility: Works effectively across all timeframes from intraday scalping to long-term position trading, with independent optimization of trend and volatility components
This implementation addresses key limitations of standard Keltner Channels: fixed EMA/RMA combination may not suit all market conditions or trading styles. By decoupling the trend component from volatility measurement and allowing independent algorithm selection, traders can create highly customized configurations for specific instruments and market phases.
📐 MATHEMATICAL FOUNDATION
Keltner Channel Enhanced uses a three-component calculation system that combines a flexible moving average middle band with ATR-based (Average True Range) upper and lower channels, creating volatility-adjusted trend-following bands.
Core Calculation Process:
1. Middle Band (Basis) Calculation:
The basis line is calculated using the selected moving average algorithm applied to the price source over the specified period:
basis = ma(source, length, maType)
Supported algorithms include EMA (standard choice, trend-biased), SMA (balanced and symmetric), HMA (reduced lag), WMA, VWMA, TEMA, T3, KAMA, and 17+ others.
2. Average True Range (ATR) Calculation:
ATR measures market volatility by calculating the average of true ranges over the specified period:
trueRange = max(high - low, abs(high - close ), abs(low - close ))
atrValue = ma(trueRange, atrLength, atrMaType)
ATR smoothing algorithm significantly affects channel behavior, with options including RMA (standard, very smooth), SMA (moderate smoothness), EMA (fast adaptation), TEMA (smooth yet responsive), and others.
3. Channel Calculation:
Upper and lower channels are positioned at specified multiples of ATR from the basis:
upperChannel = basis + (multiplier × atrValue)
lowerChannel = basis - (multiplier × atrValue)
Standard multiplier is 2.0, providing channels that dynamically adjust width based on market volatility.
Keltner Channel vs. Bollinger Bands - Key Differences:
While both indicators create volatility-based channels, they use fundamentally different volatility measures:
Keltner Channel (ATR-based):
Uses Average True Range to measure actual price movement volatility
Incorporates gaps and limit moves through true range calculation
More stable in trending markets, less prone to extreme compression
Better reflects intraday volatility and trading range
Typically fewer band touches, making touches more significant
More suitable for trend-following strategies
Bollinger Bands (Standard Deviation-based):
Uses statistical standard deviation to measure price dispersion
Based on closing prices only, doesn't account for intraday range
Can compress significantly during consolidation (squeeze patterns)
More touches in ranging markets
Better suited for mean-reversion strategies
Provides statistical probability framework (95% within 2 standard deviations)
Algorithm Combination Effects:
The interaction between middle band MA type and ATR MA type creates different indicator characteristics:
Trend-Focused Configuration (Fast MA + Slow ATR): Middle band uses HMA/EMA/T3, ATR uses RMA/TEMA, quick trend changes with stable channel width, suitable for trend-following
Volatility-Focused Configuration (Slow MA + Fast ATR): Middle band uses SMA/WMA, ATR uses EMA/SMA, stable trend with dynamic channel width, suitable for volatility trading
Balanced Configuration (Standard EMA/RMA): Classic Keltner Channel behavior, time-tested combination, suitable for general-purpose trend following
Adaptive Configuration (KAMA + KAMA): Self-adjusting indicator responding to efficiency ratio, suitable for markets with varying trend strength and volatility regimes
📊 COMPREHENSIVE SIGNAL ANALYSIS
Keltner Channel Enhanced provides multiple signal categories optimized for trend-following and breakout strategies.
Channel Position Signals:
Upper Channel Interaction:
Price Touching Upper Channel: Strong bullish momentum, price moving more than typical volatility range suggests, potential continuation signal in established uptrends
Price Breaking Above Upper Channel: Exceptional strength, price exceeding normal volatility expectations, consider adding to long positions or tightening trailing stops
Price Riding Upper Channel: Sustained strong uptrend, characteristic of powerful bull moves, stay with trend and avoid premature profit-taking
Price Rejection at Upper Channel: Momentum exhaustion signal, consider profit-taking on longs or waiting for pullback to middle band for reentry
Lower Channel Interaction:
Price Touching Lower Channel: Strong bearish momentum, price moving more than typical volatility range suggests, potential continuation signal in established downtrends
Price Breaking Below Lower Channel: Exceptional weakness, price exceeding normal volatility expectations, consider adding to short positions or protecting against further downside
Price Riding Lower Channel: Sustained strong downtrend, characteristic of powerful bear moves, stay with trend and avoid premature covering
Price Rejection at Lower Channel: Momentum exhaustion signal, consider covering shorts or waiting for bounce to middle band for reentry
Middle Band (Basis) Signals:
Trend Direction Confirmation:
Price Above Basis: Bullish trend bias, middle band acts as dynamic support in uptrends, consider long positions or holding existing longs
Price Below Basis: Bearish trend bias, middle band acts as dynamic resistance in downtrends, consider short positions or avoiding longs
Price Crossing Above Basis: Potential trend change from bearish to bullish, early signal to establish long positions
Price Crossing Below Basis: Potential trend change from bullish to bearish, early signal to establish short positions or exit longs
Pullback Trading Strategy:
Uptrend Pullback: Price pulls back from upper channel to middle band, finds support, and resumes upward, ideal long entry point
Downtrend Bounce: Price bounces from lower channel to middle band, meets resistance, and resumes downward, ideal short entry point
Basis Test: Strong trends often show price respecting the middle band as support/resistance on pullbacks
Failed Test: Price breaking through middle band against trend direction signals potential reversal
Volatility-Based Signals:
Narrow Channels (Low Volatility):
Consolidation Phase: Channels contract during periods of reduced volatility and directionless price action
Breakout Preparation: Narrow channels often precede significant directional moves as volatility cycles
Trading Approach: Reduce position sizes, wait for breakout confirmation, avoid range-bound strategies within channels
Breakout Direction: Monitor for price breaking decisively outside channel range with expanding width
Wide Channels (High Volatility):
Trending Phase: Channels expand during strong directional moves and increased volatility
Momentum Confirmation: Wide channels confirm genuine trend with substantial volatility backing
Trading Approach: Trend-following strategies excel, wider stops necessary, mean-reversion strategies risky
Exhaustion Signs: Extreme channel width (historical highs) may signal approaching consolidation or reversal
Advanced Pattern Recognition:
Channel Walking Pattern:
Upper Channel Walk: Price consistently touches or exceeds upper channel while staying above basis, very strong uptrend signal, hold longs aggressively
Lower Channel Walk: Price consistently touches or exceeds lower channel while staying below basis, very strong downtrend signal, hold shorts aggressively
Basis Support/Resistance: During channel walks, price typically uses middle band as support/resistance on minor pullbacks
Pattern Break: Price crossing basis during channel walk signals potential trend exhaustion
Squeeze and Release Pattern:
Squeeze Phase: Channels narrow significantly, price consolidates near middle band, volatility contracts
Direction Clues: Watch for price positioning relative to basis during squeeze (above = bullish bias, below = bearish bias)
Release Trigger: Price breaking outside narrow channel range with expanding width confirms breakout
Follow-Through: Measure squeeze height and project from breakout point for initial profit targets
Channel Expansion Pattern:
Breakout Confirmation: Rapid channel widening confirms volatility increase and genuine trend establishment
Entry Timing: Enter positions early in expansion phase before trend becomes overextended
Risk Management: Use channel width to size stops appropriately, wider channels require wider stops
Basis Bounce Pattern:
Clean Bounce: Price touches middle band and immediately reverses, confirms trend strength and entry opportunity
Multiple Bounces: Repeated basis bounces indicate strong, sustainable trend
Bounce Failure: Price penetrating basis signals weakening trend and potential reversal
Divergence Analysis:
Price/Channel Divergence: Price makes new high/low while staying within channel (not reaching outer band), suggests momentum weakening
Width/Price Divergence: Price breaks to new extremes but channel width contracts, suggests move lacks conviction
Reversal Signal: Divergences often precede trend reversals or significant consolidation periods
Multi-Timeframe Analysis:
Keltner Channels work particularly well in multi-timeframe trend-following approaches:
Three-Timeframe Alignment:
Higher Timeframe (Weekly/Daily): Identify major trend direction, note price position relative to basis and channels
Intermediate Timeframe (Daily/4H): Identify pullback opportunities within higher timeframe trend
Lower Timeframe (4H/1H): Time precise entries when price touches middle band or lower channel (in uptrends) with rejection
Optimal Entry Conditions:
Best Long Entries: Higher timeframe in uptrend (price above basis), intermediate timeframe pulls back to basis, lower timeframe shows rejection at middle band or lower channel
Best Short Entries: Higher timeframe in downtrend (price below basis), intermediate timeframe bounces to basis, lower timeframe shows rejection at middle band or upper channel
Risk Management: Use higher timeframe channel width to set position sizing, stops below/above higher timeframe channels
🎯 STRATEGIC APPLICATIONS
Keltner Channel Enhanced excels in trend-following and breakout strategies across different market conditions.
Trend Following Strategy:
Setup Requirements:
Identify established trend with price consistently on one side of basis line
Wait for pullback to middle band (basis) or brief penetration through it
Confirm trend resumption with price rejection at basis and move back toward outer channel
Enter in trend direction with stop beyond basis line
Entry Rules:
Uptrend Entry:
Price pulls back from upper channel to middle band, shows support at basis (bullish candlestick, momentum divergence)
Enter long on rejection/bounce from basis with stop 1-2 ATR below basis
Aggressive: Enter on first touch; Conservative: Wait for confirmation candle
Downtrend Entry:
Price bounces from lower channel to middle band, shows resistance at basis (bearish candlestick, momentum divergence)
Enter short on rejection/reversal from basis with stop 1-2 ATR above basis
Aggressive: Enter on first touch; Conservative: Wait for confirmation candle
Trend Management:
Trailing Stop: Use basis line as dynamic trailing stop, exit if price closes beyond basis against position
Profit Taking: Take partial profits at opposite channel, move stops to basis
Position Additions: Add to winners on subsequent basis bounces if trend intact
Breakout Strategy:
Setup Requirements:
Identify consolidation period with contracting channel width
Monitor price action near middle band with reduced volatility
Wait for decisive breakout beyond channel range with expanding width
Enter in breakout direction after confirmation
Breakout Confirmation:
Price breaks clearly outside channel (upper for longs, lower for shorts), channel width begins expanding from contracted state
Volume increases significantly on breakout (if using volume analysis)
Price sustains outside channel for multiple bars without immediate reversal
Entry Approaches:
Aggressive: Enter on initial break with stop at opposite channel or basis, use smaller position size
Conservative: Wait for pullback to broken channel level, enter on rejection and resumption, tighter stop
Volatility-Based Position Sizing:
Adjust position sizing based on channel width (ATR-based volatility):
Wide Channels (High ATR): Reduce position size as stops must be wider, calculate position size using ATR-based risk calculation: Risk / (Stop Distance in ATR × ATR Value)
Narrow Channels (Low ATR): Increase position size as stops can be tighter, be cautious of impending volatility expansion
ATR-Based Risk Management: Use ATR-based risk calculations, position size = 0.01 × Capital / (2 × ATR), use multiples of ATR (1-2 ATR) for adaptive stops
Algorithm Selection Guidelines:
Different market conditions benefit from different algorithm combinations:
Strong Trending Markets: Middle band use EMA or HMA, ATR use RMA, capture trends quickly while maintaining stable channel width
Choppy/Ranging Markets: Middle band use SMA or WMA, ATR use SMA or WMA, avoid false trend signals while identifying genuine reversals
Volatile Markets: Middle band and ATR both use KAMA or FRAMA, self-adjusting to changing market conditions reduces manual optimization
Breakout Trading: Middle band use SMA, ATR use EMA or SMA, stable trend with dynamic channels highlights volatility expansion early
Scalping/Day Trading: Middle band use HMA or T3, ATR use EMA or TEMA, both components respond quickly
Position Trading: Middle band use EMA/TEMA/T3, ATR use RMA or TEMA, filter out noise for long-term trend-following
📋 DETAILED PARAMETER CONFIGURATION
Understanding and optimizing parameters is essential for adapting Keltner Channel Enhanced to specific trading approaches.
Source Parameter:
Close (Most Common): Uses closing price, reflects daily settlement, best for end-of-day analysis and position trading, standard choice
HL2 (Median Price): Smooths out closing bias, better represents full daily range in volatile markets, good for swing trading
HLC3 (Typical Price): Gives more weight to close while including full range, popular for intraday applications, slightly more responsive than HL2
OHLC4 (Average Price): Most comprehensive price representation, smoothest option, good for gap-prone markets or highly volatile instruments
Length Parameter:
Controls the lookback period for middle band (basis) calculation:
Short Periods (10-15): Very responsive to price changes, suitable for day trading and scalping, higher false signal rate
Standard Period (20 - Default): Represents approximately one month of trading, good balance between responsiveness and stability, suitable for swing and position trading
Medium Periods (30-50): Smoother trend identification, fewer false signals, better for position trading and longer holding periods
Long Periods (50+): Very smooth, identifies major trends only, minimal false signals but significant lag, suitable for long-term investment
Optimization by Timeframe: 1-15 minute charts use 10-20 period, 30-60 minute charts use 20-30 period, 4-hour to daily charts use 20-40 period, weekly charts use 20-30 weeks.
ATR Length Parameter:
Controls the lookback period for Average True Range calculation, affecting channel width:
Short ATR Periods (5-10): Very responsive to recent volatility changes, standard is 10 (Keltner's original specification), may be too reactive in whipsaw conditions
Standard ATR Period (10 - Default): Chester Keltner's original specification, good balance between responsiveness and stability, most widely used
Medium ATR Periods (14-20): Smoother channel width, ATR 14 aligns with Wilder's original ATR specification, good for position trading
Long ATR Periods (20+): Very smooth channel width, suitable for long-term trend-following
Length vs. ATR Length Relationship: Equal values (20/20) provide balanced responsiveness, longer ATR (20/14) gives more stable channel width, shorter ATR (20/10) is standard configuration, much shorter ATR (20/5) creates very dynamic channels.
Multiplier Parameter:
Controls channel width by setting ATR multiples:
Lower Values (1.0-1.5): Tighter channels with frequent price touches, more trading signals, higher false signal rate, better for range-bound and mean-reversion strategies
Standard Value (2.0 - Default): Chester Keltner's recommended setting, good balance between signal frequency and reliability, suitable for both trending and ranging strategies
Higher Values (2.5-3.0): Wider channels with less frequent touches, fewer but potentially higher-quality signals, better for strong trending markets
Market-Specific Optimization: High volatility markets (crypto, small-caps) use 2.5-3.0 multiplier, medium volatility markets (major forex, large-caps) use 2.0 multiplier, low volatility markets (bonds, utilities) use 1.5-2.0 multiplier.
MA Type Parameter (Middle Band):
Critical selection that determines trend identification characteristics:
EMA (Exponential Moving Average - Default): Standard Keltner Channel choice, Chester Keltner's original specification, emphasizes recent prices, faster response to trend changes, suitable for all timeframes
SMA (Simple Moving Average): Equal weighting of all data points, no directional bias, slower than EMA, better for ranging markets and mean-reversion
HMA (Hull Moving Average): Minimal lag with smooth output, excellent for fast trend identification, best for day trading and scalping
TEMA (Triple Exponential Moving Average): Advanced smoothing with reduced lag, responsive to trends while filtering noise, suitable for volatile markets
T3 (Tillson T3): Very smooth with minimal lag, excellent for established trend identification, suitable for position trading
KAMA (Kaufman Adaptive Moving Average): Automatically adjusts speed based on market efficiency, slow in ranging markets, fast in trends, suitable for markets with varying conditions
ATR MA Type Parameter:
Determines how Average True Range is smoothed, affecting channel width stability:
RMA (Wilder's Smoothing - Default): J. Welles Wilder's original ATR smoothing method, very smooth, slow to adapt to volatility changes, provides stable channel width
SMA (Simple Moving Average): Equal weighting, moderate smoothness, faster response to volatility changes than RMA, more dynamic channel width
EMA (Exponential Moving Average): Emphasizes recent volatility, quick adaptation to new volatility regimes, very responsive channel width changes
TEMA (Triple Exponential Moving Average): Smooth yet responsive, good balance for varying volatility, suitable for most trading styles
Parameter Combination Strategies:
Conservative Trend-Following: Length 30/ATR Length 20/Multiplier 2.5, MA Type EMA or TEMA/ATR MA Type RMA, smooth trend with stable wide channels, suitable for position trading
Standard Balanced Approach: Length 20/ATR Length 10/Multiplier 2.0, MA Type EMA/ATR MA Type RMA, classic Keltner Channel configuration, suitable for general purpose swing trading
Aggressive Day Trading: Length 10-15/ATR Length 5-7/Multiplier 1.5-2.0, MA Type HMA or EMA/ATR MA Type EMA or SMA, fast trend with dynamic channels, suitable for scalping and day trading
Breakout Specialist: Length 20-30/ATR Length 5-10/Multiplier 2.0, MA Type SMA or WMA/ATR MA Type EMA or SMA, stable trend with responsive channel width
Adaptive All-Conditions: Length 20/ATR Length 10/Multiplier 2.0, MA Type KAMA or FRAMA/ATR MA Type KAMA or TEMA, self-adjusting to market conditions
Offset Parameter:
Controls horizontal positioning of channels on chart. Positive values shift channels to the right (future) for visual projection, negative values shift left (past) for historical analysis, zero (default) aligns with current price bars for real-time signal analysis. Offset affects only visual display, not alert conditions or actual calculations.
📈 PERFORMANCE ANALYSIS & COMPETITIVE ADVANTAGES
Keltner Channel Enhanced provides improvements over standard implementations while maintaining proven effectiveness.
Response Characteristics:
Standard EMA/RMA Configuration: Moderate trend lag (approximately 0.4 × length periods), smooth and stable channel width from RMA smoothing, good balance for most market conditions
Fast HMA/EMA Configuration: Approximately 60% reduction in trend lag compared to EMA, responsive channel width from EMA ATR smoothing, suitable for quick trend changes and breakouts
Adaptive KAMA/KAMA Configuration: Variable lag based on market efficiency, automatic adjustment to trending vs. ranging conditions, self-optimizing behavior reduces manual intervention
Comparison with Traditional Keltner Channels:
Enhanced Version Advantages:
Dual Algorithm Flexibility: Independent MA selection for trend and volatility vs. fixed EMA/RMA, separate tuning of trend responsiveness and channel stability
Market Adaptation: Choose configurations optimized for specific instruments and conditions, customize for scalping, swing, or position trading preferences
Comprehensive Alerts: Enhanced alert system including channel expansion detection
Traditional Version Advantages:
Simplicity: Fewer parameters, easier to understand and implement
Standardization: Fixed EMA/RMA combination ensures consistency across users
Research Base: Decades of backtesting and research on standard configuration
When to Use Enhanced Version: Trading multiple instruments with different characteristics, switching between trending and ranging markets, employing different strategies, algorithm-based trading systems requiring customization, seeking optimization for specific trading style and timeframe.
When to Use Standard Version: Beginning traders learning Keltner Channel concepts, following published research or trading systems, preferring simplicity and standardization, wanting to avoid optimization and curve-fitting risks.
Performance Across Market Conditions:
Strong Trending Markets: EMA or HMA basis with RMA or TEMA ATR smoothing provides quicker trend identification, pullbacks to basis offer excellent entry opportunities
Choppy/Ranging Markets: SMA or WMA basis with RMA ATR smoothing and lower multipliers, channel bounce strategies work well, avoid false breakouts
Volatile Markets: KAMA or FRAMA with EMA or TEMA, adaptive algorithms excel by automatic adjustment, wider multipliers (2.5-3.0) accommodate large price swings
Low Volatility/Consolidation: Channels narrow significantly indicating consolidation, algorithm choice less impactful, focus on detecting channel width contraction for breakout preparation
Keltner Channel vs. Bollinger Bands - Usage Comparison:
Favor Keltner Channels When: Trend-following is primary strategy, trading volatile instruments with gaps, want ATR-based volatility measurement, prefer fewer higher-quality channel touches, seeking stable channel width during trends.
Favor Bollinger Bands When: Mean-reversion is primary strategy, trading instruments with limited gaps, want statistical framework based on standard deviation, need squeeze patterns for breakout identification, prefer more frequent trading opportunities.
Use Both Together: Bollinger Band squeeze + Keltner Channel breakout is powerful combination, price outside Bollinger Bands but inside Keltner Channels indicates moderate signal, price outside both indicates very strong signal, Bollinger Bands for entries and Keltner Channels for trend confirmation.
Limitations and Considerations:
General Limitations:
Lagging Indicator: All moving averages lag price, even with reduced-lag algorithms
Trend-Dependent: Works best in trending markets, less effective in choppy conditions
No Direction Prediction: Indicates volatility and deviation, not future direction, requires confirmation
Enhanced Version Specific Considerations:
Optimization Risk: More parameters increase risk of curve-fitting historical data
Complexity: Additional choices may overwhelm beginning traders
Backtesting Challenges: Different algorithms produce different historical results
Mitigation Strategies:
Use Confirmation: Combine with momentum indicators (RSI, MACD), volume, or price action
Test Parameter Robustness: Ensure parameters work across range of values, not just optimized ones
Multi-Timeframe Analysis: Confirm signals across different timeframes
Proper Risk Management: Use appropriate position sizing and stops
Start Simple: Begin with standard EMA/RMA before exploring alternatives
Optimal Usage Recommendations:
For Maximum Effectiveness:
Start with standard EMA/RMA configuration to understand classic behavior
Experiment with alternatives on demo account or paper trading
Match algorithm combination to market condition and trading style
Use channel width analysis to identify market phases
Combine with complementary indicators for confirmation
Implement strict risk management using ATR-based position sizing
Focus on high-quality setups rather than trading every signal
Respect the trend: trade with basis direction for higher probability
Complementary Indicators:
RSI or Stochastic: Confirm momentum at channel extremes
MACD: Confirm trend direction and momentum shifts
Volume: Validate breakouts and trend strength
ADX: Measure trend strength, avoid Keltner signals in weak trends
Support/Resistance: Combine with traditional levels for high-probability setups
Bollinger Bands: Use together for enhanced breakout and volatility analysis
USAGE NOTES
This indicator is designed for technical analysis and educational purposes. Keltner Channel Enhanced has limitations and should not be used as the sole basis for trading decisions. While the flexible moving average selection for both trend and volatility components provides valuable adaptability across different market conditions, algorithm performance varies with market conditions, and past characteristics do not guarantee future results.
Key considerations:
Always use multiple forms of analysis and confirmation before entering trades
Backtest any parameter combination thoroughly before live trading
Be aware that optimization can lead to curve-fitting if not done carefully
Start with standard EMA/RMA settings and adjust only when specific conditions warrant
Understand that no moving average algorithm can eliminate lag entirely
Consider market regime (trending, ranging, volatile) when selecting parameters
Use ATR-based position sizing and risk management on every trade
Keltner Channels work best in trending markets, less effective in choppy conditions
Respect the trend direction indicated by price position relative to basis line
The enhanced flexibility of dual algorithm selection provides powerful tools for adaptation but requires responsible use, thorough understanding of how different algorithms behave under various market conditions, and disciplined risk management.

Advanced Market Structure [OmegaTools]📌 Market Structure
Advanced Market Structure is a next–generation indicator designed to decode price structure in real time by combining classical swing–based analysis with modern quantitative confirmation techniques. Built for traders who demand both precision and adaptability, it provides a robust multi–layered framework to identify structural shifts, trend continuations, and potential reversals across any asset class or timeframe.
Unlike traditional structure indicators that rely solely on visual swing identification, Market Structure introduces an integrated methodology: pivot detection, Donchian trend modeling, statistical confirmation via Z–Score, and volume–based validation. Each element contributes to a comprehensive, systematic representation of the underlying market dynamics.
🔑 Core Features
1. Five Distinct Market Structure Modes
Standard Mode:
Captures structural breaks through classical swing high/low pivots. Ideal for discretionary traders looking for clarity in directional bias.
Confirmed Breakout Mode:
Requires validation beyond the initial pivot break, filtering out noise and reducing false positives.
Donchian Trend HL (High/Low):
Establishes structure based on absolute highs and lows over rolling lookback windows. This approach highlights broader momentum shifts and trend–defining extremes.
Donchian Trend CC (Close/Close):
Similar to HL mode, but calculated using closing prices, enabling more precise bias identification where close–to–close structure carries stronger statistical weight.
Average Mode:
A composite methodology that synthesizes the four models into a weighted signal, producing a balanced structural bias designed to minimize model–specific weaknesses.
2. Dynamic Pivot Recognition with Auto–Updating Levels
Swing highs and lows are automatically detected and plotted with adaptive horizontal levels. These dynamic support/resistance markers continuously extend into the future, ensuring that historically significant levels remain visible and actionable.
3. Color–Adaptive Candlesticks
Price bars are dynamically recolored to reflect the prevailing structural regime: bullish (default blue), bearish (default red), or neutral (gray). This enables instant visual recognition of regime changes without requiring external confirmation.
4. Statistical Reversal Triggers
The script integrates a 21–period Z–Score calculation applied to closing prices, combined with multi–layered volume confirmation (SMA and EMA convergence).
Bullish trigger: Z–Score < –2 with structural confirmation and volume support.
Bearish trigger: Z–Score > +2 with structural confirmation and volume support.
Signals are plotted as diamond markers above or below the bars, identifying potential high–probability reversal setups in real time.
5. Integrated Alpha Backtesting Engine
Each market structure mode is evaluated through a built–in backtesting routine, tracking hit ratios and consistency across the most recent ~2000 structural events.
Performance metrics (“Alpha”) are displayed directly on–chart via a dedicated Performance Dashboard Table, allowing side–by–side comparison of Standard, Confirmed Breakout, Donchian HL, Donchian CC, and Average models.
Traders can instantly evaluate which structural methodology best adapts to the current market conditions.
🎯 Practical Advantages
Systematic Clarity: Eliminates subjectivity in defining structural bias, offering a rules–based framework.
Statistical Transparency: Built–in performance metrics validate each mode in real time, allowing informed decision–making.
Noise Reduction: Confirmed Breakouts and Donchian modes filter out common traps in structural trading.
Multi–Asset Adaptability: Optimized for scalping, intraday, swing, and multi–day strategies across FX, equities, futures, commodities, and crypto.
Complementary Usage: Works as a stand–alone structure identifier or as a quantitative filter in larger algorithmic/trading frameworks.
⚙️ Ideal Users
Discretionary traders seeking an objective reference for structural bias.
Quantitative/systematic traders requiring on–chart statistical validation of structural regimes.
Technical analysts leveraging pivots, Donchian channels, and price action as part of broader frameworks.
Portfolio traders integrating structure into multi–factor models.
💡 Why This Tool?
Market Structure is not a static indicator — it is an adaptive framework. By merging classical pivot theory with Donchian–style momentum analysis, and reinforcing both with statistical backtesting and volume confirmation, it provides traders with a unique ability:
To see the structure,
To measure its reliability,
And to act with confidence on quantifiably validated signals.

Supertrend [TradingConToto]Supertrend — ADX/DI + EMA Gap + Breakout (with Mobile UI)
What makes it original
Supertrend combines trend strength (ADX/DI), multi-timeframe bias (EMA63 and EMA 200D equivalent), a structural filter based on the distance between EMA2400 and EMA4800 expressed in ATR units, and a momentum confirmation through a previous high breakout.
This is not a random mashup — it’s a sequence of filters designed to reduce trades in ranging markets and prioritize mature trends:
Direction: +DI > -DI (trend led by buyers).
Strength: ADX > mean(ADX) (avoids weak, choppy phases).
Short-term bias: Close > EMA63.
Long-term bias: Close > EMA4800 ≈ EMA200 daily on H1.
Momentum: Close > High (immediate breakout).
Structure: (EMA2400 − EMA4800) > k·ATR (ensures separation in ATR units, filters out flat phases).
Entries & exits
Entry: when all six conditions are met and no open position exists.
Exit: if +DI < -DI or Close < EMA63.
Visuals: EMA63 is painted green while in position and red otherwise, with a supertrend-style band; “BUY” labels appear below the green band and “SELL” labels above the red band.
UI: includes a compact table (mobile-friendly) showing the state of each condition.
Default parameters used in this publication
Initial capital: 10,000
Position size: 10% of equity (≤10% per trade is considered sustainable).
Commission: 0.01% per side (adjust to your broker/market).
Slippage: 1 tick
Pyramiding: 0 (only one position at a time)
Adjust commission/slippage to match your market. For US equities, commissions are often per share; for spot crypto, 0.10–0.20% total is common. I publish with 0.01% per side as a conservative example to avoid overestimating results.
Recommended backtest dataset
Timeframe: H1
Multi-cycle window (e.g. 2015–today)
Symbols with high liquidity (e.g. NASDAQ-100 large caps, or BTC/ETH spot) to generate 100+ trades. Avoid cherry-picked short windows.
Why each filter matters
+DI > -DI + ADX > mean: reduce counter-trend trades and weak signals.
Close > EMA63 + Close > EMA4800: enforce trend alignment in short and long horizons.
Breakout High : requires immediate momentum, avoids early entries.
EMA gap in ATR units: blocks flat or compressed structures where EMA200D aligns with price.
Limitations
The breakout filter may skip healthy pullbacks; the design prioritizes continuation over perfect entry price.
No fixed trailing stop/TP; exits depend on trend degradation via DI/EMA63.
Results vary with real costs (commissions, slippage, funding). Adjust defaults to your broker.
How to use
Apply it on a clean chart (no other indicators when publishing).
Keep in mind the default parameters above; if you change them, mention it in your notes and use the same values in the Strategy Tester.
Ensure your dataset produces 100+ trades for statistical validity.

Perp Imbalance Zones • Pro (clean)USD Premium (perp vs spot) → (Perp − Spot) / Spot.
Imbalance (z-score of that premium) → how extreme the current premium is relative to its own history over lenPrem bars.
Hysteresis state machine → flips to a SHORT bias when perp-long pressure is extreme; flips to LONG bias when perp-short pressure is extreme. It exits only after the imbalance cools (prevents whipsaw).
Price stretch filter (±σ) → optional Bollinger check so signals only fire when price is already stretched.
HTF confirmation (optional) → require higher-timeframe imbalance to agree with the current-TF bias.
Gradient visuals → line + background tint deepen as |z| grows (more extreme pressure).
What you see on the pane
A single line (z):
Above 0 = perp richer than spot (perp longs pressing).
Below 0 = perp cheaper than spot (perp shorts pressing).
Guides: dotted levels at ±enterZ (entry) and ±exitZ (cool-off/exit).
Background tint:
Red when state = SHORT bias (perp longs heavy).
Blue when state = LONG bias (perp shorts heavy).
Tint intensity scales with |z| (via hotZ).
Labels (optional): prints when bias flips.
Alerts (optional): “Enter SHORT/LONG bias” and “Exit bias”.
How to use it (playbook)
Attach & set symbols
Put the script on your chart.
Set Spot symbol and Perp symbol to the venue you trade (e.g., BINANCE:BTCUSDT + BINANCE:BTCUSDTPERP).
Read the bias
SHORT bias (red background): perp longs over-extended. Look for short entries if price is at resistance, σ-stretched, or your PA system agrees.
LONG bias (blue background): perp shorts over-extended. Look for long entries at support/σ-stretched down.
Entries
Use the bias flip as a context/confirm. Combine with your structure trigger (OB/level sweep, rejection wick, micro-break in market structure, etc.).
If useSigma=true, only trade when price is already ≥ upper band (shorts) or ≤ lower band (longs).
Exits
Bias auto-exits when |z| falls below exitZ.
You can also take profits at your levels or when the line fades back toward 0 while price mean-reverts to the middle band.
Tuning (what each knob does)
enterZ / exitZ (signal strictness + hysteresis)
Higher enterZ → fewer, cleaner signals (e.g., 1.8–2.2).
exitZ should be lower than enterZ (e.g., 0.6–1.0) to prevent flicker.
lenPrem (context window for z)
Larger (50–100) = steadier baseline, fewer signals.
Smaller (20–30) = more reactive, more signals.
smoothLen (EMA on z)
2–3 = snappier; 5–7 = smoother/laggier but cleaner.
useSigma, bbLen, bbK (price-stretch filter)
On filters chop. Try bbLen=100, bbK=1.0–1.5.
Off if you want more frequent signals or you already gate with your own σ/Keltner.
useHTF, htfTF, htfZmin (trend/confirmation)
Turn on to require higher-TF imbalance agreement (e.g., trading 1H → confirm with 4H htfTF=240, htfZmin≈0.6–1.0).
hotZ (visual intensity)
Lower (2.0–2.5) heats up faster; higher (4.0) is more subtle.
Ready-made presets
Conservative swing (fewer, higher-conviction):
enterZ=2.0, exitZ=1.0, lenPrem=60–80, smoothLen=5, useSigma=true, bbK=1.5, useHTF=true (240/0.8).
Balanced intraday (default feel):
enterZ=1.6–1.8, exitZ=0.8–1.0, lenPrem=50, smoothLen=3–4, useSigma=true, bbK=1.0–1.25, useHTF=false/true depending on trendiness.
Aggressive scalping (more signals):
enterZ=1.2–1.4, exitZ=0.6–0.8, lenPrem=20–30, smoothLen=2–3, useSigma=false, useHTF=false.
Practical tips
Don’t trade the line in isolation. Use it to time trades into your levels: VWAP bands, Monday high/low, prior POC/VAH/VAL, order blocks, etc.
Perp-led reversals often snap—be ready to scale out quickly back to mid-bands.
Venue matters. Keep spot & perp from the same exchange family to avoid cross-venue quirks.
Alerts: enable after you’ve tuned thresholds for your timeframe so you only get high-quality pings.

VWAP Confluência 3x VWAP Confluence 3x — Daily · Weekly · Anchored
Purpose
A pragmatic VWAP suite for execution and risk management. It plots three institutional reference lines: Daily VWAP, Weekly VWAP, and an Anchored VWAP (AVWAP) starting from a user-defined event (news, earnings, session open, swing high/low).
Why it matters
VWAP is the market’s “fair price” weighted by where volume actually traded. Confluence across timeframes and events turns noisy charts into actionable bias and clean levels.
What it does
Daily VWAP — resets each trading day; intraday “fair value.”
Weekly VWAP — resets each week; swing context and larger player defense.
Anchored VWAP — starts at a precise timestamp you set (e.g., news release).
Price source toggle — Typical Price
(
𝐻
+
𝐿
+
𝐶
)
/
3
(H+L+C)/3 or Close.
Visibility switches — enable/disable each line independently.
Anchor marker — labels the first bar of the AVWAP.
Inputs
Show Daily VWAP (on/off)
Show Weekly VWAP (on/off)
Show Anchored VWAP (on/off)
Price Source: Typical (H+L+C)/3 or Close
Anchor Time: timestamp of your event (uses the chart/exchange timezone)
How to anchor to a news event
Find the exact release time as shown in your chart’s timezone.
Open the indicator settings → set Anchor Time to that minute.
The AVWAP begins at that bar and accumulates forward.
Playbook (examples, not signals)
Strong long bias: price above Daily and Weekly VWAP; AVWAP reclaimed after news.
Strong short bias: price below Daily and Weekly; AVWAP reject after news.
Mean-revert zones: price stretches far from the active VWAPs and snaps back; size around VWAP with tight risk.
Targets: opposite VWAP, prior day/week highs/lows, or liquidity pools near AVWAP.
Best used with
Session highs/lows, liquidity sweeps, volume profile, and time-of-day filters.
Notes & limitations
Works best on markets with reliable volume (equities, futures, liquid crypto). FX spot uses synthetic volume—interpret accordingly.
Anchor Time respects the chart’s timezone. Convert news times before setting.
This is an indicator, not a backtestable strategy. No trade advice.
Disclaimer
For educational purposes only. Trading involves risk. Do your own research and manage risk responsibly.

Smart Money SignalsSmart Money Signals – Market Flow & Structure Visualizer
Overview
Smart Money Signals is a precision trading tool designed for traders who want to see market structure and momentum flow in real time. By detecting pivots, momentum imbalances, and dynamic support/resistance levels, the indicator transforms raw price action into a clear visual narrative of where capital is entering and exiting the market.
Instead of lagging averages or cluttered signals, Smart Money Signals highlights the moments that matter most—where bullish and bearish flows are confirmed, where support or resistance breaks, and where momentum zones show the true battleground between buyers and sellers. Its adaptive design makes it equally effective for scalpers seeking sharp entries, swing traders tracking reversals, and longer-term traders looking for confirmation of bias.
How It Works
The engine behind Smart Money Signals relies on swing detection and a configurable sensitivity filter. By monitoring directional momentum across recent bars, the system identifies bullish pivots (where downside exhaustion flips into strength) and bearish pivots (where upward thrust collapses into weakness).
When price confirms a pivot, the indicator draws flow lines to mark the breakout and labels them as either continuation or reversal events, depending on existing market bias. Momentum zones are automatically plotted, highlighting the critical areas where buyers defended price or sellers pressed it lower.
Dynamic support and resistance levels extend forward in time, updating live as price develops. These zones change color when broken, visually signaling whether structure has held or failed. Gradient background shading further emphasizes moments of extreme momentum, such as overbought or oversold surges, so that traders instantly see when market pressure intensifies.
Signals and Market Flows
Smart Money Signals provides visual cues that are both intuitive and actionable:
📈 Bullish Flow Signals appear when price breaks above a confirmed pivot, signaling continuation or reversal into strength.
📉 Bearish Flow Signals appear when price breaks below a confirmed pivot, indicating continuation or reversal into weakness.
Momentum Zones highlight the defended areas between pivots, giving traders a visual map of where structure is strongest.
Dynamic Support & Resistance lines extend across the chart, shifting from defense to failure when broken, ensuring that the most relevant levels are always visible.
Break Signals mark the exact bar where key levels give way, confirming structural violations in real time.
By filtering out noise and focusing on meaningful flow events, the system helps traders avoid overreaction and focus only on high-probability structural shifts.
Strategy Integration
Smart Money Signals is versatile across trading styles:
Trend Continuation : Enter in the direction of flow signals, using dynamic zones as both confirmation and stop-loss placement.
Reversal Trading : Watch for pivots tagged as reversal points, where market bias flips and new structure is created.
Momentum Zone Entries : Use the automatically drawn zones to identify low-risk entries on pullbacks or retests.
Bias Alignment : The integrated dashboard reveals the current market bias—bullish, bearish, or neutral—helping traders stay aligned with the dominant flow.
Stop-losses can be positioned beyond the dynamic zone on the opposite side, while take-profits may be guided by the width of zones or momentum-driven extensions. On higher timeframes, the indicator provides context for macro structure, while lower timeframes allow for tactical entry refinement.
Advanced Techniques
Traders seeking deeper precision can combine Smart Money Signals with volume or order flow tools to validate pivots and zone defenses. Monitoring the sequence of bullish and bearish flows helps identify trend maturity, while analyzing the success rate of pivots in the analytics panel builds a data-driven approach to confidence in signals.
Adjusting swing period and sensitivity allows the indicator to adapt to different market conditions, from volatile crypto pairs to steady forex majors. The flexible visual themes—Cyber, Ocean, Sunset, Matrix—ensure readability across setups, while gradient shading keeps the chart intuitive even under fast-moving conditions.
Why Use Smart Money Signals
Markets are driven by liquidity, momentum, and structure. Smart Money Signals uncovers these forces by translating price action into a clear visual map of flow. It shows:
Where structure was built.
Where it was defended.
Where it was broken.
And where momentum is likely to carry next.
By combining flow detection, dynamic zones, and a live analytics dashboard, the indicator provides traders with a complete framework for reading price action in real time.
Whether you trade crypto, forex, or indices, Smart Money Signals adapts seamlessly to any asset class, giving you clarity, precision, and confidence to execute without second-guessing.

PRO SMC DASHBOARDPRO SMC DASHBOARD - PRO LEVEL
Advanced Supply & Demand / SMC dashboard for scalping and intraday:
Multi-Timeframe Trend: Visualizes trend direction for M1, M5, M15, H1, H4.
HTF Supply/Demand: Shows closest high time frame (HTF) supply/demand zone and distance (in pips).
Smart “Flip” & Liquidity Signals: Flip and Liquidity Sweep arrows/signals are shown only when truly significant:
Near HTF Supply/Demand zone
And confirmed by volume spike or high confluence score
Momentum & Bias: Real-time momentum (RSI M1), H1 bias and fakeout detection.
Confluence Score: Objective score (out of 7) for trade confidence.
Volume Spike, Divergence, BOS: Includes volume spikes, RSI divergence (M1), and Break of Structure (BOS) for both M15 & H1.
Ultra-clean chart: Only valid signals/alerts shown; no spam or visual clutter.
Full dashboard with all signals and context, always visible bottom-right.
Best used for:
Forex, Gold/Silver, US indices, and crypto
Scalping/intraday with fast, clear decisions based on multi-factor SMC logic
Usage:
Add to your chart, monitor the dashboard for valid setups, and trade only when multiple factors align for high-probability entries.
How to Use the PRO SMC DASHBOARD
1. Add the Script to Your Chart:
Apply the indicator to your favorite Forex, Gold, crypto, or indices chart (best on M1, M5, or M15 for entries).
2. Read the Dashboard (Bottom Right):
The dashboard shows real-time information from multiple timeframes and key SMC filters, including:
Trend (M1, M5, M15, H1, H4):
Arrows show up (↑) or down (↓) trend for each timeframe, based on EMA.
Momentum (RSI M1):
Shows “Strong Up,” “Strong Down,” or “Neutral” plus the current RSI value.
RSI (H1):
Higher timeframe momentum confirmation.
ATR State:
Indicates current volatility (High, Normal, Low).
Session:
Detects if the market is in London, NY, or Asia session (based on UTC).
HTF S/D Zone:
Shows the nearest high timeframe Supply or Demand zone, its timeframe (M15, H1, H4), and exact pip distance.
Fakeout (last 3):
Detects recent false breakouts—if there are multiple fakeouts, potential for reversal is higher.
FVG (Fair Value Gap):
Indicates direction and distance to the nearest FVG (Above/Below).
Bias:
“Strong Buy,” “Strong Sell,” or “Neutral”—multi-timeframe, momentum, and volatility filtered.
Inducement:
Alerts for possible “stop hunt” or liquidity grab before reversal.
BOS (Break of Structure):
Recent or live breaks of market structure (for both M15 & H1).
Liquidity Sweep:
Shows if price just swept a key high/low and then reversed (often key reversal point).
Confluence Score (0-7):
Higher score means more factors align—look for 5+ for strong setups.
Volume Spike:
“YES” appears if the current volume is significantly above average—big players are active!
RSI Divergence:
Bullish or bearish divergence on M1—signals early reversal risk.
Momentum Flip:
“UP” or “DN” appears if RSI M1 crosses the 50 line, confirmed by location and other filters.
Chart Signals (Arrows & Markers):
Flip arrows (up/down) and Liquidity markers only appear when price is at/near a key Supply/Demand zone and confirmed by either a volume spike or strong confluence.
No signal spam:
If you see an arrow or LIQ tag, it’s a truly significant moment!
Suggested Trading Workflow:
Scan the Dashboard:
Is the multi-timeframe trend aligned?
Are you near a major Supply or Demand zone?
Is the Confluence Score high (5 or more)?
Check for Signals:
Is there a Flip or LIQ marker near a Supply/Demand zone?
Is volume spiking or a fakeout just occurred?
Look for Reversal or Continuation:
If there’s a Flip at Demand (with high confluence), consider a long setup.
If there’s a LIQ sweep + flip + volume at Supply, consider a short.
Manage Risk:
Don’t chase every signal.
Confirm with your entry criteria and preferred session timing.
Pro Tips:
Highest confidence trades:
When dashboard signals and chart arrows/markers agree, especially with high confluence and volume spike.
Adapt pip distance filter:
Dashboard is tuned for FX and gold; for other assets, adjust pip-size filter if needed.
Use alerts (if enabled):
Set up custom TradingView alerts for “Flip” or “Liquidity” signals for auto-notifications.
Designed to help you make professional, objective decisions—without chart clutter or second-guessing!

Z SMMA | QuantEdgeB📈 Introducing Z-Score SMMA (Z SMMA) by QuantEdgeB
🛠️ Overview
Z SMMA is a momentum-driven oscillator designed to track the standardized deviation of a Smoothed Moving Average (SMMA). By applying Z-score normalization, this tool dynamically adapts to price volatility, enabling traders to detect meaningful directional shifts and trend changes with enhanced clarity.
It serves both as a trend-following and mean-reversion system, identifying opportunities through standardized thresholds while remaining robust across volatile and calm market conditions.
✨ Key Features
🔹 Z-Score Normalization Engine
Applies Z-score to a custom SMMA baseline, allowing traders to compare price action relative to its recent volatility-adjusted mean.
🔹 Dynamic Trend Detection
Generates actionable long/short signals based on customizable Z-thresholds, making it adaptable across different asset classes and timeframes.
🔹 Overbought/Oversold Zones
Highlight reversion and profit-taking zones (default OB: +2 to +4, OS: -2 to -4), great for counter-trend or mean-reversion strategies.
🔹 Visual Reinforcement Tools
Includes candle coloring, gradient fills, and optional ALMA/EMA band overlays to visualize trend regime transitions.
🔍 How It Works
1️⃣ Z-Score SMMA Calculation
The core is a custom Smoothed Moving Average (SMMA) that is normalized by its standard deviation over a lookback period.
Final Formula:
Z = (SMMA - Mean) / StdDev
2️⃣ Signal Generation
• ✅ Long Bias: Z-Score > Long Threshold (default: 0)
• ❌ Short Bias: Z-Score < Short Threshold (default: 0)
3️⃣ Visual Aids
• Candle Color → Shows trend bias
• Band Fills → Highlight trend strength
• Overlays → Optional ALMA/EMA bands for structure analysis
⚙️ Custom Settings
• SMMA Length → Default: 12
• Z-Score Lookback → Default: 30
• Long Threshold → Default: 0
• Short Threshold → Default: 0
• Color Themes → Choose from 6 visual modes
• Extra Plots → Toggle advanced overlays (ALMA, EMA, bands)
• Label Display → Show/hide “𝓛𝓸𝓷𝓰” & “𝓢𝓱𝓸𝓻𝓽” markers
👥 Who Should Use It?
✅ Trend Traders → For early entries with confirmation from Z-score expansion
✅ Quantitative Analysts → Standardized deviation enables comparison across assets
✅ Mean-Reversion Traders → Use OB/OS zones to fade parabolic spikes
✅ Swing & Systematic Traders → Identify momentum shifts with optional ALMA/EMA overlays
📌 Conclusion
Z SMMA offers a smart, adaptive framework for tracking deviation from equilibrium in a quant-friendly format. Whether you're looking to follow trends or catch exhaustion points, Z SMMA provides a clear, standardized view of momentum and price extremes.
🔹 Key Takeaways:
1️⃣ Z-Score standardization ensures dynamic range awareness
2️⃣ SMMA base filters out noise, offering smoother signals
3️⃣ Color-coded visuals support faster reaction and cleaner charts
📌 Disclaimer: Past performance is not indicative of future results. No trading strategy can guarantee success in financial markets.
📌 Strategic Advice: Always backtest, optimize, and align parameters with your trading objectives and risk tolerance before
Naive Bayes Candlestick Pattern Classifier v1.1 BETAAn intermezzo on why i made this script publication..
A : Candlestick Pattern took hours to backtest, why not using Machine Learning techniques?
B : Machine Learning, no that's gonna be really heavy bro!
A : Not really, because we use Naive Bayes.
B : The simplest, yet powerful machine learning algorithm to separate (a.k.a classify) multivariate data.
----------------------------------------------------------------------------------------------------------------------
Hello, everyone!
After deep research in extracting meaningful information from the market, I ended up building this powerful machine learning indicator based on the evolution of Bayesian Statistics. This indicator not only leverages the simplicity of Naive Bayes but also extends its application to candlestick pattern analysis, making it an invaluable tool for traders who are looking to enhance their technical analysis without spending countless hours manually backtesting each pattern on each market!.
What most interesting part is actually after learning all of likely useless methods like fibonacci, supply and demand, volume profile, etc. We always ended up back to basic like support and resistance and candlestick patterns, but with a slight twist on strategy algorithm design and statistical approach. Thus, the only reason why i made this, because i exactly know that you guys will ended up in this position as time goes by.
The essence of this indicator lies in its ability to automate the recognition and statistical evaluation of various candlestick patterns. Traditionally, traders have relied on visual inspection and manual backtesting to determine the effectiveness of patterns like Bullish Engulfing, Bearish Engulfing, Harami variations, Hammer formations, and even more complex multi-candle patterns such as Three White Soldiers, Three Black Crows, Dark Cloud Cover, and Piercing Pattern. However, these conventional methods are both time-consuming and prone to subjective bias.
To address these challenges, I employed Naive Bayes—a probabilistic classifier that, despite its simplicity, offers robust performance in various domains. Naive Bayes assumes that each feature is independent of the others given the class label, which, although a strong assumption, works remarkably well in practice, especially when the dataset is large like market data and the feature space is high-dimensional. In our case, each candlestick pattern acts as a feature that can be statistically evaluated based on its historical performance. The indicator calculates a probability that a given pattern will lead to a price reversal, by comparing the pattern’s close price to the highest or lowest price achieved in a lookahead window.
One of the standout features of this script is its flexibility. Each candlestick pattern is not only coded into the system but also comes with individual toggles to enable or disable them based on your trading strategy. This means you can choose to focus on single-candle patterns like Bullish Engulfing or more complex multi-candle formations such as Three White Soldiers, without modifying the core code. The built-in customization options allow you to adjust colors and labels for each pattern, giving you the freedom to tailor the visual output to your preference. This level of customization ensures that the indicator integrates seamlessly into your existing TradingView setup.
Moreover, the indicator isn’t just about pattern recognition—it also incorporates outcome-based learning. Every time a pattern is detected, it looks ahead a predefined number of bars to evaluate if the expected reversal actually materialized. This outcome is then stored in arrays, and over time, the script dynamically calculates the probability of success for each pattern. These probabilities are presented in a real-time updating table on your chart, which shows not only the percentage probability but also the count of historical occurrences. With this information at your fingertips, you can quickly gauge the reliability of each pattern in your chosen market and timeframe.
Another significant advantage of this approach is its speed and efficiency. While more complex machine learning models like neural networks might require heavy computational resources and longer training times, the Naive Bayes classifier in this script is lightweight, instantaneous and can be updated on the fly with each new bar. This real-time capability is essential for modern traders who need to make quick decisions in fast-paced markets.
Furthermore, by automating the process of backtesting, the indicator frees up your time to focus on other aspects of trading strategy development. Instead of manually analyzing hundreds or even thousands of candles, you can rely on the statistical power of Naive Bayes to provide you with insights on which patterns are most likely to result in profitable moves. This not only enhances your efficiency but also helps to eliminate the cognitive biases that often plague manual analysis.
In summary, this indicator represents a fusion of traditional candlestick analysis with modern machine learning techniques. It harnesses the simplicity and effectiveness of Naive Bayes to deliver a dynamic, real-time evaluation of various candlestick patterns. Whether you are a seasoned trader looking to refine your technical analysis or a beginner eager to understand market dynamics, this tool offers a powerful, customizable, and efficient solution. Welcome to a new era where advanced statistical methods meet practical trading insights—happy trading and may your patterns always be in your favor!
Note : On this current released beta version, you must manually adjust reversal percentage move based on each market. Further updates may include automated best range detection and probability.

Fibonacci ATR Fusion - Strategy [presentTrading]Open-script again! This time is also an ATR-related strategy. Enjoy! :)
If you have any questions, let me know, and I'll help make this as effective as possible.
█ Introduction and How It Is Different
The Fibonacci ATR Fusion Strategy is an advanced trading approach that uniquely integrates Fibonacci-based weighted averages with the Average True Range (ATR) to identify and capitalize on significant market trends.
Unlike traditional strategies that rely on single indicators or static parameters, this method combines multiple timeframes and dynamic volatility measurements to enhance precision and adaptability. Additionally, it features a 4-step Take Profit (TP) mechanism, allowing for systematic profit-taking at various levels, which optimizes both risk management and return potential in long and short market positions.
BTCUSD 6hr Performance
█ Strategy, How It Works: Detailed Explanation
The Fibonacci ATR Fusion Strategy utilizes a combination of technical indicators and weighted averages to determine optimal entry and exit points. Below is a breakdown of its key components and operational logic.
🔶 1. Enhanced True Range Calculation
The strategy begins by calculating the True Range (TR) to measure market volatility accurately.
TR = max(High - Low, abs(High - Previous Close), abs(Low - Previous Close))
High and Low: Highest and lowest prices of the current trading period.
Previous Close: Closing price of the preceding trading period.
max: Selects the largest value among the three calculations to account for gaps and limit movements.
🔶 2. Buying Pressure (BP) Calculation
Buying Pressure (BP) quantifies the extent to which buyers are driving the price upwards within a period.
BP = Close - True Low
Close: Current period's closing price.
True Low: The lower boundary determined in the True Range calculation.
🔶 3. Ratio Calculation for Different Periods
To assess the strength of buying pressure relative to volatility, the strategy calculates a ratio over various Fibonacci-based timeframes.
Ratio = 100 * (Sum of BP over n periods) / (Sum of TR over n periods)
n: Length of the period (e.g., 8, 13, 21, 34, 55).
Sum of BP: Cumulative Buying Pressure over n periods.
Sum of TR: Cumulative True Range over n periods.
This ratio normalizes buying pressure, making it comparable across different timeframes.
🔶 4. Weighted Average Calculation
The strategy employs a weighted average of ratios from multiple Fibonacci-based periods to smooth out signals and enhance trend detection.
Weighted Avg = (w1 * Ratio_p1 + w2 * Ratio_p2 + w3 * Ratio_p3 + w4 * Ratio_p4 + Ratio_p5) / (w1 + w2 + w3 + w4 + 1)
w1, w2, w3, w4: Weights assigned to each ratio period.
Ratio_p1 to Ratio_p5: Ratios calculated for periods p1 to p5 (e.g., 8, 13, 21, 34, 55).
This weighted approach emphasizes shorter periods more heavily, capturing recent market dynamics while still considering longer-term trends.
🔶 5. Simple Moving Average (SMA) of Weighted Average
To further smooth the weighted average and reduce noise, a Simple Moving Average (SMA) is applied.
Weighted Avg SMA = SMA(Weighted Avg, m)
- m: SMA period (e.g., 3).
This smoothed line serves as the primary signal generator for trade entries and exits.
🔶 6. Trading Condition Thresholds
The strategy defines specific threshold values to determine optimal entry and exit points based on crossovers and crossunders of the SMA.
Long Condition = Crossover(Weighted Avg SMA, Long Entry Threshold)
Short Condition = Crossunder(Weighted Avg SMA, Short Entry Threshold)
Long Exit = Crossunder(Weighted Avg SMA, Long Exit Threshold)
Short Exit = Crossover(Weighted Avg SMA, Short Exit Threshold)
Long Entry Threshold (T_LE): Level at which a long position is triggered.
Short Entry Threshold (T_SE): Level at which a short position is triggered.
Long Exit Threshold (T_LX): Level at which a long position is exited.
Short Exit Threshold (T_SX): Level at which a short position is exited.
These conditions ensure that trades are only executed when clear trends are identified, enhancing the strategy's reliability.
Previous local performance
🔶 7. ATR-Based Take Profit Mechanism
When enabled, the strategy employs a 4-step Take Profit system to systematically secure profits as the trade moves in the desired direction.
TP Price_1 Long = Entry Price + (TP1ATR * ATR Value)
TP Price_2 Long = Entry Price + (TP2ATR * ATR Value)
TP Price_3 Long = Entry Price + (TP3ATR * ATR Value)
TP Price_1 Short = Entry Price - (TP1ATR * ATR Value)
TP Price_2 Short = Entry Price - (TP2ATR * ATR Value)
TP Price_3 Short = Entry Price - (TP3ATR * ATR Value)
- ATR Value: Calculated using ATR over a specified period (e.g., 14).
- TPxATR: User-defined multipliers for each take profit level.
- TPx_percent: Percentage of the position to exit at each TP level.
This multi-tiered exit strategy allows for partial position closures, optimizing profit capture while maintaining exposure to potential further gains.
█ Trade Direction
The Fibonacci ATR Fusion Strategy is designed to operate in both long and short market conditions, providing flexibility to traders in varying market environments.
Long Trades: Initiated when the SMA of the weighted average crosses above the Long Entry Threshold (T_LE), indicating strong upward momentum.
Short Trades: Initiated when the SMA of the weighted average crosses below the Short Entry Threshold (T_SE), signaling robust downward momentum.
Additionally, the strategy can be configured to trade exclusively in one direction—Long, Short, or Both—based on the trader’s preference and market analysis.
█ Usage
Implementing the Fibonacci ATR Fusion Strategy involves several steps to ensure it aligns with your trading objectives and market conditions.
1. Configure Strategy Parameters:
- Trading Direction: Choose between Long, Short, or Both based on your market outlook.
- Trading Condition Thresholds: Set the Long Entry, Short Entry, Long Exit, and Short Exit thresholds to define when to enter and exit trades.
2. Set Take Profit Levels (if enabled):
- ATR Multipliers: Define how many ATRs away from the entry price each take profit level is set.
- Take Profit Percentages: Allocate what percentage of the position to close at each TP level.
3. Apply to Desired Chart:
- Add the strategy to the chart of the asset you wish to trade.
- Observe the plotted Fibonacci ATR and SMA Fibonacci ATR indicators for visual confirmation.
4. Monitor and Adjust:
- Regularly review the strategy’s performance through backtesting.
- Adjust the input parameters based on historical performance and changing market dynamics.
5. Risk Management:
- Ensure that the sum of take profit percentages does not exceed 100% to avoid over-closing positions.
- Utilize the ATR-based TP levels to adapt to varying market volatilities, maintaining a balanced risk-reward ratio.
█ Default Settings
Understanding the default settings is crucial for optimizing the Fibonacci ATR Fusion Strategy's performance. Here's a precise and simple overview of the key parameters and their effects:
🔶 Key Parameters and Their Effects
1. Trading Direction (`tradingDirection`)
- Default: Both
- Effect: Determines whether the strategy takes both long and short positions or restricts to one direction. Selecting Both allows maximum flexibility, while Long or Short can be used for directional bias.
2. Trading Condition Thresholds
Long Entry (long_entry_threshold = 58.0): Higher values reduce false positives but may miss trades.
Short Entry (short_entry_threshold = 42.0): Lower values capture early short trends but may increase false signals.
Long Exit (long_exit_threshold = 42.0): Exits long positions early, securing profits but potentially cutting trends short.
Short Exit (short_exit_threshold = 58.0): Delays short exits to capture favorable movements, avoiding premature exits.
3. Take Profit Configuration (`useTakeProfit` = false)
- Effect: When enabled, the strategy employs a 4-step TP mechanism to secure profits at multiple levels. By default, it is disabled to allow users to opt-in based on their trading style.
4. ATR-Based Take Profit Multipliers
TP1 (tp1ATR = 3.0): Sets the first TP at 3 ATRs for initial profit capture.
TP2 (tp2ATR = 8.0): Targets larger trends, though less likely to be reached.
TP3 (tp3ATR = 14.0): Optimizes for extreme price moves, seldom triggered.
5. Take Profit Percentages
TP Level 1 (tp1_percent = 12%): Secures 12% at the first TP.
TP Level 2 (tp2_percent = 12%): Exits another 12% at the second TP.
TP Level 3 (tp3_percent = 12%): Closes an additional 12% at the third TP.
6. Weighted Average Parameters
Ratio Periods: Fibonacci-based intervals (8, 13, 21, 34, 55) balance responsiveness.
Weights: Emphasizes recent data for timely responses to market trends.
SMA Period (weighted_avg_sma_period = 3): Smoothens data with minimal lag, balancing noise reduction and responsiveness.
7. ATR Period (`atrPeriod` = 14)
Effect: Sets the ATR calculation length, impacting TP sensitivity to volatility.
🔶 Impact on Performance
- Sensitivity and Responsiveness:
- Shorter Ratio Periods and Higher Weights: Make the weighted average more responsive to recent price changes, allowing quicker trade entries and exits but increasing the likelihood of false signals.
- Longer Ratio Periods and Lower Weights: Provide smoother signals with fewer false positives but may delay trade entries, potentially missing out on significant price moves.
- Profit Taking:
- ATR Multipliers: Higher multipliers set take profit levels further away, targeting larger price movements but reducing the probability of reaching these levels.
- Fixed Percentages: Allocating equal percentages at each TP level ensures consistent profit realization and risk management, preventing overexposure.
- Trade Direction Control:
- Selecting Specific Directions: Restricting trades to Long or Short can align the strategy with market trends or personal biases, potentially enhancing performance in trending markets.
- Risk Management:
- Take Profit Percentages: Dividing the position into smaller percentages at multiple TP levels helps lock in profits progressively, reducing risk and allowing the remaining position to ride further trends.
- Market Adaptability:
- Weighted Averages and ATR: By combining multiple timeframes and adjusting to volatility, the strategy adapts to different market conditions, maintaining effectiveness across various asset classes and timeframes.
---
If you want to know more about ATR, can also check "SuperATR 7-Step Profit".
Enjoy trading.

Template Trailing Strategy (Backtester)💭 Overview
+ Title: Template Trailing Strategy (Backtester)
+ Author: Iason Nikolas (jason5480)
+ License: CC BY-NC-SA 4.0
💢 What is the "Template Trailing Strategy (Backtester)" ❓
The "Template Trailing Strategy (Backtester)" (TTS) is a back-tester orchestration framework. It supercharges the implementation-test-evaluation lifecycle of new trading strategies, by making it possible to plug in your own trading idea.
While TTS offers a vast number of configuration settings, it primarily allows the trader to:
Test and evaluate your own trading logic that is described in terms of entry, exit, and cancellation conditions.
Define the entry and exit order types as well as their target prices when the limit, stop, or stop-limit order types are used.
Utilize a variety of options regarding the placement of the stop-loss and take-profit target(s) prices and support for well-known techniques like moving to breakeven and trailing.
Provide well-known quantity calculation methods to properly handle risk management and easily evaluate trading strategies and compare them.
Alert on each trading event or any related change through a robust and fully customizable messaging system.
All of the above makes TTS a practical toolkit: once you learn it, many repetitive tasks that strategy authors usually re-implement are eliminated. Using TradingView’s built-in backtesting engine makes testing and comparing ideas straightforward.
By utilizing the TTS one can easily swap "trading logic" by testing, evaluating, and comparing each trading idea and/or individual component of a strategy.
Finally, TTS, through its per-event alert management (and debugging) system, provides an automated solution that supports live trading with brokers via webhooks.
NOTE: The "Template Trailing Strategy (Backtester)" does not dictate how you can combine different indicator types. Thus, it should not be confused as a "Trading System", because it gives its user full flexibility on that end (for better or worse).
💢 What is a "Signal Indicator" ❓
"Signal Indicator" (SI) is an indicator that can output a "signal" that follows a specific convention so that the "Template Trailing Strategy (Backtester)" can "understand" and execute the orders accordingly. The SI realizes the core trading logic signaling to the TTS when to enter, exit, or cancel an order. A SI instructs the TTS "when" to enter or exit, and the TTS determines "how" to enter and exit the position once the Signal Indicator generates a signal.
A very simple example of a Signal Indicator might be a 200-day Simple Moving Average Signal. When the price of the security closes above the 200-day SMA, a SI would provide TTS with a "long entry signal". Once TTS receives the "long entry signal", the TTS will open a long position and send an alert or automated trade message via webhook to a broker, based on the Entry settings defined in TTS. If the TTS Entry settings specify a "Market" order type, then the open long position will be executed by TTS immediately. But if the TTS Entry settings specify a "Stop" order type with a 1% Stop Distance, then when the price of the security rises by 1% after the "long entry signal" occurs, the TTS will open a long position and the Long Entry alert or webhook to the broker will be sent.
🤔 How to Guide
💢 How to connect a "signal" from a "Signal Indicator" ❓
The "Template Trailing Strategy (Backtester)" was designed to receive external signals from a "Signal Indicator". In this way, a "new trading idea" can be developed, configured, and evaluated separately from the TTS. Similarly, the SI can be held constant, and the trading mechanics can change in the TTS settings and back-tested to answer questions such as, "Am I better with a different stop loss placement method, what if I used a limit order instead of a stop order to enter, what if I used 25% margin instead of trading spot market?"
To make that possible by connecting an external signal indicator to TTS, you should:
Add both your SI (e.g. "Two MA Signal Indicator" , "Click Signal Indicator" , "Signal Adapter" , "Signal Composer" ) and the TTS script to the same chart.
Open the script's Settings / Inputs dialog for the TTS.
In the 🛠️ STRATEGY group set 𝐃𝐞𝐚𝐥 𝐂𝐨𝐧𝐝𝐢𝐨𝐧𝐬 𝐌𝐨𝐝𝐞 to 🔨External (this makes TTS listen to an external signal source).
Still inside 🛠️ STRATEGY locate the 🔌𝐒𝐢𝐠𝐧𝐚𝐥 🛈 input and choose the plotted output of your SI. The option should look like: "<SI short title>:🔌Signal to TTS" .
Verbose troubleshooting & tips
If the SI does not appear in the 🔌Signal 🛈 selector, confirm both scripts are added to the same chart and the SI exposes a plotted series (title often "🔌Signal to TTS").
When using multiple SIs, pick the SI instance that actually outputs the "🔌Signal to TTS" plotted series.
Validate on the chart: when your SI changes state, the plotted "🔌Signal" series in the TTS (visible in the data window) should change accordingly.
The TTS accepts only signals that follow the tts_convention DealConditions structure. Do not attempt to feed arbitrary scalar series without using conv.getDealConditions / conv.DealConditions.
Make sure your SI composes a DealConditions value following the TTS convention (startLong, endLong, startShort, endShort — optional cancel fields). See the template below.
If the plot is present but TTS does not react, ensure the SI plot is non-repainting (or accept realtime/backtest limitations). Test on historical bars first.
Create alerts on the strategy (see the Alerts section). Use the {{strategy.order.alert_message}} placeholder in the Create Alert dialog to forward TTS messages.
💢 How to create a custom trading logic ❓
The "Template Trailing Strategy (Backtester)" provides two ways to plug in your custom trading logic. Both of them have their advantages and disadvantages.
✍️ Develop your own Customized "Signal Indicator" 💥
The first approach is meant to be used for relatively more complex trading logic. The advantages of this approach are the full control and customization you have over the trading logic and the relatively simple configuration setup by having two scripts only. The downsides are that you have to have some experience with pinescript or you are willing to learn and experiment. You should also know the exact formula for every indicator you will use since you have to write it by yourself. Copy-pasting from existing open-source indicators will get you started quite fast though.
The idea here is either to create a new indicator script from scratch or to copy an existing non-signal indicator and make it a "Signal Indicator". To create a new script, press the "Pine Editor" button below the chart to open the "Pine Editor" and then press the "Open" button to open the drop-down menu with the templates. Select the "New Indicator" option. Add it to your chart to copy an existing indicator and press the source code {} button. Its source code will be shown in the "Pine Editor" with a warning on top stating that this is a read-only script. Press the "create a working copy". Now you can give a descriptive title and a short title to your script, and you can work on (or copy-paste) the (other) indicators of your interest. Once you have the information needed to decide, define a DealConditions object and plot it like this:
import jason5480/tts_convention/ as conv
// Calculate the start, end, cancel start, cancel end conditions
dealConditions = conv.DealConditions.new(
startLongDeal = ,
startShortDeal = ,
endLongDeal = ,
endShortDeal = ,
cnlStartLongDeal = ,
cnlStartShortDeal = ,
cnlEndLongDeal = ,
cnlEndShortDeal = )
// Use this signal in scripts like "Template Trailing Strategy (Backtester)" and "Signal Composer" that can utilize its value
// Emit the current signal value according to the TTS framework convention
plot(series = conv.getSignal(dealConditions), title = '🔌Signal to TTS', color = #808000, editable = false, display = display.data_window + display.status_line, precision = 0)
You should import the latest version of the tts_convention library and write your deal conditions appropriately based on your trading logic and put them in the code section shown above by replacing the "…" part after "=". You can omit the conditions that are not relevant to your logic. For example, if you use only market orders for entering and exiting your positions the cnlStartLongDeal, cnlStartShortDeal, cnlEndLongDeal, and cnlEndShortDeal are irrelevant to your case and can be safely omitted from the DealConditions object. After successfully compiling your new custom SI script add it to the same chart with the TTS by pressing the "Add to chart" button. If all goes well, you will be able to connect your "signal" to the TTS as described in the "How to connect a "signal" from a "Signal Indicator"?" guide.
🧩 Adapt and Combine existing non-signal indicators 💥
The second approach is meant to be used for relatively simple trading logic. The advantages of this approach are the lack of pine script and coding experience needed and the fact that it can be used with closed-source indicators as long as the decision-making part is displayed as a line in the chart. The drawback is that you have to have a subscription that supports the "indicator on indicator" feature so you can connect the output of one indicator as an input to another indicator. Please check if your plan supports that feature here
To plug in your own logic that way you have to add your indicator(s) of preference in the chart and then add the "Signal Adapter" script in the same chart as well. This script is a "Signal Indicator" that can be used as a proxy to define your custom logic in the CONDITIONS group of the "Settings/Inputs" tab after defining your inputs from your preferred indicators in the VARIABLES group. Then a "signal" will be produced, if your logic is simple enough it can be directly connected to the TTS that is also added to the same chart for execution. Check the "How to connect a "signal" from a "Signal Indicator"?" in the "🤔 How to Guide" for more information.
If your logic is slightly more complicated, you can add a second "Signal Adapter" in your chart. Then you should add the "Signal Composer" in the same chart, go to the SIGNALS group of the "Settings/Inputs" tab, and connect the "signals" from the "Signal Adapters". "Signal Composer" is also a SI so its composed "signal" can be connected to the TTS the same way it is described in the "How to connect a "signal" from a "Signal Indicator"?" guide.
At this point, due to the composability of the framework, you can add an arbitrary number (bounded by your subscription of course) of "Signal Adapters" and "Signal Composers" before connecting the final "signal" to the TTS.
💢 How to set up ⏰Alerts ❓
The "Template Trailing Strategy (Backtester)" provides a fully customizable per-event alert mechanism. This means that you may have an entirely different message for entering and exiting into a position, hitting a stop-loss or a take-profit target, changing trailing targets, etc. There are no restrictions, and this gives you great flexibility.
First enable the events you want under the "🔔 ALERT MESSAGES" module. Each enabled event exposes a text area where you can craft the message using placeholders that TTS replaces with actual values when the event occurs.
The placeholder categories (exact names used by the script) are:
Chart & instrument:
{{ticker}}
{{base_currency}}
{{quote_currency}}
Entry / exit / stop / TP prices & offsets:
{{entry_price}}
{{exit_price}}
{{stop_loss_price}}
{{take_profit_price_1}} ... {{take_profit_price_5}}
{{entry+_price}}, {{entry-_price}}, {{exit+_price}}, {{exit-_price}} — Optional offset helpers (computed using "Offset Ticks")
Quantities, percents & derived quantities:
{{entry_base_quantity}} — base units at entry (e.g. BTC)
{{entry_quote_quantity}} — quote amount at entry (e.g. USD)
{{risk_perc}} — % of capital risked for that entry (multiplied by 100 when "Percentage Range " is enabled)
{{remaining_quantity_perc}} — % of the initial position remaining at close/SL
{{remaining_base_quantity}} — remaining base units at close/SL
{{take_profit_quantity_perc_1}} ... {{take_profit_quantity_perc_5}} — % sold/bought at each TP
{{take_profit_base_quantity_1}} ... {{take_profit_base_quantity_5}} — base units closed at each TP
❗ Important: the per-event alert text is injected into the Create Alert dialog using TradingView's strategy placeholder:
{{strategy.order.alert_message}}
During the creation of a strategy alert, make sure the placeholder {{strategy.order.alert_message}} exists in the "Message" box. TradingView will substitute the per-event text you configured and enabled in TTS Settings/Inputs before sending it via webhook/notification.
Tip: For webhook/broker execution, set the proper "Condition" in the Create Alert dialog (for changing-entry/exit/SL notifications use "Order fills and alert() function calls" or "alert() function calls only" as appropriate).
💢 How to execute my orders in a broker ❓
To execute your orders in a broker that supports webhook integration, you should enable the appropriate alerts in the "Template Trailing Strategy (Backtester)" first (see the "How to set up Alerts?" guide above). Then you should go to the "Create Alert/Notifications" tab check the "Webhook URL" and paste the URL provided by your broker. You have to read the documentation of your broker for more information on what messages are expected.
Keep in mind that some brokers have deep integration with TradingView so a per-event alert approach might be overkill.
📑 Definitions
This section tries to give some definitions in terms that appear in the "Settings/Inputs" tab of the "Template Trailing Strategy (Backtester)"
💢 What is Trailing ❓
Trailing is a technique where a price target follows another "barrier" price (usually high or low) by trying to keep a maximum distance from the "barrier" when it moves in only one direction (up or down). When the "barrier" moves in the other direction the price target will not change. There are as many types of trailing as price targets, which means that there are entry trailing, exit trailing, stop-loss trailing, and take-profit trailing techniques.
💢 What is a Moonbag ❓
A Moonbag in a trade is the quantity of the position that is reserved and will not be exited even if all take-profit targets defined in the strategy are hit, the quantity will be exited only if the stop-loss is hit or a close signal is received. This makes the stop-loss trailing technique in a trend-following strategy a good candidate to take advantage of a Moonbag.
💢 What is Distance ❓
Distance is the difference between two prices.
💢 What is Bias ❓
Bias is a psychological phenomenon where you make decisions based on market sentiment. For example, when you want to enter a long position you have a long bias, and when you want to exit from the long position you have a short bias. It is the other way around for the short position.
💢 What is the Bias Distance of a price target ❓
The Bias Distance of a price target is the distance that the target will deviate from its initial price. The direction of this deviation depends on the bias of the market. For example, suppose you are in a long position, and you set a take-profit target to the local highest high. In that case, adding a bias distance of five ticks will place your take-profit target 5 ticks below this local highest high because you have a short bias when exiting a long position. When the bias is long the bias distance will be added resulting in a higher target price and when you have a short bias the bias distance will be subtracted.
⚙️ Settings
In the "Settings/Inputs" tab of the "Template Trailing Strategy (Backtester)", you can find all the customizable settings that are provided by the framework. The variety of those settings is vast; hence we will only scratch the surface here. However, for every setting, there is an information icon 🛈 where you can learn more if you mouse over it. The "Settings/Inputs" tab is divided into ten main groups. Each one of them is responsible for one module of the framework. Every setting is part of a group that is named after the module it represents. So, to spot the module of a setting find the title that appears above it comes with an emoji and uppercase letters. Some settings might have the same name but belong to different modules e.g. "Tgt Dist Mtd" (Target Distance Method). Some settings are indented, which means that they are closely related to the non-indented setting above. Usually, indented settings provide further configuration for one or more options of the non-indented setting above. The groups that correspond to each module of the framework are the following:
🗺️ Quick Module Cross-Reference (use emojis to jump to setting groups)
📆 FILTERS — session, date & weekday filters
🛠️ STRATEGY — internal vs external deal-conditions; pick the signal source
🔧 STRATEGY – INTERNAL — built-in Two MA logic for demonstration purposes
🎢 VOLATILITY — ATR / StDev update modes
🔷 ENTRY — entry order types & trailing
🎯 TAKE PROFIT — multi-step TP and trailing rules
🛑 STOP LOSS — stop placement, move-to-breakeven, trailing
🟪 EXIT — exit order types & cancel logic
💰 QUANTITY/RISK MANAGEMENT — position sizing, moonbag, limits
📊 ANALYTICS — stats, streaks, seasonal tables
🔔 ALERT MESSAGES — per-event alert templates & placeholders
😲 Caveats
💢 Does "Template Trailing Strategy (Backtester)" have repainting behavior? ❓
The answer is that the "Template Trailing Strategy (Backtester)" does not repaint as long as the "Signal Indicator" that is connected also does not repaint. If you developed your own SI make sure that you understand and know how to prevent this behavior. The publication by @PineCoders here will give you a good idea on how to avoid most of the repainting cases.
⚠️ There is an exception though, when the "Enable Trail⚠️💹" checkbox is checked, the Take Profit trailing feature is enabled, and a tick-based approach is used, meaning that after a while, when the TradingView discards all the real-time data, assumptions will be made by the backtesting engine that will cause a form of repainting. To avoid making false assumptions please disable this feature in the early stages and evaluate its usefulness in your strategy later on, after first confirming the success of the logic without this feature. In this case, consider turning on the bar magnifier feature. This way you will get more accurate backtest results when the Take Profit trailing feature is enabled.
💢 Can "Template Trailing Strategy (Backtester)" satisfy all my trading strategies ❓
While this framework can satisfy quite a large number of trading strategies there are cases where it cannot do so. For example, if you have a custom logic for your stop-loss or take-profit placement, or if you want to dollar cost average, then it might be better to start a new strategy script from scratch.
⚠️ It is not recommended to copy the official TTS code and start developing unless you are a Pine wizard! Even in that case, there is a stiff learning curve that might not be worth your time. Last, you must consider that I do not offer support for customized versions of the TTS script and if something goes wrong in the process you are all alone.
💝 Support & Feedback
For feedback, bug reports, or feature requests, contact me via TradingView PM or use the script comments.
Note: The author's personal links and contact are available on the TradingView profile.
🤗 Thanks
Special thanks to the welcoming community members, who regularly gave feedback all those years and helped me to shape the framework as it is today! Thanks everyone who contributed by either filing a "defect report" or asking questions that helped me to understand what improvements were necessary to help traders.
Enjoy!
Jason

MTF Technical Ratings [Anan]█ OVERVIEW
This indicator is a modified version of "Technical Ratings" v5.0 available in the public library to provide a quick overview of Technical Ratings in 6 optional timeframes.
█ FEATURES
- Multi-timeframe Table.
- Display Technical Ratings for "MAs" with a percentage.
- Display Technical Ratings for "Oscillators" with a percentage.
- Display Technical Ratings for "All" with a percentage.
- Full control of displaying any row(MAs / Oscillators / All) or any column(Multi-timeframe)
- Full control of Table position and size.
- Full control of displaying any row or column.
ORIGINAL DESCRIPTION ABOUT TECHNICAL RATING v1.0
█ OVERVIEW
This indicator calculates TradingView's well-known "Strong Buy", "Buy", "Neutral", "Sell" or "Strong Sell" states using the aggregate biases of 26 different technical indicators.
█ CALCULATIONS
The indicator calculates the aggregate value of two groups of indicators: moving averages and oscillators.
The "MAs" group is comprised of 15 different components:
• Six Simple Moving Averages of periods 10, 20, 30, 50, 100 and 200
• Six Exponential Moving Averages of the same periods
• A Hull Moving Average of period 9
• A Volume-weighed Moving Average of period 20
• Ichimoku
The "Oscillators" group includes 11 components:
• RSI
• Stochastic
• CCI
• ADX
• Awesome Oscillator
• Momentum
• MACD
• Stochastic RSI
• Wiliams %R
• Bull Bear Power
• Ultimate Oscillator
The state of each group's components is evaluated to a +1/0/-1 value corresponding to its bull/neutral/bear bias. The resulting value for each of the two groups are then averaged to produce the overall value for the indicator, which oscillates between +1 and -1. The complete conditions used in the calculations are documented in the Help Center.

【Super Bollinger】The market consists of three phases: an uptrend phase, a downtrend phase, and a range-bound phase.Furthermore, if we include a trend phase and a correction phase, the market has five phases. In other words, the market is classified into the “five phases” as below:
1) Uptrend market (trend phase, upward bias)
2) Downtrend market (trend phase, downward bias)
3) Upward correction phase (correction phase, upward bias)
4) Downward correction phase (correction phase, downward bias)
5) Range-bound phase, sideways (correction phase, basically not biased)
For your judgment of the above market trends, Super Bollinger is extremely useful and effective. And Super Bollinger has advantage in judging market price level.
そもそも、相場は、5つの局面に分けることができます。
すなわち、
1)上昇トレンド局面(上昇バイアス)
2)下降トレンド局面(下降バイアス)
3)調整の反騰局面(上昇バイアス)
4)調整の反落局面(下降バイアス)
5)レンジ局面(バイアスなし)
そして、スーパーボリンジャー、これら5つの局面の判断を下す際にきわめて有効なツールです。また、とりわけ、価格分析に優れたチャートです。
With regard to Chikou Span,this span gives very useful information about (1) the direction of the market (being in an upward bias by buying pressure or in a downward bias by selling pressure) , (2) the timing of buying on the dip or selling on the rally, (3) the market’s temporal rhythm etc..
遅行スパンに関しては、基本的に、
(1)相場の方向性(買い優勢か売り優勢か)
(2)押し目買いや戻り売りのタイミング
(3)相場の時間的リズム
等々に関して実に有効な情報を与えてくれます。
High-Probability Scalper (Market Open)Market open is where volatility is real, spreads are tight, and momentum shows itself early. This scalping strategy is built specifically to operate during that window, filtering out low-quality signals that usually appear later in the session.
Instead of trading all day, the logic is restricted to the first 90 minutes after market open, where continuation moves and fast pullbacks are more reliable.
What This Strategy Does
This script looks for short-term momentum alignment using:
Fast vs slow EMA structure
RSI confirmation to avoid chasing extremes
ATR-based risk control
Session-based filtering to trade only when volume matters
It’s designed for intraday scalping, not swing trading.
Core Trading Logic
1. Market Open Filter
Trades are allowed only between 09:30 – 11:00 exchange time.
This avoids low-liquidity chop and focuses on the period where most breakouts and reversals form.
2. Trend Confirmation
Bullish bias: 9 EMA crosses above 21 EMA
Bearish bias: 9 EMA crosses below 21 EMA
This keeps trades aligned with short-term direction instead of random entries.
3. Momentum Check (RSI)
RSI is used as a quality filter, not as an overbought/oversold signal.
Long trades only when RSI is strong but not extended
Short trades only when RSI shows weakness without exhaustion
This removes late entries and reduces whipsaws.
Entries & Exits
Entries
Executed only on confirmed candles
No intrabar repainting
One position at a time
Risk Management
Stop-loss based on ATR
Take-profit calculated using a fixed risk–reward ratio
Same structure for both long and short trades
This keeps risk consistent across different symbols and volatility levels.
Why This Strategy Works Better at Market Open
Volume is highest
False breakouts are fewer
EMA crosses have follow-through
RSI behaves more cleanly
By not trading all day, the strategy avoids most of the noise that kills scalpers.
Best Use Cases
Index futures
High-liquidity stocks
Major crypto pairs during active sessions
1m to 5m timeframes
What This Strategy Is NOT
Not a martingale
Not grid-based
Not designed for ranging markets
Not a “set and forget” system
It’s a controlled scalping template meant for disciplined execution.
How to Use It Properly
Test on multiple symbols
Adjust ATR length for volatility
Tune RSI ranges per market
Always forward-test before live alerts
Final Note
This strategy focuses on structure, timing, and risk, not indicator stacking.
If you trade the open, this gives you a clear framework instead of emotional entries.
If you want:
Alerts
Session customization
News filters
Partial exits
You can extend this logic without breaking the core system.

Crypto Flow Index (CFI) - RS vs BTC/ETH ---
Crypto Flow Index, CFI
Crypto Flow Index, CFI, measures relative strength between an asset and Bitcoin or Ethereum.
You use CFI to judge whether capital favors your asset or the benchmark.
CFI does not give entry or exit signals.
You use CFI as a bias and context tool.
---
What CFI measures
Relative strength money flow on the BASE/BTC or BASE/ETH pair.
Volume weighted pressure, not price alone.
Momentum blended into flow to smooth rotations.
Optional USD trend filter using fast and slow EMAs.
---
How to read CFI
Above 50 means relative strength favors the asset.
Below 50 means relative strength favors BTC or ETH.
Rising CFI shows strengthening relative demand.
Falling CFI shows weakening relative demand.
---
Histogram
Green bars show positive relative flow.
Red bars show negative relative flow.
Larger bars signal stronger pressure.
---
Bias ribbon
Green ribbon shows bullish relative bias.
Red ribbon shows bearish relative bias.
Gray ribbon shows transition or balance.
---
How to use CFI
Favor long trades when CFI stays above 50.
Avoid longs when price rises but CFI falls.
Spot rotations before price reacts.
Combine with structure, entries, and risk rules.
---
Important limits
CFI compares assets only to BTC or ETH.
CFI does not represent the entire crypto market.
USD price and relative strength often diverge.
---
Core question CFI answers
Is your asset gaining or losing strength versus Bitcoin or Ethereum.
---

MSO - Market Stress Oscillator [WavesUnchained]MSO - Market Stress Oscillator
Bidirectional stress oscillator built on WVF + Z-score, with JMA/ADX filters, regime bias, and validated follow-through. Designed to expose downside panic vs upside euphoria and measure whether the market accepts or rejects each stress event.
Quick Setup
- Stress Color Mode : Intuitive (Downside=green, Upside=red) or Technical (classic colors).
CORE CONCEPT
- Downside stress : price flushes below WVF baseline (panic)
- Upside stress : price stretches above WVF baseline (euphoria)
- Stress is normalized via Z-score for cross-asset/timeframe robustness
ENGINE (BI-WVF + Z-SCORE)
- WVF Long and Short computed separately (panic vs euphoria)
- Z-score window normalizes extremes
- Thresholds are TF-aware (15m / 1h / 4h / D / W / M)
QUALITY FILTERS
- JMA trend filter (slope-based, low-lag)
- ADX minimum for trend strength
- Min Extreme Duration to avoid 1-bar noise
- Cooldown to prevent signal clustering
ACCEPT / REJECT LOGIC
- Events are evaluated after reactBars (forward follow-through)
- Accepted : follow-through >= minFollowATR
- Rejected : follow-through < minFollowATR
- Scores (0..1) optionally plotted as acceptance strength
BIAS / REGIME CONTEXT
- Bias line : zL - zS (who dominates)
- Bias band : regime threshold (only meaningful outside band)
- HTF Wind : higher-timeframe bias flip (JMA smoothed)
- Clarity Label : regime entry aligned with HTF + absBias threshold
VISUALIZATION
- Stress Lines : Red = downside stress (panic), Green = upside stress (euphoria)
- Bias Line : zL - zS (who dominates). Neutral inside band, colored outside.
- Bias Band : regime threshold. Fill shows when bias is usable.
- Zones : boxes at peak events (history preserved, FIFO capped)
- Chart Labels : DA/DR/UA/UR (or LA/LR/SA/SR) at peaks
- Lines : reaction window + peak level lines (FIFO capped)
STRESS COLOR MODE
- Intuitive : Downside stress = green, Upside stress = red (opportunity mapping)
- Technical : Downside stress = red, Upside stress = green (classic convention)
- This setting is visual only ; logic, bias, and signals are unchanged
HOW TO USE
1. Read the stress lines : red spikes = panic risk, green spikes = euphoria risk.
2. Check bias : outside the band = usable regime; inside = noise.
3. Use DA/DR/UA/UR :
- DA/UA = stress accepted (follow-through confirmed)
- DR/UR = stress rejected (weak follow-through)
4. Add HTF wind : prefer signals aligned with HTF bias.
5. Tune presets by TF; use manual TF override for testing.
PRESETS & UI
- Full TF preset table (15m / 1h / 4h / D / W / M)
- Manual TF override for testing
- Preset summary panel (optional)
LOGGING (CSV)
- Pivot and stress logs for validation
- Early/First-pivot classification options
- Label IDs included for chart-to-log tracing
BEST USE CASES
- Panic/euphoria detection with follow-through validation
- Regime-aware context (bias + HTF wind)
- Multi-timeframe stress mapping (15m to Weekly)
Version: 1.0.0
Author: WavesUnchained
Pine Script: v6
Educational use only. Test thoroughly before live trading.
