Scout Regiment - KSI# Scout Regiment - KSI Indicator
## English Documentation
### Overview
Scout Regiment - KSI (Key Stochastic Indicators) is a comprehensive momentum oscillator that combines three powerful technical indicators - RSI, CCI, and Williams %R - into a single, unified display. This multi-indicator approach provides traders with diverse perspectives on market momentum, overbought/oversold conditions, and potential reversal points through advanced divergence detection.
### What is KSI?
KSI stands for "Key Stochastic Indicators" - a composite momentum indicator that:
- Displays multiple oscillators normalized to a 0-100 scale
- Uses standardized bands (20/50/80) for consistent interpretation
- Combines RSI for trend, CCI for cycle, and Williams %R for reversal detection
- Provides enhanced divergence detection specifically for RSI
### Key Features
#### 1. **Triple Oscillator System**
**① RSI (Relative Strength Index)** - Primary Indicator
- **Purpose**: Measures momentum and identifies overbought/oversold conditions
- **Default Length**: 22 periods
- **Display**: Blue line (2px)
- **Key Levels**:
- Above 50: Bullish momentum
- Below 50: Bearish momentum
- Above 80: Overbought
- Below 20: Oversold
- **Special Features**:
- Background color indication (green/red)
- Crossover labels at 50 level
- Full divergence detection (4 types)
**② CCI (Commodity Channel Index)** - Dual Period
- **Purpose**: Identifies cyclical trends and extreme conditions
- **Dual Display**:
- CCI(33): Short-term cycle - Green line (1px)
- CCI(77): Medium-term cycle - Orange line (1px)
- **Default Source**: HLC3 (typical price)
- **Normalized Scale**: Mapped from ±100 to 0-100 for consistency
- **Interpretation**:
- Above 80: Strong upward momentum
- Below 20: Strong downward momentum
- 50 level: Neutral
- Divergence between periods: Trend change warning
**③ Williams %R** - Optional
- **Purpose**: Identifies overbought/oversold extremes
- **Default Length**: 28 periods
- **Display**: Magenta line (2px)
- **Scale**: Inverted and normalized to 0-100
- **Best For**: Short-term reversal signals
- **Default**: Disabled (enable when needed for extra confirmation)
#### 2. **Standardized Band System**
**Three-Level Structure:**
- **Upper Band (80)**: Overbought zone
- Strong momentum area
- Watch for reversal signals
- Divergences here are most reliable
- **Middle Line (50)**: Equilibrium
- Separates bullish/bearish zones
- Crossovers indicate momentum shifts
- Key decision level
- **Lower Band (20)**: Oversold zone
- Weak momentum area
- Look for bounce signals
- Divergences here signal potential reversals
**Band Fill**: Dark background between 20-80 for visual clarity
#### 3. **RSI Visual Enhancements**
**Background Color Indication**
- Green background: RSI above 50 (bullish bias)
- Red background: RSI below 50 (bearish bias)
- Optional display for cleaner charts
- Helps identify overall momentum direction
**Crossover Labels**
- "突破" (Breakout): RSI crosses above 50
- "跌破" (Breakdown): RSI crosses below 50
- Marks momentum shift points
- Can be toggled on/off
#### 4. **Advanced RSI Divergence Detection**
The indicator includes comprehensive divergence detection for RSI only (most reliable oscillator):
**Regular Bullish Divergence (Yellow)**
- **Price**: Lower lows
- **RSI**: Higher lows
- **Signal**: Potential upward reversal
- **Label**: "涨" (Up)
- **Most Common**: Near oversold levels (below 30)
**Regular Bearish Divergence (Blue)**
- **Price**: Higher highs
- **RSI**: Lower highs
- **Signal**: Potential downward reversal
- **Label**: "跌" (Down)
- **Most Common**: Near overbought levels (above 70)
**Hidden Bullish Divergence (Light Yellow)**
- **Price**: Higher lows
- **RSI**: Lower lows
- **Signal**: Uptrend continuation
- **Label**: "隐涨" (Hidden Up)
- **Use**: Add to existing longs
**Hidden Bearish Divergence (Light Blue)**
- **Price**: Lower highs
- **RSI**: Higher highs
- **Signal**: Downtrend continuation
- **Label**: "隐跌" (Hidden Down)
- **Use**: Add to existing shorts
**Divergence Parameters** (Fully Customizable):
- **Right Lookback**: Bars to right of pivot (default: 5)
- **Left Lookback**: Bars to left of pivot (default: 5)
- **Max Range**: Maximum bars between pivots (default: 60)
- **Min Range**: Minimum bars between pivots (default: 5)
### Configuration Settings
#### KSI Display Settings
- **Show RSI**: Toggle RSI indicator
- **Show CCI**: Toggle both CCI lines
- **Show Williams %R**: Toggle Williams %R (optional)
#### RSI Settings
- **RSI Length**: Period for calculation (default: 22)
- **Data Source**: Price source (default: close)
- **Show Background**: Toggle green/red background
- **Show Cross Labels**: Toggle 50-level crossover labels
#### RSI Divergence Settings
- **Right Lookback**: Pivot detection right side
- **Left Lookback**: Pivot detection left side
- **Max Range**: Maximum lookback distance
- **Min Range**: Minimum lookback distance
- **Show Regular Divergence**: Enable regular divergence lines
- **Show Regular Labels**: Enable regular divergence labels
- **Show Hidden Divergence**: Enable hidden divergence lines
- **Show Hidden Labels**: Enable hidden divergence labels
#### CCI Settings
- **CCI Length**: Short-term period (default: 33)
- **CCI Mid Length**: Medium-term period (default: 77)
- **Data Source**: Price calculation (default: HLC3)
- **Show CCI(33)**: Toggle short-term CCI
- **Show CCI(77)**: Toggle medium-term CCI
#### Williams %R Settings
- **Length**: Calculation period (default: 28)
- **Data Source**: Price source (default: close)
### How to Use
#### For Basic Momentum Trading
1. **Enable RSI Only** (primary indicator)
- Focus on 50-level crossovers
- Enable crossover labels for signals
2. **Identify Momentum Direction**
- RSI > 50 = Bullish momentum
- RSI < 50 = Bearish momentum
- Background color confirms direction
3. **Look for Extremes**
- RSI > 80 = Overbought (consider selling)
- RSI < 20 = Oversold (consider buying)
4. **Trade Setup**
- Enter long when RSI crosses above 50 from oversold
- Enter short when RSI crosses below 50 from overbought
#### For Divergence Trading
1. **Enable RSI with Divergence Detection**
- Turn on regular divergence
- Optionally add hidden divergence
2. **Wait for Divergence Signal**
- Yellow label = Bullish divergence
- Blue label = Bearish divergence
3. **Confirm with Price Structure**
- Wait for support/resistance break
- Look for candlestick patterns
- Check volume confirmation
4. **Enter Position**
- Enter after confirmation
- Stop beyond divergence pivot
- Target next key level
#### For Multi-Oscillator Confirmation
1. **Enable All Three Indicators**
- RSI (momentum)
- CCI dual (cycle analysis)
- Williams %R (extremes)
2. **Look for Alignment**
- All above 50 = Strong bullish
- All below 50 = Strong bearish
- Mixed signals = Consolidation
3. **Identify Extremes**
- All indicators > 80 = Extreme overbought
- All indicators < 20 = Extreme oversold
4. **Trade Reversals**
- Enter counter-trend when all aligned at extremes
- Confirm with divergence if available
- Use tight stops
#### For CCI Dual-Period Analysis
1. **Enable Both CCI Lines**
- CCI(33) = Short-term
- CCI(77) = Medium-term
2. **Watch for Crossovers**
- Green crosses above orange = Bullish acceleration
- Green crosses below orange = Bearish acceleration
3. **Analyze Divergence Between Periods**
- Short-term rising, medium falling = Potential reversal
- Both rising together = Strong trend
4. **Trade Accordingly**
- Follow crossover direction
- Exit when lines converge
### Trading Strategies
#### Strategy 1: RSI 50-Level Crossover
**Setup:**
- Enable RSI with background and labels
- Wait for clear trend
- Look for retracement to 50 level
**Entry:**
- Long: "突破" label appears after pullback
- Short: "跌破" label appears after bounce
**Stop Loss:**
- Long: Below recent swing low
- Short: Above recent swing high
**Exit:**
- Opposite crossover label
- Or predetermined target (2:1 risk-reward)
**Best For:** Trend following, clear markets
#### Strategy 2: RSI Divergence Reversal
**Setup:**
- Enable RSI with regular divergence
- Wait for extreme levels (>70 or <30)
- Look for divergence signal
**Entry:**
- Long: Yellow "涨" label at oversold level
- Short: Blue "跌" label at overbought level
**Confirmation:**
- Wait for price to break structure
- Check for volume increase
- Look for candlestick reversal pattern
**Stop Loss:**
- Beyond divergence pivot point
**Exit:**
- Take partial profit at 50 level
- Exit remainder at opposite extreme or divergence
**Best For:** Swing trading, range-bound markets
#### Strategy 3: Triple Oscillator Confluence
**Setup:**
- Enable all three indicators
- Wait for all to reach extreme (>80 or <20)
- Look for alignment
**Entry:**
- Long: All three below 20, first one crosses above 20
- Short: All three above 80, first one crosses below 80
**Confirmation:**
- All indicators must align
- Price at support/resistance
- Volume spike helps
**Stop Loss:**
- Fixed percentage or ATR-based
**Exit:**
- When any indicator crosses 50 level
- Or at predetermined target
**Best For:** High-probability reversals, volatile markets
#### Strategy 4: CCI Dual-Period System
**Setup:**
- Enable both CCI lines only
- Disable RSI and Williams %R for clarity
- Watch for crossovers
**Entry:**
- Long: CCI(33) crosses above CCI(77) below 50 line
- Short: CCI(33) crosses below CCI(77) above 50 line
**Confirmation:**
- Both should be moving in entry direction
- Price breaking key level helps
**Stop Loss:**
- When CCIs cross back in opposite direction
**Exit:**
- Both CCIs enter opposite extreme zone
- Or trailing stop
**Best For:** Catching trend continuations, momentum trading
#### Strategy 5: Hidden Divergence Continuation
**Setup:**
- Enable RSI with hidden divergence
- Confirm existing trend
- Wait for pullback
**Entry:**
- Uptrend: "隐涨" label during pullback
- Downtrend: "隐跌" label during bounce
**Confirmation:**
- Price holds key moving average
- Trend structure intact
**Stop Loss:**
- Beyond pullback extreme
**Exit:**
- Regular divergence appears (reversal warning)
- Or trend structure breaks
**Best For:** Adding to positions, trend trading
### Best Practices
#### Choosing Which Indicators to Display
**For Beginners:**
- Use RSI only
- Enable background color and labels
- Focus on 50-level crossovers
- Simple and effective
**For Intermediate Traders:**
- RSI + Regular Divergence
- Add CCI for confirmation
- Use dual perspectives
- Better accuracy
**For Advanced Traders:**
- All three indicators
- Full divergence detection
- Multi-timeframe analysis
- Maximum information
#### Oscillator Priority
**Primary**: RSI (22)
- Most reliable
- Best divergence detection
- Good for all timeframes
- Use this as your main decision maker
**Secondary**: CCI (33/77)
- Adds cycle analysis
- Great for confirmation
- Dual-period crossovers valuable
- Use to confirm RSI signals
**Tertiary**: Williams %R (28)
- Extreme readings useful
- More volatile
- Best for short-term
- Use sparingly for extra confirmation
#### Timeframe Considerations
**Lower Timeframes (1m-15m):**
- More signals, less reliable
- Use tight divergence parameters
- Focus on RSI crossovers
- Quick entries and exits
**Medium Timeframes (30m-4H):**
- Balanced signal frequency
- Default settings work well
- Best for divergence trading
- Swing trading optimal
**Higher Timeframes (Daily+):**
- Fewer but stronger signals
- Widen divergence ranges
- All indicators more reliable
- Position trading best
#### Divergence Trading Tips
1. **Wait for Confirmation**
- Divergence alone isn't enough
- Need price structure break
- Volume helps validate
2. **Best at Extremes**
- Divergences near 80/20 levels most reliable
- Mid-level divergences often fail
- Combine with support/resistance
3. **Multiple Divergences**
- Second divergence stronger than first
- Third divergence extremely powerful
- Watch for "triple divergence"
4. **Timeframe Alignment**
- Check higher timeframe for direction
- Trade divergences in direction of larger trend
- Counter-trend divergences riskier
### Indicator Combinations
**With Moving Averages:**
- Use EMAs (21/55/144) for trend
- KSI for entry timing
- Enter when both align
**With Volume:**
- Volume confirms breakouts
- Divergence + volume divergence = Stronger
- Low volume at extremes = Reversal likely
**With Support/Resistance:**
- Price levels for targets
- KSI for entry timing
- Divergences at levels = Highest probability
**With Bias Indicator:**
- Bias shows price deviation
- KSI shows momentum
- Both diverging = Strong reversal signal
**With OBV Indicator:**
- OBV shows volume trend
- KSI shows price momentum
- Volume/momentum divergence powerful
### Common Patterns
1. **Bullish Reversal**: All oscillators oversold + RSI bullish divergence
2. **Bearish Reversal**: All oscillators overbought + RSI bearish divergence
3. **Trend Acceleration**: RSI > 50, both CCIs rising, Williams %R not extreme
4. **Weakening Trend**: RSI declining while price rising (pre-divergence warning)
5. **Strong Trend**: All oscillators stay above/below 50 for extended period
6. **Consolidation**: Oscillators crossing 50 frequently without extremes
7. **Exhaustion**: Multiple oscillators at extreme + hidden divergence failure
### Performance Tips
- Start simple: RSI only
- Add indicators gradually as you learn
- Disable unused features for cleaner charts
- Use labels strategically (not always on)
- Test different RSI lengths for your market
- Adjust divergence parameters based on volatility
### Alert Conditions
The indicator includes alerts for:
- RSI crossing above 50
- RSI crossing below 50
- RSI regular bullish divergence
- RSI regular bearish divergence
- RSI hidden bullish divergence
- RSI hidden bearish divergence
---
## 中文说明文档
### 概述
Scout Regiment - KSI(关键随机指标)是一个综合性动量振荡器,将三个强大的技术指标 - RSI、CCI和威廉指标 - 组合到一个统一的显示中。这种多指标方法为交易者提供了市场动量、超买超卖状况和通过高级背离检测发现潜在反转点的多元视角。
### 什么是KSI?
KSI代表"关键随机指标" - 一个综合动量指标:
- 显示多个振荡器,标准化到0-100刻度
- 使用标准化波段(20/50/80)便于一致解读
- 结合RSI用于趋势、CCI用于周期、威廉指标用于反转检测
- 专门为RSI提供增强的背离检测
### 核心功能
#### 1. **三重振荡器系统**
**① RSI(相对强弱指数)** - 主要指标
- **用途**:测量动量并识别超买超卖状况
- **默认长度**:22周期
- **显示**:蓝色线(2像素)
- **关键水平**:
- 50以上:看涨动量
- 50以下:看跌动量
- 80以上:超买
- 20以下:超卖
- **特殊功能**:
- 背景颜色指示(绿色/红色)
- 50水平穿越标签
- 完整背离检测(4种类型)
**② CCI(顺势指标)** - 双周期
- **用途**:识别周期性趋势和极端状况
- **双重显示**:
- CCI(33):短期周期 - 绿色线(1像素)
- CCI(77):中期周期 - 橙色线(1像素)
- **默认数据源**:HLC3(典型价格)
- **标准化刻度**:从±100映射到0-100以保持一致性
- **解读**:
- 80以上:强劲上升动量
- 20以下:强劲下降动量
- 50水平:中性
- 周期间背离:趋势变化警告
**③ 威廉指标 %R** - 可选
- **用途**:识别超买超卖极值
- **默认长度**:28周期
- **显示**:洋红色线(2像素)
- **刻度**:反转并标准化到0-100
- **最适合**:短期反转信号
- **默认**:禁用(需要额外确认时启用)
#### 2. **标准化波段系统**
**三层结构:**
- **上轨(80)**:超买区域
- 强动量区域
- 注意反转信号
- 此处的背离最可靠
- **中线(50)**:均衡线
- 分隔看涨/看跌区域
- 穿越表示动量转变
- 关键决策水平
- **下轨(20)**:超卖区域
- 弱动量区域
- 寻找反弹信号
- 此处的背离预示潜在反转
**波段填充**:20-80之间的深色背景,增强视觉清晰度
#### 3. **RSI视觉增强**
**背景颜色指示**
- 绿色背景:RSI在50以上(看涨偏向)
- 红色背景:RSI在50以下(看跌偏向)
- 可选显示,图表更清爽
- 帮助识别整体动量方向
**穿越标签**
- "突破":RSI向上穿越50
- "跌破":RSI向下穿越50
- 标记动量转变点
- 可开关
#### 4. **高级RSI背离检测**
指标仅为RSI(最可靠的振荡器)提供全面背离检测:
**常规看涨背离(黄色)**
- **价格**:更低的低点
- **RSI**:更高的低点
- **信号**:潜在向上反转
- **标签**:"涨"
- **最常见**:在超卖水平附近(30以下)
**常规看跌背离(蓝色)**
- **价格**:更高的高点
- **RSI**:更低的高点
- **信号**:潜在向下反转
- **标签**:"跌"
- **最常见**:在超买水平附近(70以上)
**隐藏看涨背离(浅黄色)**
- **价格**:更高的低点
- **RSI**:更低的低点
- **信号**:上升趋势延续
- **标签**:"隐涨"
- **用途**:加仓现有多头
**隐藏看跌背离(浅蓝色)**
- **价格**:更低的高点
- **RSI**:更高的高点
- **信号**:下降趋势延续
- **标签**:"隐跌"
- **用途**:加仓现有空头
**背离参数**(完全可自定义):
- **右侧回溯**:枢轴点右侧K线数(默认:5)
- **左侧回溯**:枢轴点左侧K线数(默认:5)
- **最大范围**:枢轴点之间最大K线数(默认:60)
- **最小范围**:枢轴点之间最小K线数(默认:5)
### 配置设置
#### KSI显示设置
- **显示RSI**:切换RSI指标
- **显示CCI**:切换两条CCI线
- **显示威廉指标 %R**:切换威廉指标(可选)
#### RSI设置
- **RSI长度**:计算周期(默认:22)
- **数据源**:价格源(默认:收盘价)
- **显示背景**:切换绿色/红色背景
- **显示穿越标签**:切换50水平穿越标签
#### RSI背离设置
- **右侧回溯**:枢轴检测右侧
- **左侧回溯**:枢轴检测左侧
- **回溯范围最大值**:最大回溯距离
- **回溯范围最小值**:最小回溯距离
- **显示常规背离**:启用常规背离线
- **显示常规背离标签**:启用常规背离标签
- **显示隐藏背离**:启用隐藏背离线
- **显示隐藏背离标签**:启用隐藏背离标签
#### CCI设置
- **CCI长度**:短期周期(默认:33)
- **CCI中期长度**:中期周期(默认:77)
- **数据源**:价格计算(默认:HLC3)
- **显示CCI(33)**:切换短期CCI
- **显示CCI(77)**:切换中期CCI
#### 威廉指标 %R 设置
- **长度**:计算周期(默认:28)
- **数据源**:价格源(默认:收盘价)
### 使用方法
#### 基础动量交易
1. **仅启用RSI**(主要指标)
- 关注50水平穿越
- 启用穿越标签获取信号
2. **识别动量方向**
- RSI > 50 = 看涨动量
- RSI < 50 = 看跌动量
- 背景颜色确认方向
3. **寻找极值**
- RSI > 80 = 超买(考虑卖出)
- RSI < 20 = 超卖(考虑买入)
4. **交易设置**
- RSI从超卖区向上穿越50时做多
- RSI从超买区向下穿越50时做空
#### 背离交易
1. **启用RSI和背离检测**
- 打开常规背离
- 可选添加隐藏背离
2. **等待背离信号**
- 黄色标签 = 看涨背离
- 蓝色标签 = 看跌背离
3. **用价格结构确认**
- 等待支撑/阻力突破
- 寻找K线形态
- 检查成交量确认
4. **进入仓位**
- 确认后进入
- 止损设在背离枢轴点之外
- 目标下一个关键水平
#### 多振荡器确认
1. **启用全部三个指标**
- RSI(动量)
- CCI双周期(周期分析)
- 威廉指标 %R(极值)
2. **寻找一致性**
- 全部在50以上 = 强劲看涨
- 全部在50以下 = 强劲看跌
- 信号混合 = 盘整
3. **识别极值**
- 所有指标 > 80 = 极度超买
- 所有指标 < 20 = 极度超卖
4. **交易反转**
- 所有指标在极值一致时逆势进入
- 可能的话用背离确认
- 使用紧密止损
#### CCI双周期分析
1. **启用两条CCI线**
- CCI(33) = 短期
- CCI(77) = 中期
2. **观察穿越**
- 绿色线穿越橙色线向上 = 看涨加速
- 绿色线穿越橙色线向下 = 看跌加速
3. **分析周期间背离**
- 短期上升,中期下降 = 潜在反转
- 两者同时上升 = 强趋势
4. **相应交易**
- 跟随穿越方向
- 线条汇合时退出
### 交易策略
#### 策略1:RSI 50水平穿越
**设置:**
- 启用RSI及背景和标签
- 等待明确趋势
- 寻找回调至50水平
**入场:**
- 多头:回调后出现"突破"标签
- 空头:反弹后出现"跌破"标签
**止损:**
- 多头:近期波动低点之下
- 空头:近期波动高点之上
**离场:**
- 出现相反穿越标签
- 或预定目标(2:1风险收益比)
**适合:**趋势跟随、明确市场
#### 策略2:RSI背离反转
**设置:**
- 启用RSI和常规背离
- 等待极端水平(>70或<30)
- 寻找背离信号
**入场:**
- 多头:超卖水平出现黄色"涨"标签
- 空头:超买水平出现蓝色"跌"标签
**确认:**
- 等待价格突破结构
- 检查成交量增加
- 寻找K线反转形态
**止损:**
- 背离枢轴点之外
**离场:**
- 在50水平部分获利
- 其余在相反极值或背离处离场
**适合:**波段交易、震荡市场
#### 策略3:三重振荡器汇合
**设置:**
- 启用全部三个指标
- 等待全部达到极值(>80或<20)
- 寻找一致性
**入场:**
- 多头:三个全部低于20,第一个向上穿越20
- 空头:三个全部高于80,第一个向下穿越80
**确认:**
- 所有指标必须一致
- 价格在支撑/阻力位
- 成交量激增有帮助
**止损:**
- 固定百分比或基于ATR
**离场:**
- 任一指标穿越50水平时
- 或在预定目标
**适合:**高概率反转、波动市场
#### 策略4:CCI双周期系统
**设置:**
- 仅启用两条CCI线
- 禁用RSI和威廉指标以保持清晰
- 观察穿越
**入场:**
- 多头:CCI(33)在50线下方向上穿越CCI(77)
- 空头:CCI(33)在50线上方向下穿越CCI(77)
**确认:**
- 两者都应朝入场方向移动
- 价格突破关键水平有帮助
**止损:**
- CCI反向穿越时
**离场:**
- 两条CCI进入相反极值区域
- 或移动止损
**适合:**捕捉趋势延续、动量交易
#### 策略5:隐藏背离延续
**设置:**
- 启用RSI和隐藏背离
- 确认现有趋势
- 等待回调
**入场:**
- 上升趋势:回调期间出现"隐涨"标签
- 下降趋势:反弹期间出现"隐跌"标签
**确认:**
- 价格守住关键移动平均线
- 趋势结构完整
**止损:**
- 回调极值之外
**离场:**
- 出现常规背离(反转警告)
- 或趋势结构破坏
**适合:**加仓、趋势交易
### 最佳实践
#### 选择显示哪些指标
**新手:**
- 仅使用RSI
- 启用背景颜色和标签
- 关注50水平穿越
- 简单有效
**中级交易者:**
- RSI + 常规背离
- 添加CCI确认
- 使用双重视角
- 更高准确度
**高级交易者:**
- 全部三个指标
- 完整背离检测
- 多时间框架分析
- 信息最大化
#### 振荡器优先级
**主要**:RSI (22)
- 最可靠
- 最佳背离检测
- 适用所有时间框架
- 用作主要决策依据
**次要**:CCI (33/77)
- 添加周期分析
- 确认效果好
- 双周期穿越有价值
- 用于确认RSI信号
**第三**:威廉指标 %R (28)
- 极值读数有用
- 更波动
- 最适合短期
- 谨慎使用以获额外确认
#### 时间框架考虑
**低时间框架(1分钟-15分钟):**
- 更多信号,可靠性较低
- 使用紧密背离参数
- 关注RSI穿越
- 快速进出
**中等时间框架(30分钟-4小时):**
- 信号频率平衡
- 默认设置效果好
- 最适合背离交易
- 波段交易最优
**高时间框架(日线+):**
- 信号较少但更强
- 扩大背离范围
- 所有指标更可靠
- 最适合仓位交易
#### 背离交易技巧
1. **等待确认**
- 仅背离不够
- 需要价格结构突破
- 成交量帮助验证
2. **极值处最佳**
- 80/20水平附近的背离最可靠
- 中间水平背离常失败
- 结合支撑/阻力
3. **多重背离**
- 第二次背离强于第一次
- 第三次背离极其强大
- 注意"三重背离"
4. **时间框架对齐**
- 检查更高时间框架方向
- 顺大趋势方向交易背离
- 逆势背离风险更大
### 指标组合
**与移动平均线配合:**
- 使用EMA(21/55/144)确定趋势
- KSI用于入场时机
- 两者一致时进入
**与成交量配合:**
- 成交量确认突破
- 背离 + 成交量背离 = 更强
- 极值处低成交量 = 可能反转
**与支撑/阻力配合:**
- 价格水平作为目标
- KSI用于入场时机
- 水平处的背离 = 最高概率
**与Bias指标配合:**
- Bias显示价格偏离
- KSI显示动量
- 两者都背离 = 强反转信号
**与OBV指标配合:**
- OBV显示成交量趋势
- KSI显示价格动量
- 成交量/动量背离强大
### 常见形态
1. **看涨反转**:所有振荡器超卖 + RSI看涨背离
2. **看跌反转**:所有振荡器超买 + RSI看跌背离
3. **趋势加速**:RSI > 50,两条CCI上升,威廉指标不极端
4. **趋势减弱**:价格上升时RSI下降(背离前警告)
5. **强趋势**:所有振荡器长时间保持在50上方/下方
6. **盘整**:振荡器频繁穿越50无极值
7. **衰竭**:多个振荡器在极值 + 隐藏背离失败
### 性能提示
- 从简单开始:仅RSI
- 学习时逐渐添加指标
- 禁用未使用功能以保持图表清晰
- 策略性使用标签(不总是开启)
- 为您的市场测试不同RSI长度
- 根据波动性调整背离参数
### 警报条件
指标包含以下警报:
- RSI向上穿越50
- RSI向下穿越50
- RSI常规看涨背离
- RSI常规看跌背离
- RSI隐藏看涨背离
- RSI隐藏看跌背离
---
## Technical Support
For questions or issues, please refer to the TradingView community or contact the indicator creator.
## 技术支持
如有问题,请参考TradingView社区或联系指标创建者。
Search in scripts for "bias"

Scout Regiment - OBV# Scout Regiment - OBV Indicator
## English Documentation
### Overview
Scout Regiment - OBV (On-Balance Volume) is an advanced momentum indicator that combines volume and price movement to identify the strength of buying and selling pressure. This indicator features an oscillator-based approach with divergence detection to help traders spot potential trend reversals and confirm price movements.
### What is OBV?
On-Balance Volume (OBV) is a cumulative volume indicator that adds volume on up days and subtracts volume on down days:
- **Rising OBV**: Accumulation (buying pressure)
- **Falling OBV**: Distribution (selling pressure)
- **OBV Oscillator**: The difference between OBV and its smoothed moving average, making divergences easier to spot
### Key Features
#### 1. **OBV Oscillator Display**
Instead of displaying raw OBV values, this indicator shows the oscillator (difference between OBV and its smoothed line):
**Benefits:**
- Easier to identify divergences
- Clearer trend changes
- More sensitive to momentum shifts
- Zero line as reference point
**Visual Elements:**
- **Step Line**: Main OBV oscillator line
- Green: Positive oscillator (accumulation)
- Red: Negative oscillator (distribution)
- **Histogram**: Visual representation of oscillator strength
- Green bars: Above zero line
- Red bars: Below zero line
- **Zero Line**: White dotted horizontal line as reference
#### 2. **Smoothing Options**
Choose from multiple moving average types to smooth the OBV:
- **None**: Raw OBV (most sensitive)
- **SMA**: Simple Moving Average (equal weight)
- **EMA**: Exponential Moving Average (recent price emphasis) - Default
- **SMMA (RMA)**: Smoothed Moving Average (very smooth)
- **WMA**: Weighted Moving Average (linear weight)
- **VWMA**: Volume Weighted Moving Average (volume emphasis)
**Default Settings:**
- Type: EMA
- Length: 21 periods
- Best for: Most market conditions
#### 3. **Multi-Timeframe Analysis**
- Calculate OBV on any timeframe
- View higher timeframe momentum on lower timeframe charts
- Align trades with larger timeframe volume trends
- Empty field = Current chart timeframe
#### 4. **Visual Enhancements**
**Background Color**
- Light green: Positive oscillator (bullish volume pressure)
- Light red: Negative oscillator (bearish volume pressure)
- Optional display for cleaner charts
**Crossover Labels**
- "突破" (Breakout): When oscillator crosses above zero
- "跌破" (Breakdown): When oscillator crosses below zero
- Indicates potential trend changes
- Can be toggled on/off
#### 5. **Comprehensive Divergence Detection**
The indicator automatically detects four types of divergences:
**Regular Bullish Divergence (Yellow)**
- **Price**: Makes lower lows
- **OBV**: Makes higher lows
- **Signal**: Potential upward reversal
- **Label**: "看涨" (Bullish)
- **Use**: Enter long positions
**Regular Bearish Divergence (Blue)**
- **Price**: Makes higher highs
- **OBV**: Makes lower highs
- **Signal**: Potential downward reversal
- **Label**: "看跌" (Bearish)
- **Use**: Enter short positions or exit longs
**Hidden Bullish Divergence (Light Yellow)**
- **Price**: Makes higher lows
- **OBV**: Makes lower lows
- **Signal**: Trend continuation (uptrend)
- **Label**: "隐藏看涨" (Hidden Bullish)
- **Use**: Add to long positions
**Hidden Bearish Divergence (Light Blue)**
- **Price**: Makes lower highs
- **OBV**: Makes higher highs
- **Signal**: Trend continuation (downtrend)
- **Label**: "隐藏看跌" (Hidden Bearish)
- **Use**: Add to short positions
#### 6. **Customizable Divergence Detection**
**Pivot Lookback Settings:**
- **Left Lookback**: Bars to the left of pivot (default: 5)
- **Right Lookback**: Bars to the right of pivot (default: 5)
- Determines how "extreme" a point must be to qualify as a pivot
**Range Settings:**
- **Maximum Range**: Maximum bars between pivots (default: 60)
- **Minimum Range**: Minimum bars between pivots (default: 5)
- Filters out too-close or too-distant divergences
**Display Options:**
- Toggle regular divergences on/off
- Toggle hidden divergences on/off
- Toggle divergence labels on/off
- Show only the divergences you need
### Configuration Settings
#### Smoothing Settings
- **Smoothing Type**: Choose MA type (None/SMA/EMA/SMMA/WMA/VWMA)
- **Smoothing Length**: Number of periods for smoothing (default: 21)
#### Calculation Settings
- **Timeframe**: Select calculation timeframe (empty = current chart)
#### Display Settings
- **Show OBV Line**: Toggle step line display
- **Show OBV Histogram**: Toggle histogram display
- **Show Background Color**: Toggle background coloring
- **Show Crossover Labels**: Toggle breakout/breakdown labels
#### Divergence Settings
- **Pivot Right Lookback**: Right bars for pivot detection (default: 5)
- **Pivot Left Lookback**: Left bars for pivot detection (default: 5)
- **Range Maximum**: Max bars between divergences (default: 60)
- **Range Minimum**: Min bars between divergences (default: 5)
- **Show Regular Divergences**: Enable/disable regular divergences
- **Show Regular Labels**: Enable/disable regular divergence labels
- **Show Hidden Divergences**: Enable/disable hidden divergences
- **Show Hidden Labels**: Enable/disable hidden divergence labels
### How to Use
#### For Trend Confirmation
1. **Identify Trend with Price**
- Uptrend: Higher highs and higher lows
- Downtrend: Lower highs and lower lows
2. **Confirm with OBV Oscillator**
- Strong uptrend: OBV oscillator staying positive
- Strong downtrend: OBV oscillator staying negative
- Weak trend: OBV oscillator frequently crossing zero
3. **Volume Confirmation**
- Trend with increasing OBV = Strong trend
- Trend with decreasing OBV = Weak trend (watch for reversal)
#### For Divergence Trading
1. **Enable Divergence Detection**
- Start with regular divergences only
- Add hidden divergences for trend continuation
2. **Wait for Divergence Signal**
- Yellow label = Potential bullish reversal
- Blue label = Potential bearish reversal
3. **Confirm with Price Action**
- Wait for support/resistance break
- Look for candlestick confirmation
- Check higher timeframe alignment
4. **Enter Trade**
- Enter after confirmation
- Set stop loss beyond recent swing
- Target based on previous swing or support/resistance
#### For Breakout Trading
1. **Enable Crossover Labels**
- Identify when oscillator crosses zero line
2. **Confirm Volume Strength**
- Strong breakouts have large oscillator moves
- Weak breakouts barely cross zero
3. **Trade Direction**
- "突破" label = Enter long
- "跌破" label = Enter short
4. **Manage Position**
- Exit when oscillator crosses back
- Use price structure for stops
#### For Multi-Timeframe Analysis
1. **Set Higher Timeframe**
- Example: On 15min chart, set timeframe to 1H or 4H
2. **Identify Higher Timeframe Trend**
- Positive oscillator = Uptrend bias
- Negative oscillator = Downtrend bias
3. **Trade with the Trend**
- Only take long signals in uptrend
- Only take short signals in downtrend
4. **Time Entries**
- Use current timeframe for precise entry
- Confirm with higher timeframe direction
### Trading Strategies
#### Strategy 1: Regular Divergence Reversal
**Setup:**
1. Price in strong trend (up or down)
2. Regular divergence appears
3. Price reaches support/resistance level
**Entry:**
- Bullish: After "看涨" label, when price breaks above recent high
- Bearish: After "看跌" label, when price breaks below recent low
**Stop Loss:**
- Bullish: Below divergence low
- Bearish: Above divergence high
**Exit:**
- Take profit at next major support/resistance
- Or when opposite divergence appears
**Best For:** Swing trading, reversal trading
#### Strategy 2: Hidden Divergence Continuation
**Setup:**
1. Clear trend established
2. Price pulls back (retracement)
3. Hidden divergence appears
**Entry:**
- Bullish: After "隐藏看涨" label, when price resumes uptrend
- Bearish: After "隐藏看跌" label, when price resumes downtrend
**Stop Loss:**
- Behind the pullback swing point
**Exit:**
- Trail stop as trend continues
- Exit on regular divergence (reversal signal)
**Best For:** Trend following, adding to positions
#### Strategy 3: Zero Line Crossover
**Setup:**
1. Enable crossover labels
2. Oscillator crosses zero line
3. Confirm with price structure break
**Entry:**
- "突破" label = Buy signal
- "跌破" label = Sell signal
**Stop Loss:**
- Below/above recent swing
**Exit:**
- When oscillator crosses back over zero
- Or at predetermined target
**Best For:** Momentum trading, quick trades
#### Strategy 4: Multi-Timeframe Confluence
**Setup:**
1. Set indicator to higher timeframe (e.g., 4H on 1H chart)
2. Wait for higher TF oscillator to be positive (uptrend) or negative (downtrend)
3. Look for entries on current timeframe aligned with higher TF
**Entry:**
- Long: When both timeframes show positive oscillator or bullish divergence
- Short: When both timeframes show negative oscillator or bearish divergence
**Stop Loss:**
- Based on current timeframe structure
**Exit:**
- When higher timeframe oscillator turns negative (for longs) or positive (for shorts)
**Best For:** Swing trading, high-probability setups
### Best Practices
#### Volume Analysis
1. **Strong Moves Need Volume**
- Price increase + Rising OBV = Healthy uptrend
- Price increase + Falling OBV = Weak uptrend (warning)
2. **Watch for Confirmation**
- New highs with new OBV highs = Confirmed
- New highs without new OBV highs = Potential divergence
3. **Consider Context**
- Low volume periods (Asian session, holidays) = Less reliable
- High volume periods (News, London/NY overlap) = More reliable
#### Divergence Trading Tips
1. **Not All Divergences Work**
- Wait for price confirmation
- Stronger in oversold/overbought areas
- Better at support/resistance levels
2. **Multiple Divergences**
- Multiple divergences on same trend = Stronger signal
- Quick divergence failures = Ignore and wait for next
3. **Timeframe Matters**
- Higher timeframe divergences = More reliable
- Lower timeframe divergences = More frequent, less reliable
#### Smoothing Selection
1. **No Smoothing (None)**
- Most sensitive, more signals
- More noise, more false signals
- Best for: Scalping, very active trading
2. **EMA (Default)**
- Balanced approach
- Good for most strategies
- Best for: Swing trading, day trading
3. **SMMA (RMA)**
- Very smooth, fewer signals
- Less responsive to sudden changes
- Best for: Position trading, longer timeframes
### Indicator Combinations
**With Moving Averages:**
- Use EMAs for trend direction
- OBV for volume confirmation
- Enter when both align
**With RSI:**
- RSI for overbought/oversold
- OBV for volume confirmation
- Divergences on both = Stronger signal
**With Price Action:**
- Support/resistance for levels
- OBV for strength confirmation
- Breakouts with positive OBV = More likely to succeed
**With Bias Indicator:**
- Bias for price deviation
- OBV for volume confirmation
- Both showing divergence = High probability reversal
### Common Patterns
1. **Accumulation**: OBV rising while price consolidates (breakout likely)
2. **Distribution**: OBV falling while price consolidates (breakdown likely)
3. **Confirmation**: OBV and price both making new highs/lows (trend strong)
4. **Divergence**: OBV and price moving opposite directions (reversal warning)
5. **False Breakout**: Price breaks but OBV doesn't confirm (likely to fail)
### Performance Tips
- Disable unused display features for faster loading
- Start with regular divergences only, add hidden later
- Use histogram for quick visual reference
- Enable crossover labels for clear entry signals
- Test different smoothing lengths for your market
### Alert Conditions
The indicator includes alerts for:
- Regular bullish divergence detected
- Regular bearish divergence detected
- Hidden bullish divergence detected
- Hidden bearish divergence detected
**How to Set Alerts:**
1. Click on the indicator name
2. Select "Add Alert"
3. Choose condition
4. Configure notification method
---
## 中文说明文档
### 概述
Scout Regiment - OBV(能量潮)是一个高级动量指标,结合成交量和价格变动来识别买卖压力的强度。该指标采用振荡器方法并具有背离检测功能,帮助交易者发现潜在的趋势反转并确认价格走势。
### 什么是OBV?
能量潮(OBV)是一个累积成交量指标,在上涨日累加成交量,在下跌日减去成交量:
- **上升的OBV**:积累(买入压力)
- **下降的OBV**:派发(卖出压力)
- **OBV振荡器**:OBV与其平滑移动平均线之间的差值,使背离更容易识别
### 核心功能
#### 1. **OBV振荡器显示**
该指标不显示原始OBV值,而是显示振荡器(OBV与其平滑线之间的差值):
**优势:**
- 更容易识别背离
- 趋势变化更清晰
- 对动量变化更敏感
- 零线作为参考点
**视觉元素:**
- **阶梯线**:主OBV振荡器线
- 绿色:正振荡器(积累)
- 红色:负振荡器(派发)
- **柱状图**:振荡器强度的可视化表示
- 绿色柱:零线以上
- 红色柱:零线以下
- **零线**:白色虚线作为参考
#### 2. **平滑选项**
选择多种移动平均类型来平滑OBV:
- **None**:原始OBV(最敏感)
- **SMA**:简单移动平均(等权重)
- **EMA**:指数移动平均(强调近期价格)- 默认
- **SMMA (RMA)**:平滑移动平均(非常平滑)
- **WMA**:加权移动平均(线性权重)
- **VWMA**:成交量加权移动平均(强调成交量)
**默认设置:**
- 类型:EMA
- 长度:21周期
- 适合:大多数市场状况
#### 3. **多时间框架分析**
- 在任何时间框架上计算OBV
- 在低时间框架图表上查看高时间框架动量
- 使交易与更大时间框架的成交量趋势保持一致
- 空字段 = 当前图表时间框架
#### 4. **视觉增强**
**背景颜色**
- 浅绿色:正振荡器(看涨成交量压力)
- 浅红色:负振荡器(看跌成交量压力)
- 可选显示,图表更清爽
**穿越标签**
- "突破":振荡器向上穿越零线
- "跌破":振荡器向下穿越零线
- 指示潜在趋势变化
- 可开关
#### 5. **全面的背离检测**
指标自动检测四种类型的背离:
**常规看涨背离(黄色)**
- **价格**:创新低
- **OBV**:创更高的低点
- **信号**:潜在向上反转
- **标签**:"看涨"
- **用途**:进入多头仓位
**常规看跌背离(蓝色)**
- **价格**:创新高
- **OBV**:创更低的高点
- **信号**:潜在向下反转
- **标签**:"看跌"
- **用途**:进入空头仓位或退出多头
**隐藏看涨背离(浅黄色)**
- **价格**:创更高的低点
- **OBV**:创更低的低点
- **信号**:趋势延续(上升趋势)
- **标签**:"隐藏看涨"
- **用途**:加仓多头
**隐藏看跌背离(浅蓝色)**
- **价格**:创更低的高点
- **OBV**:创更高的高点
- **信号**:趋势延续(下降趋势)
- **标签**:"隐藏看跌"
- **用途**:加仓空头
#### 6. **可自定义的背离检测**
**枢轴回溯设置:**
- **左侧回溯**:枢轴点左侧K线数(默认:5)
- **右侧回溯**:枢轴点右侧K线数(默认:5)
- 决定一个点要多"极端"才能成为枢轴点
**范围设置:**
- **最大范围**:枢轴点之间最大K线数(默认:60)
- **最小范围**:枢轴点之间最小K线数(默认:5)
- 过滤太近或太远的背离
**显示选项:**
- 开关常规背离
- 开关隐藏背离
- 开关背离标签
- 只显示需要的背离
### 配置设置
#### 平滑设置
- **平滑类型**:选择MA类型(None/SMA/EMA/SMMA/WMA/VWMA)
- **平滑长度**:平滑周期数(默认:21)
#### 计算设置
- **时间周期**:选择计算时间框架(空 = 当前图表)
#### 显示设置
- **显示OBV点线**:切换阶梯线显示
- **显示OBV柱状图**:切换柱状图显示
- **显示背景颜色**:切换背景着色
- **显示突破标签**:切换突破/跌破标签
#### 背离设置
- **枢轴右侧回溯**:枢轴检测右侧K线数(默认:5)
- **枢轴左侧回溯**:枢轴检测左侧K线数(默认:5)
- **回看范围最大值**:背离之间最大K线数(默认:60)
- **回看范围最小值**:背离之间最小K线数(默认:5)
- **显示常规背离**:启用/禁用常规背离
- **显示常规背离标签**:启用/禁用常规背离标签
- **显示隐藏背离**:启用/禁用隐藏背离
- **显示隐藏背离标签**:启用/禁用隐藏背离标签
### 使用方法
#### 趋势确认
1. **用价格识别趋势**
- 上升趋势:更高的高点和更高的低点
- 下降趋势:更低的高点和更低的低点
2. **用OBV振荡器确认**
- 强劲上升趋势:OBV振荡器保持正值
- 强劲下降趋势:OBV振荡器保持负值
- 弱势趋势:OBV振荡器频繁穿越零线
3. **成交量确认**
- 趋势伴随上升的OBV = 强趋势
- 趋势伴随下降的OBV = 弱趋势(注意反转)
#### 背离交易
1. **启用背离检测**
- 先从常规背离开始
- 添加隐藏背离用于趋势延续
2. **等待背离信号**
- 黄色标签 = 潜在看涨反转
- 蓝色标签 = 潜在看跌反转
3. **用价格行为确认**
- 等待支撑/阻力突破
- 寻找K线确认
- 检查更高时间框架对齐
4. **进入交易**
- 确认后进入
- 在近期波动之外设置止损
- 基于前一波动或支撑/阻力设定目标
#### 突破交易
1. **启用穿越标签**
- 识别振荡器何时穿越零线
2. **确认成交量强度**
- 强突破有大振荡器移动
- 弱突破勉强穿越零线
3. **交易方向**
- "突破"标签 = 进入多头
- "跌破"标签 = 进入空头
4. **管理仓位**
- 振荡器反向穿越时退出
- 使用价格结构设置止损
#### 多时间框架分析
1. **设置更高时间框架**
- 例如:在15分钟图上,设置时间框架为1H或4H
2. **识别更高时间框架趋势**
- 正振荡器 = 上升趋势偏向
- 负振荡器 = 下降趋势偏向
3. **顺趋势交易**
- 仅在上升趋势中接受多头信号
- 仅在下降趋势中接受空头信号
4. **把握入场时机**
- 使用当前时间框架进行精确进入
- 用更高时间框架方向确认
### 交易策略
#### 策略1:常规背离反转
**设置:**
1. 价格处于强趋势(上涨或下跌)
2. 出现常规背离
3. 价格到达支撑/阻力水平
**入场:**
- 看涨:在"看涨"标签后,价格突破近期高点时
- 看跌:在"看跌"标签后,价格跌破近期低点时
**止损:**
- 看涨:背离低点之下
- 看跌:背离高点之上
**退出:**
- 在下一个主要支撑/阻力获利
- 或出现相反背离时
**适合:**波段交易、反转交易
#### 策略2:隐藏背离延续
**设置:**
1. 建立明确趋势
2. 价格回调(回撤)
3. 出现隐藏背离
**入场:**
- 看涨:在"隐藏看涨"标签后,价格恢复上升趋势时
- 看跌:在"隐藏看跌"标签后,价格恢复下降趋势时
**止损:**
- 在回调波动点之后
**退出:**
- 随着趋势延续移动止损
- 出现常规背离(反转信号)时退出
**适合:**趋势跟随、加仓
#### 策略3:零线穿越
**设置:**
1. 启用穿越标签
2. 振荡器穿越零线
3. 用价格结构突破确认
**入场:**
- "突破"标签 = 买入信号
- "跌破"标签 = 卖出信号
**止损:**
- 近期波动之下/之上
**退出:**
- 振荡器反向穿越零线时
- 或在预定目标
**适合:**动量交易、快速交易
#### 策略4:多时间框架汇合
**设置:**
1. 设置指标到更高时间框架(例如,在1H图上设置4H)
2. 等待更高TF振荡器为正(上升趋势)或负(下降趋势)
3. 在当前时间框架上寻找与更高TF一致的入场机会
**入场:**
- 多头:两个时间框架都显示正振荡器或看涨背离时
- 空头:两个时间框架都显示负振荡器或看跌背离时
**止损:**
- 基于当前时间框架结构
**退出:**
- 更高时间框架振荡器变为负(多头)或正(空头)时
**适合:**波段交易、高概率设置
### 最佳实践
#### 成交量分析
1. **强势波动需要成交量**
- 价格上涨 + 上升的OBV = 健康上升趋势
- 价格上涨 + 下降的OBV = 弱上升趋势(警告)
2. **注意确认**
- 新高伴随新OBV高点 = 已确认
- 新高没有新OBV高点 = 潜在背离
3. **考虑背景**
- 低成交量期(亚洲时段、假期)= 可靠性较低
- 高成交量期(新闻、伦敦/纽约重叠)= 更可靠
#### 背离交易技巧
1. **不是所有背离都有效**
- 等待价格确认
- 在超卖/超买区域更强
- 在支撑/阻力水平更好
2. **多重背离**
- 同一趋势上多个背离 = 更强信号
- 背离快速失败 = 忽略并等待下一个
3. **时间框架重要**
- 更高时间框架背离 = 更可靠
- 更低时间框架背离 = 更频繁,可靠性较低
#### 平滑选择
1. **无平滑(None)**
- 最敏感,更多信号
- 更多噪音,更多假信号
- 适合:剥头皮、非常活跃的交易
2. **EMA(默认)**
- 平衡方法
- 适合大多数策略
- 适合:波段交易、日内交易
3. **SMMA (RMA)**
- 非常平滑,更少信号
- 对突然变化响应较慢
- 适合:仓位交易、更长时间框架
### 指标组合
**与移动平均线配合:**
- 使用EMA确定趋势方向
- OBV确认成交量
- 两者一致时进入
**与RSI配合:**
- RSI用于超买超卖
- OBV用于成交量确认
- 两者都背离 = 更强信号
**与价格行为配合:**
- 支撑/阻力确定水平
- OBV确认强度
- 正OBV的突破 = 更可能成功
**与Bias指标配合:**
- Bias用于价格偏离
- OBV用于成交量确认
- 两者都显示背离 = 高概率反转
### 常见形态
1. **积累**:OBV上升而价格盘整(突破可能)
2. **派发**:OBV下降而价格盘整(跌破可能)
3. **确认**:OBV和价格都创新高/新低(趋势强劲)
4. **背离**:OBV和价格反向移动(反转警告)
5. **假突破**:价格突破但OBV不确认(可能失败)
### 性能提示
- 禁用未使用的显示功能以加快加载
- 先从常规背离开始,稍后添加隐藏背离
- 使用柱状图快速视觉参考
- 启用穿越标签以获得清晰的入场信号
- 为您的市场测试不同的平滑长度
### 警报条件
指标包含以下警报:
- 检测到常规看涨背离
- 检测到常规看跌背离
- 检测到隐藏看涨背离
- 检测到隐藏看跌背离
**如何设置警报:**
1. 点击指标名称
2. 选择"添加警报"
3. 选择条件
4. 配置通知方法
---
## Technical Support
For questions or issues, please refer to the TradingView community or contact the indicator creator.
## 技术支持
如有问题,请参考TradingView社区或联系指标创建者。

CandelaCharts - Trend Oscillator 📝 Overview
Trend Oscillator is a simple yet effective trend identification tool that uses the relationship between two exponential moving averages (EMAs) to determine market direction. It calculates the spread between a fast and slow EMA, applies a bias multiplier, and smooths the result to produce a clean oscillator that oscillates above and below a zero line. When the oscillator is above zero, the trend is considered bullish (upward); when below zero, it's bearish (downward). The indicator provides clear visual feedback through color-coded plots and optional price bar coloring, making it easy to identify trend direction at a glance.
📦 Features
This section highlights the core capabilities you'll rely on most.
Dual EMA system — Uses a fast EMA (default 9) and slow EMA (default 21) to capture trend momentum and direction.
Bias multiplier — Applies a small multiplier (default 1.001) to the EMA spread, providing a slight bias that helps filter noise and confirm trend strength.
Smoothed output — Applies an additional EMA smoothing (default 5 periods) to the raw spread, creating a cleaner, less choppy oscillator line.
Zero-line reference — Plots a horizontal zero line that serves as the critical threshold between bullish and bearish conditions.
Color-coded visualization — Automatically colors the oscillator line green/lime when bullish (above zero) and red when bearish (below zero).
Price bar coloring — Optional feature to color price bars based on the current trend direction, providing immediate visual context on the main chart.
Customizable parameters — Adjust EMA lengths, bias multiplier, smoothing period, and colors to match your trading style and timeframe.
⚙️ Settings
Use these controls to fine-tune the oscillator's sensitivity, appearance, and behavior.
Fast EMA Length — Period for the fast exponential moving average (default: 9). Lower values make the indicator more responsive to price changes.
Slow EMA Length — Period for the slow exponential moving average (default: 21). Higher values create a smoother baseline for trend identification.
Bias Multiplier — Multiplier applied to the EMA spread (default: 1.001). Small adjustments can help filter minor whipsaws and confirm trend strength.
Smoothing Length — Period for smoothing the raw spread calculation (default: 5). Higher values create a smoother oscillator line but may lag price action.
Colors — Set the bullish (default: lime) and bearish (default: red) colors for the oscillator line.
Color Price Bars — Toggle to enable/disable coloring of price bars based on the current trend direction.
⚡️ Showcase
Oscillator Line
Bar Coloring
Divergences
📒 Usage
Follow these steps to effectively use Trend Oscillator for trend identification and trading decisions.
1) Select your timeframe — The indicator works across all timeframes, but higher timeframes (daily, weekly, monthly) typically provide more reliable trend signals with less noise. Lower timeframes (1m, 5m, 15m) may produce more frequent but potentially less reliable signals. Consider your trading style: swing traders benefit from daily/weekly charts, while day traders can use 15m/1h timeframes. Always align the indicator's sensitivity with your timeframe choice.
2) Adjust EMA lengths — The default 9/21 combination works well for most cases. For faster signals, try 5/13; for slower, more conservative signals, try 12/26 or 20/50. Match the lengths to your trading style and timeframe.
3) Interpret the zero line — When the oscillator is above zero (green/lime), the trend is bullish. When below zero (red), the trend is bearish. The further from zero, the stronger the trend.
4) Watch for crossovers — Trend changes occur when the oscillator crosses the zero line. A cross from below to above indicates a shift to bullish; from above to below indicates a shift to bearish.
5) Identify divergences — Divergences can signal potential trend reversals. Bullish divergence : price makes lower lows while the oscillator makes higher lows (suggests weakening bearish momentum). Bearish divergence : price makes higher highs while the oscillator makes lower highs (suggests weakening bullish momentum). Divergences are most reliable when they occur near extreme levels and should be confirmed with price action before taking trades.
6) Use smoothing wisely — The smoothing parameter helps reduce noise but adds lag. Lower smoothing (3-5) is more responsive; higher smoothing (7-10) is more stable but slower to react.
7) Combine with price action — Use the oscillator to confirm trend direction, then look for entry opportunities when price pulls back in the direction of the trend. The optional price bar coloring helps visualize trend alignment on the main chart.
8) Filter with bias multiplier — The bias multiplier can help reduce false signals. Experiment with values between 1.000 and 1.005 to find the sweet spot for your instrument and timeframe.
🚨 Alerts
There are no built-in alerts in this version.
⚠️ Disclaimer
Trading involves significant risk, and many participants may incur losses. The content on this site is not intended as financial advice and should not be interpreted as such. Decisions to buy, sell, hold, or trade securities, commodities, or other financial instruments carry inherent risks and are best made with guidance from qualified financial professionals. Past performance is not indicative of future results.

Trend Meter [MMT]The Trend Meter is a dynamic Pine Script indicator designed to provide traders with a clear, multi-dimensional view of market trends and momentum across different timeframes and metrics. By integrating Exponential Moving Averages (EMAs), Volume-Weighted Average Price (VWAP), higher timeframe (HTF) analysis, and Regular Trading Hours (RTH) breakouts, this indicator offers a comprehensive tool for identifying bullish, bearish, or neutral market conditions. Its customizable visual display and label system make it ideal for traders seeking actionable insights for trend-following, breakout, or reversal strategies.
Key Features:
1. Multi-Metric Trend Analysis:
- Trend Meter : Compares a Fast EMA (default: 9) and Slow EMA (default: 21) to determine short-term trend direction.
- Bias Meter : Uses a longer-term Bias EMA (default: 35) to assess the overall market bias based on the close price.
- VWAP Meter : Evaluates price position relative to the VWAP for dynamic support/resistance insights.
- HTF Meter : Analyzes higher timeframe (default: 60-minute) price action, detecting breakouts of previous highs/lows and candle direction.
- RTH Meter : Tracks price breakouts above/below the US Regular Trading Hours (09:30–16:00 EST) 15m opening range (09:30–09:45 EST).
2. Color-Coded Visuals:
- Each metric is displayed as a horizontal line with customizable colors (green for bullish, red for bearish, gray for neutral).
- Visual style options (dotted, dashed, or solid lines) allow for personalized chart clarity.
3. Dynamic Labels:
- Optional labels for each metric (Trend, Bias, VWAP, HTF, RTH) with customizable text, size (tiny to huge), and color.
- Labels update in real-time, providing clear identification of each meter’s role and current state.
4. Flexible Metric Selection:
- Toggle individual metrics (EMA, VWAP, HTF, RTH) on/off to focus on relevant indicators for your trading style.
- Option to use the previous bar’s close price for calculations, reducing noise in volatile markets.
5. RTH and Opening Range Analysis:
- Calculates the high/low of the opening range (09:30–09:45 EST) during RTH sessions.
- Signals bullish or bearish conditions when the price breaks above/below the opening range outside the initial 15-minute window.
6. Higher Timeframe Breakout Detection:
- Monitors HTF price action to identify breakouts of the previous candle’s high or low, combined with the HTF candle’s direction for trend confirmation.
How to Use:
- Trend Confirmation : Use the Trend and Bias Meters to confirm short-term and long-term market direction.
- Breakout Trading : Leverage the RTH Meter for breakout setups above/below the opening range during US trading hours.
- Support/Resistance : Utilize the VWAP Meter to identify dynamic price levels for entries or exits.
- Higher Timeframe Context : Monitor the HTF Meter for broader market trend alignment, ideal for swing or position trading.
- Customization : Adjust EMA lengths, toggle metrics, and customize visual styles and labels to suit your chart preferences.
Settings:
- Bias Settings :
- Fast EMA (default: 9), Slow EMA (default: 21), Bias EMA (default: 35).
- Higher Timeframe (default: 60-minute).
- Option to use previous close price for calculations.
- Enable/disable individual metrics (EMA, VWAP, HTF, RTH).
- Visual Settings :
- Bullish (green), bearish (red), and neutral (gray) colors.
- Line style (dotted, dashed, solid).
- Label Settings :
- Enable/disable labels.
- Customize label size (tiny, small, normal, large, huge) and text color.
- Custom text for each meter’s label (Trend, Bias, VWAP, HTF, RTH).
Notes:
- Optimized for intraday trading (e.g., 1m, 5m, 15m) but adaptable to any timeframe.
- RTH and opening range calculations are tailored for US markets (EST timezone); adjust session times in the code for other markets.
- Higher timeframe analysis enhances context for multi-timeframe strategies.
Ideal For:
- Intraday traders targeting RTH breakout opportunities.
- Swing traders aligning with higher timeframe trends.
- Traders using VWAP and EMA-based strategies for trend and momentum analysis.
- Those seeking a clean, customizable dashboard for multi-metric market analysis.

BB SPY Mean Reversion Investment StrategySummary
Mean reversion first, continuation second. This strategy targets equities and ETFs on daily timeframes. It waits for price to revert from a Bollinger location with candle and EMA agreement, then manages risk with ATR based exits. Uniqueness comes from two elements working together. One, an adaptive band multiplier driven by volatility of volatility that expands or contracts the envelope as conditions change. Two, a bias memory that re arms the same direction after any stop, target, or time exit until a true opposite signal appears. Add it to a clean chart, use the markers and levels, and select on bar close for conservative alerts. Shapes can move while the bar is open and settle on close.
Scope and intent
• Markets. Currently adapted for SPY, needs to be optimized for other assets
• Timeframes. Daily primary. Other frames are possible but not the default
• Default demo. SPY on daily
• Purpose. Trade mean reversion entries that can chain into a longer swing by splitting holds into ATR or time segments
Originality and usefulness
• Novelty. Adaptive band width from volatility of volatility plus a persistent bias array that keeps the original direction alive across sequential entries until an opposite setup is confirmed
• Failure modes mitigated. False starts in chop are reduced by candle color and EMA location. Missed continuation after a take profit or stop is addressed by the re arm engine. Oversized envelopes during quiet regimes are avoided by the adaptive multiplier
• Testability. Every module has Inputs and visible levels so users can see why a suggestion appears
• Portable yardstick. All risk and targets are expressed in ATR units
Method overview in plain language
The engine measures where price sits relative to Bollinger bands, confirms with candle color and EMA location, requires ADX for shorts(in our case long close since we use it currently as long only), and optionally requires a trend or mean reversion regime using band width percent rank and basis slope. Risk uses ATR for stop, target, and optional breakeven. A small array stores the last confirmed direction. While flat, the engine keeps a pending order in that direction. The array flips only when a true opposite setup appears.
Base measures
• Range basis. True Range smoothed over a user defined ATR Length
• Return basis. Not required
Components
• Bollinger envelope. SMA length and standard deviation multiplier. Entry is based on cross of close through the band with location bias
• Candle and EMA filter. Close relative to open and close relative to EMA align direction
• ADX gate for shorts. Requires minimum trend strength for short trades
• Adaptive multiplier. Band width scales using volatility of volatility so envelopes breathe with conditions
• Regime gate optional. Band width percent rank and basis slope identify trend or mean reversion regimes
• Risk manager. ATR stop, ATR target, optional breakeven, optional time exit
• Bias memory. Array stores last confirmed direction and re arms entries while flat
Fusion rule
Minimum satisfied gates count style. All required gates must be true. Optional gates are controlled in Inputs. Bias memory never overrides an opposite confirmed setup.
Signal rule
• Long setup when close crosses up through the lower band, the bar closes green, and close is above the long EMA
• Short setup when close crosses down through the upper band, the bar closes red, close is below the short EMA, and ADX is above the minimum
• While flat the model keeps a pending order in the stored direction until a true opposite setup appears
• IN LONG or IN SHORT describes states between entry and exit
What you will see on the chart
• Markers for Long and Short setups
• Exit markers from ATR or time rules
• Reference levels for entry, stop, and target
• Bollinger bands and optional adaptive bands
Inputs with guidance
Setup
• Signal timeframe. Uses the chart timeframe
• Invert direction optional. Flips long and short
Logic
• BB Length. Typical 10 to 50. Higher smooths more
• BB Mult. Typical 1.0 to 2.5. Higher widens entries
• EMA Length long. Typical 10 to 50
• EMA Length short. Typical 5 to 30
• ADX Minimum for short. Typical 15 to 35
Filters
• Regime Type. none or trend or mean reversion
• Rank Lookback. Typical 100 to 300
• Basis Slope Length and Threshold. Larger values reduce false trends
Risk
• ATR Length. Typical 10 to 21
• ATR Stop Mult. Typical 1.0 to 3.0
• ATR Take Profit Mult. Typical 2.0 to 5.0
• Breakeven Trigger R. Move stop to entry after the chosen multiple
• Time Exit. Minimum bars and extension when profit exceeds a fraction of ATR
Bias and rearm
• Bias flips kept. Array depth
• Keep rearm when flat. Maintain a pending order while flat
UI
• Show markers and levels. Clean defaults
Usage recipes
Alerts update in real time and can change while the bar forms. Select on bar close for conservative workflows.
Properties visible in this publication
• Initial capital 25000
• Base currency USD
• If any higher timeframe calls are enabled, request.security uses lookahead off
• Commission 0.03 percent
• Slippage 3 ticks
• Default order size method Percent of equity with value 5
• Pyramiding 0
• Process orders on close On
• Bar magnifier Off
• Recalculate after order is filled Off
• Calc on every tick Off
Realism and responsible publication
No performance claims. Costs and fills vary by venue. Shapes can move intrabar and settle on close. Strategies use standard candles only.
Honest limitations and failure modes
High impact releases and thin liquidity can break assumptions. Gap heavy symbols may require larger ATR. Very quiet regimes can reduce contrast in the mean reversion signal. If stop and target can both be touched inside one bar, outcome follows the TradingView order model for that bar path.
Regimes with extreme one sided trend and very low volatility can reduce mean reversion edges. Results vary by symbol and venue. Past results never guarantee future outcomes.
Open source reuse and credits
None.
Backtest realism
Costs are realistic for liquid equities. Sizing does not exceed five percent per trade by default. Any departure should be justified by the user.
If you got any questions please le me know

Smart Money Flow Index (SMFI) - Advanced SMC [PhenLabs]📊Smart Money Flow Index (SMFI)
Version: PineScript™v6
📌Description
The Smart Money Flow Index (SMFI) is an advanced Smart Money Concepts implementation that tracks institutional trading behavior through multi-dimensional analysis. This comprehensive indicator combines volume-validated Order Block detection, Fair Value Gap identification with auto-mitigation tracking, dynamic Liquidity Zone mapping, and Break of Structure/Change of Character detection into a unified system.
Unlike basic SMC indicators, SMFI employs a proprietary scoring algorithm that weighs five critical factors: Order Block strength (validated by volume), Fair Value Gap size and recency, proximity to Liquidity Zones, market structure alignment (BOS/CHoCH), and multi-timeframe confluence. This produces a Smart Money Score (0-100) where readings above 70 represent optimal institutional setup conditions.
🚀Points of Innovation
Volume-Validated Order Block Detection – Only displays Order Blocks when formation candle exceeds customizable volume multiplier (default 1.5x average), filtering weak zones and highlighting true institutional accumulation/distribution
Auto-Mitigation Tracking System – Fair Value Gaps and Order Blocks automatically update status when price mitigates them, with visual distinction between active and filled zones preventing trades on dead levels
Proprietary Smart Money Score Algorithm – Combines weighted factors (OB strength 25%, FVG proximity 20%, Liquidity 20%, Structure 20%, MTF 15%) into single 0-100 confidence rating updating in real-time
ATR-Based Adaptive Calculations – All distance measurements use 14-period Average True Range ensuring consistent function across any instrument, timeframe, or volatility regime without manual recalibration
Dynamic Age Filtering – Automatically removes liquidity levels and FVGs older than configurable thresholds preventing chart clutter while maintaining relevant levels
Multi-Timeframe Confluence Integration – Analyzes higher timeframe bias with customizable multipliers (2-10x) and incorporates HTF trend direction into Smart Money Score for institutional alignment
🔧Core Components
Order Block Engine – Detects institutional supply/demand zones using characteristic patterns (down-move-then-strong-up for bullish, up-move-then-strong-down for bearish) with minimum volume threshold validation, tracks mitigation when price closes through zones
Fair Value Gap Scanner – Identifies price imbalances where current candle's low/high leaves gap with two-candle-prior high/low, filters by minimum size percentage, monitors 50% fill for mitigation status
Liquidity Zone Mapper – Uses pivot high/low detection with configurable lookback to mark swing points where stop losses cluster, extends horizontal lines to visualize sweep targets, manages lifecycle through age-based removal
Market Structure Analyzer – Tracks pivot progression to identify trend through higher-highs/higher-lows (bullish) or lower-highs/lower-lows (bearish), detects Break of Structure and Change of Character for trend/reversal confirmation
Scoring Calculation Engine – Evaluates proximity to nearest Order Blocks using ATR-normalized distance, assesses FVG recency and distance, calculates liquidity proximity with age weighting, combines structure bias and MTF trend into smoothed final score
🔥Key Features
Customizable Display Limits – Control maximum Order Blocks (1-10), Liquidity Zones (1-10), and FVG age (10-200 bars) to maintain clean charts focused on most relevant institutional levels
Gradient Strength Visualization – All zones render with transparency-adjustable coloring where stronger/newer zones appear more solid and weaker/older zones fade progressively providing instant visual hierarchy
Educational Label System – Optional labels identify each zone type (Bullish OB, Bearish OB, Bullish FVG, Bearish FVG, BOS) with color-coded text helping traders learn SMC concepts through practical application
Real-Time Smart Money Score Dashboard – Top-right table displays current score (0-100) with color coding (green >70, yellow 30-70, red <30) plus trend arrow for at-a-glance confidence assessment
Comprehensive Alert Suite – Configurable notifications for Order Block formation, Fair Value Gap detection, Break of Structure events, Change of Character signals, and high Smart Money Score readings (>70)
Buy/Sell Signal Integration – Automatically plots triangle markers when Smart Money Score exceeds 70 with aligned market structure and fresh Order Block detection providing clear entry signals
🎨Visualization
Order Block Boxes – Shaded rectangles extend from formation bar spanning high-to-low of institutional candle, bullish zones in green, bearish in red, with customizable transparency (80-98%)
Fair Value Gap Zones – Rectangular areas marking imbalances, active FVGs display in bright colors with adjustable transparency, mitigated FVGs switch to gray preventing trades on filled zones
Liquidity Level Lines – Dashed horizontal lines extend from pivot creation points, swing highs in bearish color (short targets above), swing lows in bullish color (long targets below), opacity decreases with age
Structure Labels – "BOS" labels appear above/below price when Break of Structure confirmed, colored by direction (green bullish, red bearish), positioned at 1% beyond highs/lows for visibility
Educational Info Panel – Bottom-right table explains key terminology (OB, FVG, BOS, CHoCH) and score interpretation (>70 high probability) with semi-transparent background for readability
📖Usage Guidelines
General Settings
Show Order Blocks – Default: On, toggles visibility of institutional supply/demand zones, disable when focusing solely on FVGs or Liquidity
Show Fair Value Gaps – Default: On, controls FVG zone display including active and mitigated imbalances
Show Liquidity Zones – Default: On, manages liquidity line visibility, disable on lower timeframes to reduce clutter
Show Market Structure – Default: On, toggles BOS/CHoCH label display
Show Smart Money Score – Default: On, controls score dashboard visibility
Order Block Settings
OB Lookback Period – Default: 20, Range: 5-100, controls bars scanned for Order Block patterns, lower values detect recent activity, higher values find older blocks
Min Volume Multiplier – Default: 1.5, Range: 1.0-5.0, sets minimum volume threshold as multiple of 20-period average, higher values (2.0+) filter for strongest institutional candles
Max Order Blocks to Display – Default: 3, Range: 1-10, limits simultaneous Order Blocks shown, lower settings (1-3) maintain focus on most recent zones
Fair Value Gap Settings
Min FVG Size (%) – Default: 0.3, Range: 0.1-2.0, defines minimum gap size as percentage of close price, lower values detect micro-imbalances, higher values focus on significant gaps
Max FVG Age (bars) – Default: 50, Range: 10-200, removes FVGs older than specified bars, lower settings (10-30) for scalping, higher (100-200) for swing trading
Show FVG Mitigation – Default: On, displays filled FVGs in gray providing visual history, disable to show only active untouched imbalances
Liquidity Zone Settings
Liquidity Lookback – Default: 50, Range: 20-200, sets pivot detection period for swing highs/lows, lower values (20-50) mark shorter-term liquidity, higher (100-200) identify major swings
Max Liquidity Age (bars) – Default: 100, Range: 20-500, removes liquidity lines older than specified bars, adjust based on timeframe
Liquidity Sensitivity – Default: 0.5, Range: 0.1-1.0, controls pivot detection sensitivity, lower values mark only major swings, higher values identify minor swings
Max Liquidity Zones to Display – Default: 3, Range: 1-10, limits total liquidity levels shown maintaining chart clarity
Market Structure Settings
Pivot Length – Default: 5, Range: 3-15, defines bars to left/right for pivot validation, lower values (3-5) create sensitive structure breaks, higher (10-15) filter for major shifts
Min Structure Move (%) – Default: 1.0, Range: 0.1-5.0, sets minimum percentage move required between pivots to confirm structure change
Multi-Timeframe Settings
Enable MTF Analysis – Default: On, activates higher timeframe trend analysis incorporation into Smart Money Score
Higher Timeframe Multiplier – Default: 4, Range: 2-10, multiplies current timeframe to determine analysis timeframe (4x on 15min = 1hour)
Visual Settings
Bullish Color – Default: Green (#089981), sets color for bullish Order Blocks, FVGs, and structure elements
Bearish Color – Default: Red (#f23645), defines color for bearish elements
Neutral Color – Default: Gray (#787b86), controls color of mitigated zones and neutral elements
Show Educational Labels – Default: On, displays text labels on zones identifying type (OB, FVG, BOS), disable once familiar with patterns
Order Block Transparency – Default: 92, Range: 80-98, controls Order Block box transparency
FVG Transparency – Default: 92, Range: 80-98, sets Fair Value Gap zone transparency independently from Order Blocks
Alert Settings
Alert on Order Block Formation – Default: On, triggers notification when new volume-validated Order Block detected
Alert on FVG Formation – Default: On, sends alert when Fair Value Gap appears enabling quick response to imbalances
Alert on Break of Structure – Default: On, notifies when BOS or CHoCH confirmed
Alert on High Smart Money Score – Default: On, alerts when Smart Money Score crosses above 70 threshold indicating high-probability setup
✅Best Use Cases
Order Block Retest Entries – After Break of Structure, wait for price retrace into fresh bullish Order Block with Smart Money Score >70, enter long on zone reaction targeting next liquidity level
Fair Value Gap Retracement Trading – When price creates FVG during strong move then retraces, enter as price approaches unfilled gap expecting institutional orders to continue trend
Liquidity Sweep Reversals – Monitor price approaching swing high/low liquidity zones against prevailing Smart Money Score trend, after stop hunt sweep watch for rejection into premium Order Block/FVG
Multi-Timeframe Confluence Setups – Identify alignment when current timeframe Order Block coincides with higher timeframe FVG plus MTF analysis showing matching trend bias
Break of Structure Continuations – After BOS confirms trend direction, trade pullbacks to nearest Order Block or FVG in direction of structure break using Smart Money Score >70 as entry filter
Change of Character Reversal Plays – When CHoCH detected indicating potential reversal, look for Smart Money Score pivot with opposing Order Block formation then enter on structure confirmation
⚠️Limitations
Lagging Pivot Calculations – Pivot-based features (Liquidity Zones, Market Structure) require bars to right of pivot for confirmation, meaning these elements identify levels retrospectively with delay equal to lookback period
Whipsaw in Ranging Markets – During choppy conditions, Order Blocks fail frequently and structure breaks produce false signals as Smart Money Score fluctuates without clear institutional bias, best used in trending markets
Volume Data Dependency – Order Block volume validation requires accurate volume data which may be incomplete on Forex pairs or limited in crypto exchange feeds
Subjectivity in Scoring Weights – Proprietary 25-20-20-20-15 weighting reflects general institutional behavior but may not optimize for specific instruments or market regimes, user cannot adjust factor weights
Visual Complexity on Lower Timeframes – Sub-hour timeframes generate excessive zones creating cluttered charts, requires aggressive display limit reduction and higher minimum thresholds
No Fundamental Integration – Indicator analyzes purely technical price action and volume without incorporating economic events, news catalysts, or fundamental shifts that override technical levels
💡What Makes This Unique
Unified SMC Ecosystem – Unlike indicators displaying Order Blocks OR FVGs OR Liquidity separately, SMFI combines all three institutional concepts plus market structure into single cohesive system
Proprietary Confidence Scoring – Rather than manual setup assessment, automated Smart Money Score quantifies probability by weighting five institutional dimensions into actionable 0-100 rating
Volume-Filtered Quality – Eliminates weak Order Blocks forming without institutional volume confirmation, ensuring displayed zones represent genuine accumulation/distribution
Adaptive Lifecycle Management – Automatically updates mitigation status and removes aged zones preventing trades on dead levels through continuous validity and age monitoring
Educational Integration – Built-in tooltips, labeled zones, and reference panel make indicator functional for both learning Smart Money Concepts and executing strategies
🔬How It Works
Order Block Detection – Scans for patterns where strong directional move follows counter-move creating last down-candle before rally (bullish OB) or last up-candle before sell-off (bearish OB), validates formations only when candle exhibits volume exceeding configurable multiple (default 1.5x) of 20-bar average volume
Fair Value Gap Identification – Compares current candle’s high/low against two-candles-prior low/high to detect price imbalances, calculates gap size as percentage of close and filters micro-gaps below minimum threshold (default 0.3%), monitors whether subsequent price fills 50% triggering mitigation status
Liquidity Zone Mapping – Employs pivot detection using configurable lookback (default 50 bars) to identify swing highs/lows where retail stops cluster, extends horizontal reference lines from pivot creation and applies age-based filtering to remove stale zones
Market Structure Analysis – Tracks pivot progression using structure-specific lookback (default 5 bars) to determine trend, confirms uptrend when new pivot high exceeds previous by minimum move percentage, detects Break of Structure when price breaks recent pivot level, flags Change of Character for potential reversals
Multi-Timeframe Confluence – When enabled, requests security data from higher timeframe (current TF × HTF multiplier, default 4x), compares HTF close against HTF 20-period MA to determine bias, contributes ±50 points to score ensuring alignment with institutional positioning on superior timeframe
Smart Money Score Calculation – Evaluates Order Block component via ATR-normalized distance producing max 100-point contribution weighted at 25%, assesses FVG factor through age penalty and distance at 20% weight, calculates Liquidity proximity at 20%, incorporates structure bias (±50-100 points) at 20%, adds MTF component at 15%, applies 3-period smoothing to reduce volatility
Visual Rendering and Lifecycle – Draws Order Block boxes, Fair Value Gap rectangles with color coding (green/red active, gray mitigated), extends liquidity dashed lines with fade-by-age opacity, plots BOS labels, displays Smart Money Score dashboard, continuously updates checking mitigation conditions and removing elements exceeding age/display limits
💡Note:
The Smart Money Flow Index combines multiple Smart Money Concepts into unified institutional order flow analysis. For optimal results, use the Smart Money Score as confluence filter rather than standalone entry signal – scores above 70 indicate high-probability setups but should be combined with risk management, higher timeframe bias, and market regime understanding.

Directional Volume Cloud MTFThe Directional Volume Cloud MTF transforms raw volume into a visually intuitive cloud histogram that highlights directional bias and exhaustion zones.
🔍 Core Logic
- Volume bias is calculated using candle direction (bullish/bearish) and smoothed via EMA.
- Bias strength is normalized against average volume to produce a ratio from -1 to +1.
- Color and opacity dynamically reflect bias direction and strength — pale clouds indicate weak volume, while vivid clouds signal strong conviction.
Features
- Customizable bullish/bearish colors
- Dynamic opacity based on volume strength
- Declining volume signals for potential reversals
- Multi-timeframe bias overlay (e.g., daily bias on intraday chart)
📈 Use Cases
- Spot volume exhaustion before reversals
- Confirm breakout strength with bias intensity
- Compare short-term vs long-term volume pressure
Whether you're scalping intraday moves or validating swing setups, this cloud-based volume heatmap offers a clean, modular way to visualize market conviction.

USD Session 8FX - LDN & NY (TF-invariant, Live + Table)What it is
A USD strength/weakness meter for the London (08:00–08:45) or New York (15:30–16:00/16:15) session. It blends the movement of 8 markets—EURUSD, GBPUSD, AUDUSD, NZDUSD, USDCHF, USDCAD, USDJPY, XAUUSD—into one Score that is timeframe-invariant (it uses a 1-minute “boundary TF” under the hood so changing chart TF doesn’t change the math).
Core logic (simple)
During the chosen session window, it records each symbol’s start and live end prices, computes returns, optionally normalizes by ATR (volatility), applies your weights, and averages anti-USD (EUR/GBP/AUD/NZD/XAU) vs USD-base (CHF/CAD/JPY) groups.
The final Score is the normalized sum of weighted contributions:
Score > 0 → “USD Strong”
Score < 0 → “USD Weak”
At the session close it freezes (“Locked”) the results so you can review them later.
What you see
Main plot: the USD Score line (with a 0 baseline).
Optional lines: Anti-USD average vs USD-base average (post-normalization, pre-weights).
Session background shading (London silver, New York aqua).
Live table with:
Each symbol’s % change, its weight, and its contribution to the Score.
TOP badges for the two biggest drivers (by absolute contribution).
A Side column (only for the two TOPs) showing BUY/SELL aligned with the USD verdict (e.g., if USD Strong → SELL anti-USD pairs like EURUSD, BUY USD-base like USDCHF).
Verdict row with USD Strong/Weak, the Score value, the window text, and whether you’re LIVE / CLOSED / FROZEN.
Trade Gate panel:
Shows Verdict (USD Strong/Weak), Bias OK/weak (|Score| vs your threshold), Top-1/Top-2 VWAP checks, an overall GATE: OK/NO, and an Entry hint string (e.g., “SELL EURUSD, BUY USDCHF”) when conditions align.
VWAP “Trade Gate”
It confirms alignment between the USD bias and price vs VWAP for the top movers:
If USD Strong: anti-USD symbols should be below VWAP (short bias), USD-base symbols above VWAP (long bias).
If USD Weak: the opposite.
Gate = OK only if |Score| ≥ minAbsScore and at least one of the two TOP symbols is on the correct side of VWAP.
Tip: set vwapTF to an intraday value (“1”, “5”, “15”) for reliable VWAP on higher-TF charts.
Alerts
At session close: “USD Strong/Weak – session close”.
Live threshold: alerts when |Score| crosses your intraday threshold up/down.
Entry hint (Gate OK): triggers when the Gate flips from NO → OK inside the window.
If you create an alert of type “Any alert() function call”, you also get a dynamic message like:
ENTRY HINT • Hint: SELL EURUSD, BUY USDCHF
Key inputs you can tweak
Session: London vs New York; NY end time 16:00 or 16:15.
Timezone: default Europe/Tirane.
Boundary TF: default “1” (keeps the indicator TF-invariant).
minAbsScore: sensitivity threshold for “Bias OK”.
ATR normalization (len): stabilizes comparisons across different volatility regimes.
VWAP settings: toggle panel and set vwapTF.
How to use (playbook)
Choose the session (e.g., New York 15:30–16:15), keep Boundary TF = 1.
If you’re on a higher-TF chart, set vwapTF = "1" or "5".
Watch Score and Verdict; when |Score| ≥ minAbsScore, bias is meaningful.
Check Top-1/Top-2 and the Trade Gate:
If Gate = OK, use the Entry hint (e.g., “SELL EURUSD, BUY USDCHF”) as the aligned idea.
Use your own execution rules (e.g., structure, risk, stops) on the suggested symbols.
After close, review the Frozen table to validate behavior and refine thresholds/weights.
Notes & edge cases
If some markets are illiquid/holiday, a few returns may be na; the script handles that gracefully.
If ta.vwap is na on high TFs, the Gate will simply not confirm—set vwapTF intraday.
You can customize weights (e.g., reduce XAUUSD to -0.3 or similar) to suit your basket philosophy.
If you want, I can add toggles to show Side for all 8 symbols, or print a one-line summary (e.g., “USD Strong • Score 0.23 • Gate OK • SELL EURUSD, BUY USDCHF”) in the top-left of the pane.

Long/Short Ratio Aggregated (Lite)Description — Long/Short Ratio Aggregated (Lite)
This indicator provides a cross-exchange, open-interest-weighted aggregation of the Long/Short Ratio (LSR) for the cryptocurrency asset currently on your chart. It is designed to unify fragmented derivatives positioning data from multiple major exchanges into a single normalized signal that more accurately reflects real market sentiment and positioning bias across platforms.
Concept and Originality
Traditional Long/Short Ratio indicators are exchange-specific. They show how many traders are long versus short, but only within the scope of one venue (e.g., Binance or Bybit). This makes them incomplete and often misleading for directional bias analysis, since different exchanges host different participant profiles, levels of leverage, and quote-currency exposures.
This script addresses that limitation by:
Aggregating LSR data across multiple exchanges (Binance and Bybit).
Weighting each ratio by Open Interest (OI) — ensuring exchanges with higher open positions contribute proportionally more to the overall sentiment.
Normalizing all contract types (USDT, USDC, and USD-margined) into a consistent base-currency format.
This step corrects for structural differences between coin- and stablecoin-margined instruments, producing a true like-for-like comparison.
The result is a globalized Long/Short Ratio, normalized by exposure and liquidity, suitable for multi-venue orderflow estimation and directional bias assessment.
Note for moderators: I know there are already other scripts out there, but they may not support Open Interest Weighting or the same number of pairs. They also might not support proper normalization like in my script.
Calculation Methodology
For each supported exchange and contract type:
The script retrieves the latest Long/Short Ratio (LSR) and Open Interest (OI) values.
OI is used as the weighting factor, creating a proportional representation of positioning volume.
Values denominated in USD are normalized into base currency using close-price adjustment.
The final value is computed as:
Weighted LSR = (Σ (LSRᵢ × OIᵢ)) / (Σ OIᵢ)
This ensures that if, for example, Binance has twice the open interest of Bybit, its LSR contributes twice as much to the total weighted sentiment.
Interpretation
Value > 1.0 → Market participants are net-long (bullish bias).
Value < 1.0 → Market participants are net-short (bearish bias).
Strength of deviation from 1.0 indicates positioning imbalance magnitude.
Because the ratio is OI-weighted, large players or heavily margined exchanges influence the output proportionally more than smaller, low-volume venues — making this metric a better reflection of true market positioning rather than isolated retail sentiment.
Usage and Applications
Use this indicator as a component in:
Orderflow and sentiment confirmation, alongside price action and volume.
Funding rate correlation studies.
Intraday reversals or exhaustion zones, when combined with volatility or OI delta metrics.
Overlaying or combining this indicator with open interest change, cumulative volume delta, or funding rate divergence allows traders to build a high-resolution understanding of positioning shifts and crowd behavior.
Notes
The “Lite” version is optimized for execution and accessibility, focusing on accuracy while staying within Pine Script’s computational limits.
Exchange data availability may vary by symbol; unsupported pairs automatically return na and are automatically not included in the weighted calculation.
In summary:
This indicator transforms fragmented, exchange-specific Long/Short Ratio into a unified, OI-weighted global sentiment measure — a foundational tool for traders seeking to quantify derivative-side orderflow bias with cross-venue accuracy.
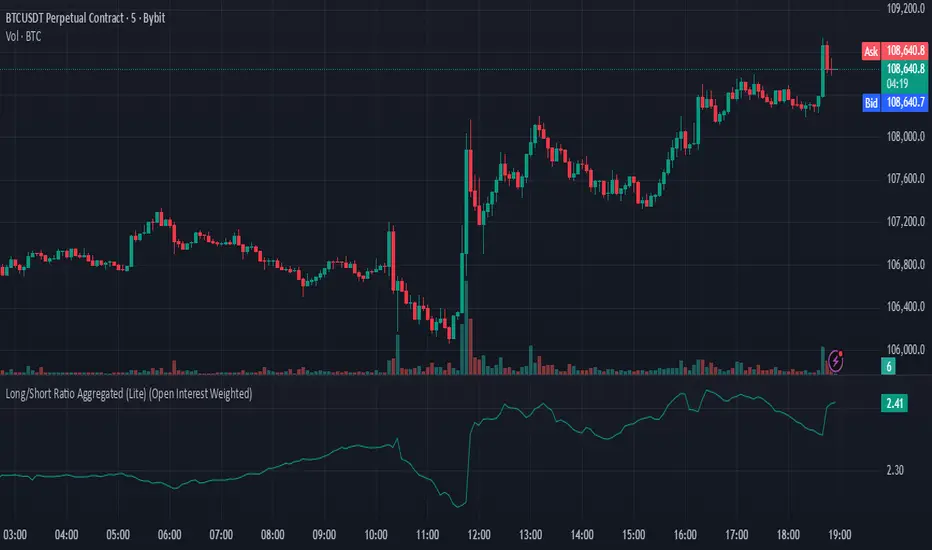
Dominance Signal Apex [CHE]]Dominance Signal Apex — Triple-confirmed entry markers with stateful guardrails
Summary
This indicator focuses on entry timing by plotting markers only when three conditions align: a closed-bar Heikin-Ashi bias, a monotonic stack of super-smoother filters, and the current HMA slope. A compact state machine provides guardrails: it starts a directional state on closed-bar Heikin-Ashi bias, maintains it only while the smoother stack remains ordered, and renders a marker only if HMA slope agrees. This design aims for selective signals and reduces isolated prints during mixed conditions. Markers fade over time to visualize the age and persistence of the current state.
Motivation: Why this design?
Common triggers flip frequently in noise or react late when regimes shift. The core idea is to gate entry markers through a closed-bar state plus independent filter alignment. The state machine limits premature prints, removes markers when alignment breaks, and uses the HMA as a final directional gate. The result is fewer mixed-context entries and clearer clusters during sustained trends.
What’s different vs. standard approaches?
Reference baseline: Single moving-average slope or classic MA cross signals.
Architecture differences:
Multi-length two-pole super-smoother stack with strict ordering checks.
Closed-bar Heikin-Ashi bias to start a directional state.
HMA slope as a final gate for rendering markers.
Time-based alpha fade to surface state age.
Practical effect: Entry markers appear in clusters during aligned regimes and are suppressed when conditions diverge, improving selectivity.
How it works (technical)
Measurements: Four recursive super-smoother series on price at short to medium horizons. Up regime means each shorter smoother sits below the next longer one; down regime is the inverse.
State machine: On bar close, positive Heikin-Ashi bias starts a bull state and negative bias starts a bear state. The state terminates the moment the smoother ordering breaks relative to the prior bar.
Rendering gate: A marker prints only if the active state agrees with the current HMA slope. The HMA is plotted and colored by slope for context.
Normalization and clamping: Marker transparency transitions from a starting to an ending alpha across a fixed number of bars, clamped within the allowed range.
Initialization: Persistent variables track state and bar-count since state start; Heikin-Ashi open is seeded on the first valid bar.
HTF/security: None used. State updates are closed-bar, which reduces repaint paths.
Bands: Smoothed high, low, centerline, and offset bands are computed but not rendered.
Parameter Guide
Show Markers — Toggle rendering — Default: true — Hides markers without changing logic.
Bull Color / Bear Color — Visual colors — Defaults: bright green / red — Aesthetic only.
Start Alpha / End Alpha — Transparency range — Defaults: one hundred / fifty, within zero to one hundred — Controls initial visibility and fade endpoint.
Steps — Fade length in bars — Default: eight, minimum one — Longer values extend the visual memory of a state.
Smoother Length — Internal band smoothing — Default: twenty-one, minimum two — Affects computed bands only; not drawn.
Band Multiplier — Internal band offset — Default: one point zero — No impact on markers.
Source — Input for HMA — Default: close — Align with your workflow.
Length — HMA length — Default: fifty, minimum one — Larger values reduce flips; smaller values react faster.
Reading & Interpretation
Entry markers:
Bull marker (below bar): Closed-bar Heikin-Ashi bias is positive, smoother stack remains aligned for up regime, and HMA slope is rising.
Bear marker (above bar): Closed-bar Heikin-Ashi bias is negative, smoother stack remains aligned for down regime, and HMA slope is falling.
Fade: Transparency progresses over the configured steps, indicating how long the current state has persisted.
Practical Workflows & Combinations
Trend following: Focus on marker clusters aligned with HMA color. Add structure filters such as higher highs and higher lows or lower highs and lower lows to avoid counter-trend entries.
Exits/Stops: Consider exiting or reducing risk when smoother ordering breaks, when HMA color flips, or when marker cadence thins out.
Multi-asset/Multi-TF: Suitable for liquid crypto, FX, indices, and equities. On lower timeframes, shorten HMA length and fade steps for faster response.
Behavior, Constraints & Performance
Repaint/confirmation: State transitions and marker eligibility are decided on closed bars; live bars do not commit state changes until close.
security()/HTF: Not used.
Resources: Declared max bars back of one thousand five hundred; recursive filters and persistent states; no explicit loops.
Known limits: Some delay around sharp turns; brief states may start in noisy phases but are quickly revoked when alignment fails; HMA gating can miss very early reversals.
Sensible Defaults & Quick Tuning
Start here: Keep defaults.
Too many flips: Increase HMA length and raise fade steps.
Too sluggish: Decrease HMA length and reduce fade steps.
Markers too faint/bold: Adjust start and end alpha toward lower or higher opacity.
What this indicator is—and isn’t
A selective entry-marker layer that prints only under triple confirmation with stateful guardrails. It is not a full system, not predictive, and does not handle risk. Combine with market structure, risk controls, and position management.
Disclaimer
The content provided, including all code and materials, is strictly for educational and informational purposes only. It is not intended as, and should not be interpreted as, financial advice, a recommendation to buy or sell any financial instrument, or an offer of any financial product or service. All strategies, tools, and examples discussed are provided for illustrative purposes to demonstrate coding techniques and the functionality of Pine Script within a trading context.
Any results from strategies or tools provided are hypothetical, and past performance is not indicative of future results. Trading and investing involve high risk, including the potential loss of principal, and may not be suitable for all individuals. Before making any trading decisions, please consult with a qualified financial professional to understand the risks involved.
By using this script, you acknowledge and agree that any trading decisions are made solely at your discretion and risk.
Best regards and happy trading
Chervolino

Flux Power Dashboard (Updated and Renamed)Flux Power Dashboard is a compact market-state heads-up display for TradingView. It blends trend, momentum, and volume-flow into a single on-chart panel with color-coded cues and minimal lag. You get:
Clean visual trend via fast/slow MA with slope/debounce filters
MACD state and most recent cross (with “freshness” tint)
OBV confirmation and gating to reduce noise
Session awareness (Asia/London/New York + pre-sessions + overlap)
Optional HTF Regime row and regime gate to align signals to higher-timeframe bias
Context from VIX/VXN (volatility regime)
A single Flux Score (0–100) as a top-level read
It is deliberately “dashboard-first”: fast to read, consistent between symbols/timeframes, and designed to limit overtrading in chop.
What it can do (capabilities)
Signal gating: You can require multiple pillars to agree (Trend, MACD, OBV) before a “strong” bias is shown.
Debounced trend: Uses slope + confirmation bars to avoid flip-flopping.
Session presets: Auto-adjust the minimum confirmation bars by session (e.g., NY vs London vs Asia) to better match liquidity/volatility.
MACD presets: Quick switch between Scalp / Classic / Slow or roll your own custom speeds.
OBV confirmation: Volume flow must agree for trend/entries to “count” (optional).
HTF Regime awareness: Shows the higher-timeframe backdrop and (optionally) gates signals so you don’t fight the dominant trend.
Volatility context: VIX/VXN auto-colored cells based on your thresholds.
Top-center Session Title: Broadcasts the active session (or Overlap) with a matched background color.
Customizable UI: Column fonts, params font, transparency, dashboard corner, marker styles, colors, widths—tune it to your chart.
Practical use: Start with Flux Score + Summary for a snapshot, confirm with Trend & MACD, check OBV agreement (implicit in signal strength), glance at Regime to avoid counter-trend trades, and use Session + VIX/VXN for timing and risk context.
How it avoids common pitfalls
Repaint-aware: “Confirm on Close” can be enabled to read prior bar states, reducing intrabar noise.
Auto MA sanity: If fast ≥ slow length, it auto-swaps under the hood to keep calculations valid.
Debounce & confirm: Trend flips only after X bars satisfy conditions, cutting false flips in chop.
Freshness tint: New Cross/Signal rows tint slightly brighter for a few bars, so you can spot recency at a glance.
Every line of the dashboard (what it shows, how it’s colored)
Flux Score
What: Composite 0–100 built from three pillars: Trend (40%), MACD (30%), OBV (30%).
Read: ≥70 Bullish, ≤30 Bearish, else Neutral.
Use: Quick “state of play” gauge—stronger alignment pushes the score toward extremes.
Regime (optional row)
What: Higher-timeframe (your Regime TF) backdrop using the same MA pair with HTF slope/ATR buffer.
Values: Bull / Bear / Range.
Gate (optional): If Regime Gate is ON, Trend/Signals only go directional when HTF agrees.
Summary
What: One-line narrative combining the three pillars: MACD (up/down/flat), OBV (up/down/flat), Trend (up/down/flat).
Use: Human-readable cross-check; should rhyme with Flux Score.
Trend
What: Debounced MA relationship on the current chart.
Strict: needs fast > slow and slow rising (mirror for down) + slope debounce + confirmation bars.
Lenient: allows fast > slow or slow rising (mirror for down) with the same debounce/confirm.
Color: Green = UP, Red = DOWN, Gray = FLAT.
Use: Your structural bias on the trading timeframe.
MACD
What: Current MACD line vs signal, using your selected preset (or custom).
Values: Bull (line above), Bear (below), Flat (equal/indeterminate).
Color: Green/Red/Gray.
Cross
What: Most recent MACD cross and how many bars ago it occurred (e.g., “MACD XUP | 3 bars”).
Freshness: If the cross happened within Fresh Signal Tint bars, the cell brightens slightly.
Use: Timing helper for inflection points.
Signal
What: Latest directional shift (from short-bias to long-bias or vice versa) and age in bars.
Strength:
Strong = Trend + MACD + OBV all align
Weak = partial alignment (e.g., Trend + MACD, or Trend + OBV)
Color: Green for long bias, Red for short bias; fresh signals tint brighter.
Use: Action cue—treat Strong as higher quality; Weak as situational.
MA
What: Your slow MA type and length, plus slope direction (“up”/“down”).
Use: Context even when Trend is FLAT; slope often turns before full trend flips.
Session
What: Current market session by Eastern Time: New York / London / Asia, Pre- windows, Overlap, or Off-hours.
Logic: If ≥2 main sessions are active, shows Overlap (and grays the top title background).
Use: Timing and expectations for liquidity/volatility; also drives session-based confirmation presets if enabled.
VIX
What: Real-time CBOE:VIX on your chosen TF.
Auto-color (if on):
Calm (< Calm) → Green
Watch (< Watch) → Yellow
Elevated (< Elevated) → Orange
Very High (≥ Elevated) → Red
Use: Equity market–wide risk mood; higher = bigger moves, lower = quieter.
VXN
What: CBOE:VXN (Nasdaq volatility index) on your chosen TF.
Auto-color thresholds like VIX.
Use: Tech-heavy risk mood; helpful for growth/QQQ/NDX names.
Footer (params row, bottom-right)
What: Key live settings so you always know the context:
P= Trend Confirmation Bars
O= OBV Confirmation Bars
Strict/Lenient (trend mode)
MACD preset (or “Custom”)
swap if MA lengths were auto-swapped for validity
Regime gate if enabled
Candles for clarity
Use: Quick integrity check when comparing charts/screenshots or changing presets.
Recommended workflow
Start at Flux Score & Summary → snapshot of alignment.
Check Trend (color) and MACD (Bull/Bear).
Look at Signal (Strong vs Weak, and age).
Glance at Regime (and use gate if you’re trend-following).
Use Session + VIX/VXN to adjust expectations (breakout vs mean-revert, risk sizing, patience).
Keep Confirm on Close ON when you want stability; turn it OFF for faster (but noisier) reads.
Notes & limitations
Not advice: This is an informational tool; always combine with your own risk rules.
Repaint vs responsiveness: With “Confirm on Close” OFF you’ll see faster state changes but may get more churn intrabar.
Presets matter: Scalp MACD reacts fastest; Slow reduces whipsaw. Choose for your timeframe.
Session windows depend on the strings you set; adjust if your broker’s feed or DST handling needs tweaks.

CMO For Loop | QuantLapseCMO For Loop Indicator
The CMO For Loop indicator, inspired by Alex Orekhov's, "Chande Momentum Oscillator," and indicator originally made by Tushar Chande, the CMO designed as a fast and responsive tool to capture quick price movements in financial markets. This oscillator leverages Momentum to measure price deviations, providing a concise yet powerful framework for identifying potential trade entry and exit points. What makes this
"enhanced" CMO indicator special is its ability to identify trending periods more accurately. By using thresholds, this allows the script to enter accurate long and short conditions extremely quickly.
Intended Uses:
Used to capture long-term trends:
Used to identify quick reversals:
Recommended Uses
Best suited for higher timeframes (8H+) to improve accuracy of signals.
Designed for strategies that require fast entries and exits.
Can also be applied to scalping approaches.
Not Recommended For
Should not be used as a mean reversion tool.
Should not be interpreted as a valuation indicator (overbought/oversold levels).
Key Features
Rapid Market Reaction
Built to prioritize speed over smoothing, making it ideal for traders who want to take advantage of quick price shifts in trending or highly volatile markets.
Flexible Thresholds
Users can customize the upper and lower CMO levels to trigger long or short conditions, allowing the indicator to adapt to different assets and trading styles.
Embracing the Noise
Signals may appear frequently, but this is intentional. The tool is optimized for traders who thrive on fast rotations, using the “noise” to catch short-lived yet impactful moves.
Clear Visual Feedback
Plots key oscillator levels and provides dynamic, color-coded candles and shapes that make it easy to identify bias and react quickly.
How It Works
Oscillator Calculation
The CMO (Chande Momentum Oscillator) is derived from comparing the source price’s deviations relative to its momentum. This approach emphasizes trend-driven price shifts.
Signal Triggers
When the oscillator rises above the upper threshold, a long bias is triggered and remains until the CMO drops below the lower threshold.
When the oscillator falls below the lower threshold, a short bias is triggered and remains until the CMO crosses back above the upper threshold.
No bias is active when the oscillator is between thresholds.
Visual Signals
Green candles = long bias
Red candles = short bias
Gray candles = neutral/no signal
Triangles mark points of change in signal direction.
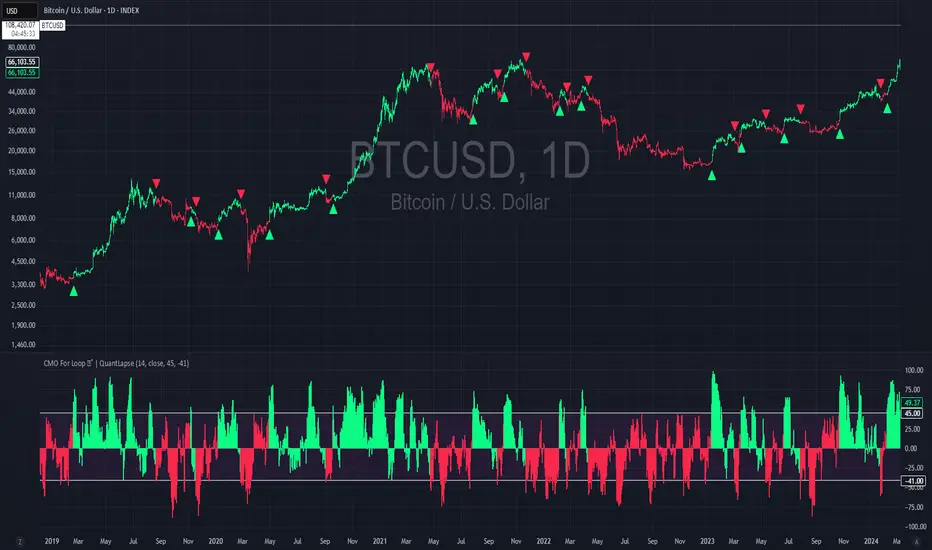
Quant Signals: Entropy w/ ForecastThis is the first of many quantitative signals I plan to create for TV users.
Most technical analysis (TA) tools—like moving averages, oscillators, or chart patterns—are heuristic: they’re based on visually identifiable shapes, threshold crossovers, or empirically chosen rules. These methods rarely quantify the information content or structural complexity of market data. By quantifying market predictability before making a forecast, this method filters out noise and focuses your trading only during statistically favorable conditions—something traditional TA cannot objectively measure.
This MEPP-based approach is quantitative and model-free:
It comes from information theory and measures Shannon entropy rate to assess how predictable the market is at any moment.
Instead of interpreting price formations, it uses a data-compression algorithm (Lempel–Ziv) to capture hidden structure in the sequence of returns.
Forecasts are generated using a principle from statistical physics (Maximum Entropy Production), not historical chart patterns.
In short, this method measures the market's predictability BEFORE deciding a directional forecast is worth trusting. This tool is to inform TA traders on the market's current regime, whether it is smooth and predictable or it is volatile and turbulent.
Technical Introduction:
In information theory, Shannon entropy measures the uncertainty (or information content) in a sequence of data. For markets, the entropy rate captures how much new information price returns generate over time:
Low entropy rate → price changes are more structured and predictable.
High entropy rate → price changes are more random and unpredictable.
By discretizing recent returns into quartile-based states, this indicator:
Calculates the normalized entropy rate as a regime filter.
Uses MEPP to forecast the next state that maximizes entropy production.
Displays both the regime status (predictable vs chaotic) and the forecast bias (bullish/bearish) in a dashboard.
Measurements & How to Use Them
TLDR: HIGH ENTROPY -> information generation/market shift -> Don't trust forecast/strategy
1. H (bits/sym)
Shannon entropy rate of the last μ discrete returns, in bits per symbol (0–2).
Lower → more predictable; higher → more random.
Use as a raw measure of market structure.
2. H_max (log₂Ω)
Theoretical maximum entropy for Ω states. Here Ω = 4 → H_max = 2.0 bits.
Reference value for normalization.
3. Entropy (norm)
H / H_max, scaled between 0 and 1.
< 0.5–0.6 → predictable regime; > 0.6 → chaotic regime.
Main regime filter — forecasts are more reliable when below your threshold.
4. Regime
Label based on Entropy (norm) vs your entThresh.
LOW (predictable) = higher odds forecast will be correct.
HIGH (chaotic) = forecasts less reliable.
5. Next State (MEPP Forecast)
Discrete return state (1–4) predicted to occur next, chosen to maximize entropy production:
Large Down (strong bearish)
Small Down (mild bearish)
Small Up (mild bullish)
Large Up (strong bullish)
Use as your bias direction.
6. Bias
Simplified label from the Next State:
States 1–2 = Bearish bias (red)
States 3–4 = Bullish bias (green)
Align strategy direction with bias only in LOW regime.
Nifty50 Swing Trading Super Indicator# 🚀 Nifty50 Swing Trading Super Indicator - Complete Guide
**Created by:** Gaurav
**Date:** August 8, 2025
**Version:** 1.0 - Optimized for Indian Markets
---
## 📋 Table of Contents
1. (#quick-start-guide)
2. (#indicator-overview)
3. (#installation-instructions)
4. (#parameter-settings)
5. (#signal-interpretation)
6. (#trading-strategy)
7. (#risk-management)
8. (#optimization-tips)
9. (#troubleshooting)
---
## 🎯 Quick Start Guide
### What You Get
✅ **2 Complete Pine Script Indicators:**
- `swing_trading_super_indicator.pine` - Universal version for all markets
- `nifty_optimized_super_indicator.pine` - Specifically optimized for Nifty50 & Indian stocks
✅ **Key Features:**
- Multi-component signal confirmation system
- Optimized for daily and 3-hour timeframes
- Built-in risk management with dynamic stops and targets
- Real-time signal strength monitoring
- Gap analysis for Indian market characteristics
### Immediate Setup
1. Copy the Pine Script code from `nifty_optimized_super_indicator.pine`
2. Paste into TradingView Pine Editor
3. Add to chart on daily or 3-hour timeframe
4. Look for 🚀BUY and 🔻SELL signals
5. Use the information table for signal confirmation
---
## 🔍 Indicator Overview
### Core Components Integration
**🎯 Range Filter (35% Weight)**
- Primary trend identification using adaptive volatility filtering
- Optimized sampling period: 21 bars for Indian market volatility
- Enhanced range multiplier: 3.0 to handle market gaps
- Provides trend direction and strength measurement
**⚡ PMAX (30% Weight)**
- Volatility-adjusted trend confirmation using ATR-based calculations
- Dynamic multiplier adjustment based on market volatility
- 14-period ATR with 2.5 multiplier for swing trading sensitivity
- Offers trailing stop functionality
**🏗️ Support/Resistance (20% Weight)**
- Dynamic level identification using pivot point analysis
- Tighter channel width (3%) for precise Indian market levels
- Enhanced strength calculation with historical interaction weighting
- Provides entry/exit timing and breakout signals
**📊 EMA Alignment (15% Weight)**
- Multi-timeframe moving average confirmation
- Key EMAs: 9, 21, 50, 200 (popular in Indian markets)
- Hierarchical alignment scoring for trend strength
- Additional trend validation layer
### Advanced Features
**🌅 Gap Analysis**
- Automatic detection of significant price gaps (>2%)
- Gap strength measurement and impact on signals
- Specific optimization for Indian market overnight gaps
- Visual gap markers on chart
**⏰ Multi-Timeframe Integration**
- Higher timeframe bias from daily/weekly data
- Configurable daily bias weight (default 70%)
- 3-hour confirmation for precise entry timing
- Prevents counter-trend trades against major timeframe
**🛡️ Risk Management**
- Dynamic stop-loss calculation using multiple methods
- Automatic profit target identification
- Position sizing guidance based on signal strength
- Anti-whipsaw logic to prevent false signals
---
## 📥 Installation Instructions
### Step 1: Access TradingView
1. Open TradingView.com
2. Navigate to Pine Editor (bottom panel)
3. Create a new indicator
### Step 2: Copy the Code
**For Nifty50 & Indian Stocks (Recommended):**
```pinescript
// Copy entire content from nifty_optimized_super_indicator.pine
```
**For Universal Use:**
```pinescript
// Copy entire content from swing_trading_super_indicator.pine
```
### Step 3: Configure and Apply
1. Click "Add to Chart"
2. Select daily or 3-hour timeframe
3. Adjust parameters if needed (defaults are optimized)
4. Enable alerts for signal notifications
### Step 4: Verify Installation
- Check that all components are visible
- Confirm information table appears in top-right
- Test with known trending stocks for signal validation
---
## ⚙️ Parameter Settings
### 🎯 Range Filter Settings
```
Sampling Period: 21 (optimized for Indian market volatility)
Range Multiplier: 3.0 (handles overnight gaps effectively)
Source: Close (most reliable for swing trading)
```
### ⚡ PMAX Settings
```
ATR Length: 14 (standard for daily/3H timeframes)
ATR Multiplier: 2.5 (balanced for swing trading sensitivity)
Moving Average Type: EMA (responsive to price changes)
MA Length: 14 (matches ATR period for consistency)
```
### 🏗️ Support/Resistance Settings
```
Pivot Period: 8 (shorter for Indian market dynamics)
Channel Width: 3% (tighter for precise levels)
Minimum Strength: 3 (higher quality levels only)
Maximum Levels: 4 (focus on strongest levels)
Lookback Period: 150 (sufficient historical data)
```
### 🚀 Super Indicator Settings
```
Signal Sensitivity: 0.65 (balanced for swing trading)
Trend Strength Requirement: 0.75 (high quality signals)
Gap Threshold: 2.0% (significant gap detection)
Daily Bias Weight: 0.7 (strong higher timeframe influence)
```
### 🎨 Display Options
```
Show Range Filter: ✅ (trend visualization)
Show PMAX: ✅ (trailing stops)
Show S/R Levels: ✅ (key price levels)
Show Key EMAs: ✅ (trend confirmation)
Show Signals: ✅ (buy/sell alerts)
Show Trend Background: ✅ (visual trend state)
Show Gap Markers: ✅ (gap identification)
```
---
## 📊 Signal Interpretation
### 🚀 BUY Signals
**Requirements for BUY Signal:**
- Price above Range Filter with upward trend
- PMAX showing bullish direction (MA > PMAX line)
- Support/resistance breakout or favorable positioning
- EMA alignment supporting upward movement
- Higher timeframe bias confirmation
- Overall signal strength > 75%
**Signal Strength Indicators:**
- **90-100%:** Extremely strong - Maximum position size
- **80-89%:** Very strong - Large position size
- **75-79%:** Strong - Standard position size
- **65-74%:** Moderate - Reduced position size
- **<65%:** Weak - Wait for better opportunity
### 🔻 SELL Signals
**Requirements for SELL Signal:**
- Price below Range Filter with downward trend
- PMAX showing bearish direction (MA < PMAX line)
- Resistance breakdown or unfavorable positioning
- EMA alignment supporting downward movement
- Higher timeframe bias confirmation
- Overall signal strength > 75%
### ⚖️ NEUTRAL Signals
**Characteristics:**
- Conflicting signals between components
- Low overall signal strength (<65%)
- Range-bound market conditions
- Wait for clearer directional bias
### 📈 Information Table Guide
**Component Status:**
- **BULL/BEAR:** Current signal direction
- **Strength %:** Component contribution strength
- **Status:** Additional context (STRONG/WEAK/ACTIVE/etc.)
**Overall Signal:**
- **🚀 STRONG BUY:** All systems aligned bullish
- **🔻 STRONG SELL:** All systems aligned bearish
- **⚖️ NEUTRAL:** Mixed or weak signals
---
## 💼 Trading Strategy
### Daily Timeframe Strategy
**Setup:**
1. Apply indicator to daily chart of Nifty50 or Indian stocks
2. Wait for 🚀BUY or 🔻SELL signal with >75% strength
3. Confirm higher timeframe bias alignment
4. Check for significant support/resistance levels
**Entry:**
- Enter on signal bar close or next bar open
- Use 3-hour chart for precise entry timing
- Avoid entries during major news events
- Consider gap analysis for overnight positions
**Position Sizing:**
- **>90% Strength:** 3-4% of portfolio
- **80-89% Strength:** 2-3% of portfolio
- **75-79% Strength:** 1-2% of portfolio
- **<75% Strength:** Avoid or minimal size
### 3-Hour Timeframe Strategy
**Setup:**
1. Confirm daily timeframe bias first
2. Apply indicator to 3-hour chart
3. Look for signals aligned with daily trend
4. Use for entry/exit timing optimization
**Entry Refinement:**
- Wait for 3H signal confirmation
- Enter on pullbacks to key levels
- Use tighter stops for better risk/reward
- Monitor intraday support/resistance
### Risk Management Rules
**Stop Loss Placement:**
1. **Primary:** Use indicator's dynamic stop level
2. **Secondary:** Below/above nearest support/resistance
3. **Maximum:** 2-3% of portfolio per trade
4. **Trailing:** Move stops with PMAX line
**Profit Taking:**
1. **Target 1:** First resistance/support level (50% position)
2. **Target 2:** Second resistance/support level (30% position)
3. **Runner:** Trail remaining 20% with PMAX
**Position Management:**
- Review positions at daily close
- Adjust stops based on new signals
- Exit if trend changes to opposite direction
- Reduce size during high volatility periods
---
## 🎯 Optimization Tips
### For Nifty50 Trading
- Use daily timeframe for primary signals
- Monitor sector rotation impact
- Consider index futures for better liquidity
- Watch for RBI policy and global cues impact
### For Individual Stocks
- Verify stock follows Nifty correlation
- Check sector-specific news and events
- Ensure adequate liquidity for position size
- Monitor earnings calendar for volatility
### Market Condition Adaptations
**Trending Markets:**
- Increase position sizes for strong signals
- Use wider stops to avoid whipsaws
- Focus on trend continuation signals
- Reduce counter-trend trading
**Range-Bound Markets:**
- Reduce position sizes
- Use tighter stops and quicker profits
- Focus on support/resistance bounces
- Increase signal strength requirements
**High Volatility Periods:**
- Reduce overall exposure
- Use smaller position sizes
- Increase stop-loss distances
- Wait for clearer signals
### Performance Monitoring
- Track win rate and average profit/loss
- Monitor signal quality over time
- Adjust parameters based on market changes
- Keep trading journal for pattern recognition
---
## 🔧 Troubleshooting
### Common Issues
**Q: Signals appear too frequently**
A: Increase "Trend Strength Requirement" to 0.8-0.9
**Q: Missing obvious trends**
A: Decrease "Signal Sensitivity" to 0.5-0.6
**Q: Too many false signals**
A: Enable "3H Confirmation" and increase strength requirements
**Q: Indicator not loading**
A: Check Pine Script version compatibility (requires v5)
### Parameter Adjustments
**For More Sensitive Signals:**
- Decrease Signal Sensitivity to 0.5-0.6
- Decrease Trend Strength Requirement to 0.6-0.7
- Increase Range Filter multiplier to 3.5-4.0
**For More Conservative Signals:**
- Increase Signal Sensitivity to 0.7-0.8
- Increase Trend Strength Requirement to 0.8-0.9
- Enable all confirmation features
### Performance Issues
- Reduce lookback periods if chart loads slowly
- Disable some visual elements for better performance
- Use on liquid stocks/indices for best results
---
## 📞 Support & Updates
This super indicator combines the best of Range Filter, PMAX, and Support/Resistance analysis specifically optimized for Indian market swing trading. The multi-component approach significantly improves signal quality while the built-in risk management features help protect capital.
**Remember:** No indicator is 100% accurate. Always combine with proper risk management, market analysis, and your trading experience for best results.
**Happy Trading! 🚀**

The Kyber Cell's – TTM Wave CThe Kyber Cell’s Wave C – TTM Squeeze Macro Bias & Structural Filter
⸻
1. Introduction
Wave C is the strategic compass in the TTM Squeeze Wave system — the final layer that helps you align with the larger trend or macro context. While Wave A delivers momentum bursts and Wave B confirms active trend direction, Wave C filters trades through a broader lens, helping you avoid taking strong intraday setups that go against the dominant structure.
Wave C is designed to act as your macro bias validator — filtering out trades that contradict higher-timeframe flows or major moving average slopes. When all three waves line up, you’re no longer just reacting to signals — you’re trading with intention and structure. When in doubt, zoom out and that is what Wave C gives you.
⸻
2. Core Concept and Calculation
Wave C is built to measure high-level trend bias, either on the current chart timeframe or derived from a higher timeframe (HTF). Its logic is based on one or more of the following structural tools:
• Long-term EMA slope (e.g., 55, 89, or 200 EMA)
• HTF VWAP positioning (price above or below)
• Long-period HMA slope (e.g., HMA 144 or HMA 233)
• Directional bias from HTF TTM Squeeze or MTF trend engine
Unlike Wave A and B, which may fluctuate during normal price swings, Wave C changes more slowly. That’s the point — it gives a “big picture” backdrop against which all lower-level signals should be evaluated. It reduces false positives and helps you wait for trades in the direction of the broader trend.
⸻
3. Visual Output and Color Logic
Wave C uses a simple and deliberate color scheme to communicate macro alignment:
• Green: Bullish macro structure
• Red: Bearish macro structure
• Gray: Neutral, indecisive, or flat macro trend
This muted but firm logic encourages patient, structured trading. The goal isn’t to trigger trades directly from Wave C, but to filter out trades that contradict market posture.
• When Wave C is Green, you ideally want Wave B to be blue and Wave A to turn cyan before going long.
• When Wave C is Red, you look for Wave B to be red and Wave A to turn bright red before shorting.
• If Wave C is Gray, it may signal choppy, indecisive structure — use caution or reduce trade size.
⸻
4. Ideal Use Case
Wave C functions as your global bias filter:
1. Set your directional bias for the session or week.
2. Only take trades that agree with Wave C direction.
3. When all waves align, trade with size and confidence.
4. When Wave C disagrees, wait or downshift your trade plan.
This makes Wave C especially valuable for swing traders, position traders, or intraday traders who want to anchor their entries within a broader trend.
⸻
5. Configuration and Customization
Wave C is built with advanced users in mind, and its configuration allows multiple structural methods:
• EMA Slope Method: Set EMA length and threshold angle
• HTF Source Method: Request HTF data for squeeze trend, VWAP, or Wave B analog
• HMA Trend Filter: Longer-term smoothing to detect sustained directional flow
• Color Preferences: Customize green/red/gray scheme as needed
This flexibility allows you to tailor Wave C to your strategy — whether you’re anchoring to a Daily EMA while scalping the 5-minute chart, or aligning swing entries with the Weekly VWAP.
⸻
6. Alerts and Add-ons
Although Wave C isn’t typically used for alerts, it can be incorporated into confluence-based alert stacks. For example:
• Alert only when Wave C = Green, Wave B = Blue, and Wave A = Rising
• Alert on macro flip (e.g., Green → Red) as a possible regime change
• Alert when macro bias agrees with MTF Squeeze Panel bias
These setups are more advanced but help automate disciplined trade selection.
⸻
7. Disclaimer
This indicator is for educational and research purposes only. It is not trading advice. Wave C is most effective when used in conjunction with Wave A, Wave B, and other structural context. All trades should be executed with proper risk management and backtested methodology.

Mongoose Capital: BTC ETF DriftScope ProMongoose Capital: BTC ETF DriftScope Pro
A proprietary indicator for monitoring drift between Bitcoin Spot (BTCUSD) and Bitcoin Spot ETFs (such as IBIT). Designed to detect ETF premium/discount zones and generate actionable Fade or Long bias signals.
What it Does
Tracks IBIT and BTCUSD spread to highlight ETF price deviations.
Calculates correlation Z-Score for ETF/Spot alignment.
Outputs numeric bias signals: Fade (1), Long (1), Neutral (1).
How to Use
Apply to a BTCUSD chart (4H, 1D, or higher recommended).
Open the Data Window to view:
IBIT Spread %
Correlation Z-Score
Correlation %
Bias Flags (Fade, Long, Neutral)
Configure alerts for Fade and Long Bias conditions.
Confirm all signals with your trade plan and risk management.
Methodology
This tool calculates the percentage spread between IBIT and BTC Spot. A rolling Z-Score of the correlation is used to detect periods of significant divergence.
Fade Bias suggests potential short setups in premium zones with high Z-Scores.
Long Bias suggests potential long setups in discount zones with low Z-Scores.
Disclaimer
This indicator is for educational purposes only. It is not financial advice. Use at your own risk and verify signals independently.

Scalping Candle [Crak x MMT]The Scalping Candle is a TradingView indicator designed for scalping strategies, identifying potential bullish and bearish engulfing patterns on price charts. It overlays directly on the chart and marks specific candle patterns with visual signals, helping traders spot short-term trading opportunities. The indicator includes a customizable bias filter to focus on bullish, bearish, or neutral market conditions.
Features
Overlay Indicator : Displays bullish and bearish signals directly on the price chart.
Bias Filter : Allows users to select a market bias ('Bullish', 'Bearish', or 'Neutral') to filter signals based on their trading preference.
Visual Signals : Plots green upward triangles below bullish candles and red downward triangles above bearish candles.
Alerts : Generates alerts for bullish and bearish engulfing patterns, enabling timely notifications for trade setups.
How It Works
The indicator analyzes the relationship between the current and previous candles to detect engulfing patterns:
Bullish Engulfing : Triggered when the current candle's low is at or below the previous candle's low, and its close is at or above the previous candle's midpoint. This signal is displayed only if the bias filter is set to 'Neutral' or 'Bullish'.
Bearish Engulfing : Triggered when the current candle's high is at or above the previous candle's high, and its close is at or below the previous candle's midpoint. This signal is displayed only if the bias filter is set to 'Neutral' or 'Bearish'.
The previous candle's midpoint is calculated as the average of its high and low prices.
Usage
- Add to Chart : Apply the indicator to any TradingView chart.
- Configure Bias Filter :
Neutral : Displays both bullish and bearish signals.
Bullish : Displays only bullish signals.
Bearish : Displays only bearish signals.
- Interpret Signals :
Green upward triangle below a candle indicates a potential bullish reversal.
Red downward triangle above a candle indicates a potential bearish reversal.
- Set Alerts : Use the built-in alert conditions to receive notifications when bullish or bearish engulfing patterns are detected.
Settings
Bias Filter : Choose between 'Neutral', 'Bullish', or 'Bearish' to control which signals are displayed.
Shape Size : Signals are plotted as small triangles for minimal chart clutter.
Alert Conditions : Enable alerts for 'Bullish Engulfing Detected' or 'Bearish Engulfing Detected' to stay informed of new signals.
Ideal Use Case
This indicator is tailored for scalpers and short-term traders looking to capitalize on quick price movements driven by engulfing candle patterns. It works best on 15-minute chart and can be combined with other technical tools for confirmation.

Smarter Money Flow Divergence Detector [PhenLabs]📊 Smarter Money Flow Divergence Detector
Version: PineScript™ v6
📌 Description
SMFD was developed to help give you guys a better ability to “read” what is going on behind the scenes without directly having access to that level of data. SMFD is an enhanced divergence detection indicator that identifies money flow patterns from advanced volume analysis and price action correspondence. The detection portion of this indicator combines intelligent money flow calculations with multi timeframe volume analysis to help you see hidden accumulation and distribution phases before major price movements occur.
The indicator measures institutional trading activity by looking at volume surges, price volume dynamics, and the factors of momentum to construct an overall picture of market sentiment. It’s built to assist traders in identifying high probability entries by identifying if smart money is positioning against price action.
🚀 Points of Innovation
● Advanced Smart Money Flow algorithm with volume spike detection and large trade weighting
● Multi timeframe volume analysis for enhanced institutional activity detection
● Dynamic overbought/oversold zones that adapt to current market conditions
● Enhanced divergence detection with pivot confirmation and strength validation
● Color themes with customizable visual styling options
● Real time institutional bias tracking through accumulation/distribution analysis
🔧 Core Components
● Smart Money Flow Calculation: Combines price momentum, volume expansion, and VWAP analysis
● Institutional Bias Oscillator: Tracks accumulation/distribution patterns with volume pressure analysis
● Enhanced Divergence Engine: Detects bullish/bearish divergences with multiple confirmation factors
● Dynamic Zone Detection: Automatically adjusts overbought/oversold levels based on market volatility
● Volume Pressure Analysis: Measures buying vs selling pressure over configurable periods
● Multi factor Signal System: Generates entries with trend alignment and strength validation
🔥 Key Features
● Smart Money Flow Period: Configurable calculation period for institutional activity detection
● Volume Spike Threshold: Adjustable multiplier for detecting unusual institutional volume
● Large Trade Weight: Emphasis factor for high volume periods in flow calculations
● Pivot Detection: Customizable lookback period for accurate divergence identification
● Signal Sensitivity: Three tier system (Conservative/Medium/Aggressive) for signal generation
● Themes: Four color schemes optimized for different chart backgrounds
🎨 Visualization
● Main Oscillator: Line, Area, or Histogram display styles with dynamic color coding
● Institutional Bias Line: Real time tracking of accumulation/distribution phases
● Dynamic Zones: Adaptive overbought/oversold boundaries with gradient fills
● Divergence Lines: Automatic drawing of bullish/bearish divergence connections
● Entry Signals: Clear BUY/SELL labels with signal strength indicators
● Information Panel: Real time statistics and status updates in customizable positions
📖 Usage Guidelines
Algorithm Settings
● Smart Money Flow Period
○ Default: 20
○ Range: 5-100
○ Description: Controls the calculation period for institutional flow analysis.
Higher values provide smoother signals but reduce responsiveness to recent activity
● Volume Spike Threshold
○ Default: 1.8
○ Range: 1.0-5.0
○ Description: Multiplier for detecting unusual volume activity indicating institutional participation. Higher values require more extreme volume for detection
● Large Trade Weight
○ Default: 2.5
○ Range: 1.5-5.0
○ Description: Weight applied to high volume periods in smart money calculations. Increases emphasis on institutional sized transactions
Divergence Detection
● Pivot Detection Period
○ Default: 12
○ Range: 5-50
○ Description: Bars to analyze for pivot high/low identification.
Affects divergence accuracy and signal frequency
● Minimum Divergence Strength
○ Default: 0.25
○ Range: 0.1-1.0
○ Description: Required price change percentage for valid divergence patterns.
Higher values filter out weaker signals
✅ Best Use Cases
● Trading with intraday to daily timeframes for institutional position identification
● Confirming trend reversals when divergences align with support/resistance levels
● Entry timing in trending markets when institutional bias supports the direction
● Risk management by avoiding trades against strong institutional positioning
● Multi timeframe analysis combining short term signals with longer term bias
⚠️ Limitations
● Requires sufficient volume for accurate institutional detection in low volume markets
● Divergence signals may have false positives during highly volatile news events
● Best performance on liquid markets with consistent institutional participation
● Lagging nature of volume based calculations may delay signal generation
● Effectiveness reduced during low participation holiday periods
💡 What Makes This Unique
● Multi Factor Analysis: Combines volume, price, and momentum for comprehensive institutional detection
● Adaptive Zones: Dynamic overbought/oversold levels that adjust to market conditions
● Volume Intelligence: Advanced algorithms identify institutional sized transactions
● Professional Visualization: Multiple display styles with customizable themes
● Confirmation System: Multiple validation layers reduce false signal generation
🔬 How It Works
1. Volume Analysis Phase:
● Analyzes current volume against historical averages to identify institutional activity
● Applies multi timeframe analysis for enhanced detection accuracy
● Calculates volume pressure through buying vs selling momentum
2. Smart Money Flow Calculation:
● Combines typical price with volume weighted analysis
● Applies institutional trade weighting for high volume periods
● Generates directional flow based on price momentum and volume expansion
3. Divergence Detection Process:
● Identifies pivot highs/lows in both price and indicator values
● Validates divergence strength against minimum threshold requirements
● Confirms signals through multiple technical factors before generation
💡 Note: This indicator works best when combined with proper risk management and position sizing. The institutional bias component helps identify market sentiment shifts, while divergence signals provide specific entry opportunities. For optimal results, use on liquid markets with consistent institutional participation and combine with additional technical analysis methods.

Langlands-Operadic Möbius Vortex (LOMV)Langlands-Operadic Möbius Vortex (LOMV)
Where Pure Mathematics Meets Market Reality
A Revolutionary Synthesis of Number Theory, Category Theory, and Market Dynamics
🎓 THEORETICAL FOUNDATION
The Langlands-Operadic Möbius Vortex represents a groundbreaking fusion of three profound mathematical frameworks that have never before been combined for market analysis:
The Langlands Program: Harmonic Analysis in Markets
Developed by Robert Langlands (Fields Medal recipient), the Langlands Program creates bridges between number theory, algebraic geometry, and harmonic analysis. In our indicator:
L-Function Implementation:
- Utilizes the Möbius function μ(n) for weighted price analysis
- Applies Riemann zeta function convergence principles
- Calculates quantum harmonic resonance between -2 and +2
- Measures deep mathematical patterns invisible to traditional analysis
The L-Function core calculation employs:
L_sum = Σ(return_val × μ(n) × n^(-s))
Where s is the critical strip parameter (0.5-2.5), controlling mathematical precision and signal smoothness.
Operadic Composition Theory: Multi-Strategy Democracy
Category theory and operads provide the mathematical framework for composing multiple trading strategies into a unified signal. This isn't simple averaging - it's mathematical composition using:
Strategy Composition Arity (2-5 strategies):
- Momentum analysis via RSI transformation
- Mean reversion through Bollinger Band mathematics
- Order Flow Polarity Index (revolutionary T3-smoothed volume analysis)
- Trend detection using Directional Movement
- Higher timeframe momentum confirmation
Agreement Threshold System: Democratic voting where strategies must reach consensus before signal generation. This prevents false signals during market uncertainty.
Möbius Function: Number Theory in Action
The Möbius function μ(n) forms the mathematical backbone:
- μ(n) = 1 if n is a square-free positive integer with even number of prime factors
- μ(n) = -1 if n is a square-free positive integer with odd number of prime factors
- μ(n) = 0 if n has a squared prime factor
This creates oscillating weights that reveal hidden market periodicities and harmonic structures.
🔧 COMPREHENSIVE INPUT SYSTEM
Langlands Program Parameters
Modular Level N (5-50, default 30):
Primary lookback for quantum harmonic analysis. Optimized by timeframe:
- Scalping (1-5min): 15-25
- Day Trading (15min-1H): 25-35
- Swing Trading (4H-1D): 35-50
- Asset-specific: Crypto 15-25, Stocks 30-40, Forex 35-45
L-Function Critical Strip (0.5-2.5, default 1.5):
Controls Riemann zeta convergence precision:
- Higher values: More stable, smoother signals
- Lower values: More reactive, catches quick moves
- High frequency: 0.8-1.2, Medium: 1.3-1.7, Low: 1.8-2.3
Frobenius Trace Period (5-50, default 21):
Galois representation lookback for price-volume correlation:
- Measures harmonic relationships in market flows
- Scalping: 8-15, Day Trading: 18-25, Swing: 25-40
HTF Multi-Scale Analysis:
Higher timeframe context prevents trading against major trends:
- Provides market bias and filters signals
- Improves win rates by 15-25% through trend alignment
Operadic Composition Parameters
Strategy Composition Arity (2-5, default 4):
Number of algorithms composed for final signal:
- Conservative: 4-5 strategies (higher confidence)
- Moderate: 3-4 strategies (balanced approach)
- Aggressive: 2-3 strategies (more frequent signals)
Category Agreement Threshold (2-5, default 3):
Democratic voting minimum for signal generation:
- Higher agreement: Fewer but higher quality signals
- Lower agreement: More signals, potential false positives
Swiss-Cheese Mixing (0.1-0.5, default 0.382):
Golden ratio φ⁻¹ based blending of trend factors:
- 0.382 is φ⁻¹, optimal for natural market fractals
- Higher values: Stronger trend following
- Lower values: More contrarian signals
OFPI Configuration:
- OFPI Length (5-30, default 14): Order Flow calculation period
- T3 Smoothing (3-10, default 5): Advanced exponential smoothing
- T3 Volume Factor (0.5-1.0, default 0.7): Smoothing aggressiveness control
Unified Scoring System
Component Weights (sum ≈ 1.0):
- L-Function Weight (0.1-0.5, default 0.3): Mathematical harmony emphasis
- Galois Rank Weight (0.1-0.5, default 0.2): Market structure complexity
- Operadic Weight (0.1-0.5, default 0.3): Multi-strategy consensus
- Correspondence Weight (0.1-0.5, default 0.2): Theory-practice alignment
Signal Threshold (0.5-10.0, default 5.0):
Quality filter producing:
- 8.0+: EXCEPTIONAL signals only
- 6.0-7.9: STRONG signals
- 4.0-5.9: MODERATE signals
- 2.0-3.9: WEAK signals
🎨 ADVANCED VISUAL SYSTEM
Multi-Dimensional Quantum Aura Bands
Five-layer resonance field showing market energy:
- Colors: Theme-matched gradients (Quantum purple, Holographic cyan, etc.)
- Expansion: Dynamic based on score intensity and volatility
- Function: Multi-timeframe support/resistance zones
Morphism Flow Portals
Category theory visualization showing market topology:
- Green/Cyan Portals: Bullish mathematical flow
- Red/Orange Portals: Bearish mathematical flow
- Size/Intensity: Proportional to signal strength
- Recursion Depth (1-8): Nested patterns for flow evolution
Fractal Grid System
Dynamic support/resistance with projected L-Scores:
- Multiple Timeframes: 10, 20, 30, 40, 50-period highs/lows
- Smart Spacing: Prevents level overlap using ATR-based minimum distance
- Projections: Estimated signal scores when price reaches levels
- Usage: Precise entry/exit timing with mathematical confirmation
Wick Pressure Analysis
Rejection level prediction using candle mathematics:
- Upper Wicks: Selling pressure zones (purple/red lines)
- Lower Wicks: Buying pressure zones (purple/green lines)
- Glow Intensity (1-8): Visual emphasis and line reach
- Application: Confluence with fractal grid creates high-probability zones
Regime Intensity Heatmap
Background coloring showing market energy:
- Black/Dark: Low activity, range-bound markets
- Purple Glow: Building momentum and trend development
- Bright Purple: High activity, strong directional moves
- Calculation: Combines trend, momentum, volatility, and score intensity
Six Professional Themes
- Quantum: Purple/violet for general trading and mathematical focus
- Holographic: Cyan/magenta optimized for cryptocurrency markets
- Crystalline: Blue/turquoise for conservative, stability-focused trading
- Plasma: Gold/magenta for high-energy volatility trading
- Cosmic Neon: Bright neon colors for maximum visibility and aggressive trading
📊 INSTITUTIONAL-GRADE DASHBOARD
Unified AI Score Section
- Total Score (-10 to +10): Primary decision metric
- >5: Strong bullish signals
- <-5: Strong bearish signals
- Quality ratings: EXCEPTIONAL > STRONG > MODERATE > WEAK
- Component Analysis: Individual L-Function, Galois, Operadic, and Correspondence contributions
Order Flow Analysis
Revolutionary OFPI integration:
- OFPI Value (-100% to +100%): Real buying vs selling pressure
- Visual Gauge: Horizontal bar chart showing flow intensity
- Momentum Status: SHIFTING, ACCELERATING, STRONG, MODERATE, or WEAK
- Trading Application: Flow shifts often precede major moves
Signal Performance Tracking
- Win Rate Monitoring: Real-time success percentage with emoji indicators
- Signal Count: Total signals generated for frequency analysis
- Current Position: LONG, SHORT, or NONE with P&L tracking
- Volatility Regime: HIGH, MEDIUM, or LOW classification
Market Structure Analysis
- Möbius Field Strength: Mathematical field oscillation intensity
- CHAOTIC: High complexity, use wider stops
- STRONG: Active field, normal position sizing
- MODERATE: Balanced conditions
- WEAK: Low activity, consider smaller positions
- HTF Trend: Higher timeframe bias (BULL/BEAR/NEUTRAL)
- Strategy Agreement: Multi-algorithm consensus level
Position Management
When in trades, displays:
- Entry Price: Original signal price
- Current P&L: Real-time percentage with risk level assessment
- Duration: Bars in trade for timing analysis
- Risk Level: HIGH/MEDIUM/LOW based on current exposure
🚀 SIGNAL GENERATION LOGIC
Balanced Long/Short Architecture
The indicator generates signals through multiple convergent pathways:
Long Entry Conditions:
- Score threshold breach with algorithmic agreement
- Strong bullish order flow (OFPI > 0.15) with positive composite signal
- Bullish pattern recognition with mathematical confirmation
- HTF trend alignment with momentum shifting
- Extreme bullish OFPI (>0.3) with any positive score
Short Entry Conditions:
- Score threshold breach with bearish agreement
- Strong bearish order flow (OFPI < -0.15) with negative composite signal
- Bearish pattern recognition with mathematical confirmation
- HTF trend alignment with momentum shifting
- Extreme bearish OFPI (<-0.3) with any negative score
Exit Logic:
- Score deterioration below continuation threshold
- Signal quality degradation
- Opposing order flow acceleration
- 10-bar minimum between signals prevents overtrading
⚙️ OPTIMIZATION GUIDELINES
Asset-Specific Settings
Cryptocurrency Trading:
- Modular Level: 15-25 (capture volatility)
- L-Function Precision: 0.8-1.3 (reactive to price swings)
- OFPI Length: 10-20 (fast correlation shifts)
- Cascade Levels: 5-7, Theme: Holographic
Stock Index Trading:
- Modular Level: 25-35 (balanced trending)
- L-Function Precision: 1.5-1.8 (stable patterns)
- OFPI Length: 14-20 (standard correlation)
- Cascade Levels: 4-5, Theme: Quantum
Forex Trading:
- Modular Level: 35-45 (smooth trends)
- L-Function Precision: 1.6-2.1 (high smoothing)
- OFPI Length: 18-25 (disable volume amplification)
- Cascade Levels: 3-4, Theme: Crystalline
Timeframe Optimization
Scalping (1-5 minute charts):
- Reduce all lookback parameters by 30-40%
- Increase L-Function precision for noise reduction
- Enable all visual elements for maximum information
- Use Small dashboard to save screen space
Day Trading (15 minute - 1 hour):
- Use default parameters as starting point
- Adjust based on market volatility
- Normal dashboard provides optimal information density
- Focus on OFPI momentum shifts for entries
Swing Trading (4 hour - Daily):
- Increase lookback parameters by 30-50%
- Higher L-Function precision for stability
- Large dashboard for comprehensive analysis
- Emphasize HTF trend alignment
🏆 ADVANCED TRADING STRATEGIES
The Mathematical Confluence Method
1. Wait for Fractal Grid level approach
2. Confirm with projected L-Score > threshold
3. Verify OFPI alignment with direction
4. Enter on portal signal with quality ≥ STRONG
5. Exit on score deterioration or opposing flow
The Regime Trading System
1. Monitor Aether Flow background intensity
2. Trade aggressively during bright purple periods
3. Reduce position size during dark periods
4. Use Möbius Field strength for stop placement
5. Align with HTF trend for maximum probability
The OFPI Momentum Strategy
1. Watch for momentum shifting detection
2. Confirm with accelerating flow in direction
3. Enter on immediate portal signal
4. Scale out at Fibonacci levels
5. Exit on flow deceleration or reversal
⚠️ RISK MANAGEMENT INTEGRATION
Mathematical Position Sizing
- Use Galois Rank for volatility-adjusted sizing
- Möbius Field strength determines stop width
- Fractal Dimension guides maximum exposure
- OFPI momentum affects entry timing
Signal Quality Filtering
- Trade only STRONG or EXCEPTIONAL quality signals
- Increase position size with higher agreement levels
- Reduce risk during CHAOTIC Möbius field periods
- Respect HTF trend alignment for directional bias
🔬 DEVELOPMENT JOURNEY
Creating the LOMV was an extraordinary mathematical undertaking that pushed the boundaries of what's possible in technical analysis. This indicator almost didn't happen. The theoretical complexity nearly proved insurmountable.
The Mathematical Challenge
Implementing the Langlands Program required deep research into:
- Number theory and the Möbius function
- Riemann zeta function convergence properties
- L-function analytical continuation
- Galois representations in finite fields
The mathematical literature spans decades of pure mathematics research, requiring translation from abstract theory to practical market application.
The Computational Complexity
Operadic composition theory demanded:
- Category theory implementation in Pine Script
- Multi-dimensional array management for strategy composition
- Real-time democratic voting algorithms
- Performance optimization for complex calculations
The Integration Breakthrough
Bringing together three disparate mathematical frameworks required:
- Novel approaches to signal weighting and combination
- Revolutionary Order Flow Polarity Index development
- Advanced T3 smoothing implementation
- Balanced signal generation preventing directional bias
Months of intensive research culminated in breakthrough moments when the mathematics finally aligned with market reality. The result is an indicator that reveals market structure invisible to conventional analysis while maintaining practical trading utility.
🎯 PRACTICAL IMPLEMENTATION
Getting Started
1. Apply indicator with default settings
2. Select appropriate theme for your markets
3. Observe dashboard metrics during different market conditions
4. Practice signal identification without trading
5. Gradually adjust parameters based on observations
Signal Confirmation Process
- Never trade on score alone - verify quality rating
- Confirm OFPI alignment with intended direction
- Check fractal grid level proximity for timing
- Ensure Möbius field strength supports position size
- Validate against HTF trend for bias confirmation
Performance Monitoring
- Track win rate in dashboard for strategy assessment
- Monitor component contributions for optimization
- Adjust threshold based on desired signal frequency
- Document performance across different market regimes
🌟 UNIQUE INNOVATIONS
1. First Integration of Langlands Program mathematics with practical trading
2. Revolutionary OFPI with T3 smoothing and momentum detection
3. Operadic Composition using category theory for signal democracy
4. Dynamic Fractal Grid with projected L-Score calculations
5. Multi-Dimensional Visualization through morphism flow portals
6. Regime-Adaptive Background showing market energy intensity
7. Balanced Signal Generation preventing directional bias
8. Professional Dashboard with institutional-grade metrics
📚 EDUCATIONAL VALUE
The LOMV serves as both a practical trading tool and an educational gateway to advanced mathematics. Traders gain exposure to:
- Pure mathematics applications in markets
- Category theory and operadic composition
- Number theory through Möbius function implementation
- Harmonic analysis via L-function calculations
- Advanced signal processing through T3 smoothing
⚖️ RESPONSIBLE USAGE
This indicator represents advanced mathematical research applied to market analysis. While the underlying mathematics are rigorously implemented, markets remain inherently unpredictable.
Key Principles:
- Use as part of comprehensive trading strategy
- Implement proper risk management at all times
- Backtest thoroughly before live implementation
- Understand that past performance does not guarantee future results
- Never risk more than you can afford to lose
The mathematics reveal deep market structure, but successful trading requires discipline, patience, and sound risk management beyond any indicator.
🔮 CONCLUSION
The Langlands-Operadic Möbius Vortex represents a quantum leap forward in technical analysis, bringing PhD-level pure mathematics to practical trading while maintaining visual elegance and usability.
From the harmonic analysis of the Langlands Program to the democratic composition of operadic theory, from the number-theoretic precision of the Möbius function to the revolutionary Order Flow Polarity Index, every component works in mathematical harmony to reveal the hidden order within market chaos.
This is more than an indicator - it's a mathematical lens that transforms how you see and understand market structure.
Trade with mathematical precision. Trade with the LOMV.
*"Mathematics is the language with which God has written the universe." - Galileo Galilei*
*In markets, as in nature, profound mathematical beauty underlies apparent chaos. The LOMV reveals this hidden order.*
— Dskyz, Trade with insight. Trade with anticipation.

Average Up and Down Candles Streak with Predicted Next CandleThis indicator is designed to analyze price trends by examining the patterns of up and down streaks (consecutive bullish or bearish candles) over a defined period. It uses this data to provide insights on whether the next candle is likely to be bullish or bearish, and it visually displays relevant information on the chart.
Here’s a breakdown of what the indicator does:
1. Inputs and Parameters
Period (Candles): Defines the number of candles used to calculate the average length of bullish and bearish streaks. For example, if the period is set to 20, the indicator will analyze the past 20 candles to determine average up and down streak lengths.
Bullish/Bearish Bias Signal Toggle: These options allow users to show or hide visual signals (green or red circles) when there’s a bullish or bearish bias in the trend based on the indicator’s calculations.
2. Streak Calculation
The indicator looks at each candle within the period to identify if it closed up (bullish) or down (bearish).
Up Streak: The indicator counts consecutive bullish candles. When there’s a bearish candle, it resets the up streak count.
Down Streak: Similarly, it counts consecutive bearish candles and resets when a bullish candle appears.
Averages: Over the defined period, the indicator calculates the average length of up streaks and average length of down streaks. This provides a baseline to assess whether the current streak is typical or extended.
3. Current and Average Streak Display
The indicator displays the current up and down streak lengths alongside the average streak lengths for comparison. This data appears in a table on the chart, allowing you to see at a glance:
The current streak length (for both up and down trends)
The average streak length for up and down trends over the chosen period
4. Trend Prediction for the Next Candle
Next Candle Prediction: Based on the current streak and its comparison to the average, the indicator predicts the likely direction of the next candle:
Bullish: If the current up streak is shorter than the average up streak, suggesting that the bullish trend could continue.
Bearish: If the current down streak is shorter than the average down streak, indicating that the bearish trend may continue.
Neutral: If the current streak length is near the average, which could signal an upcoming reversal.
This prediction appears in a table on the chart, labeled as “Next Candle.”
5. Previous Candle Analysis
The Previous Candle entry in the table reflects the last completed candle (directly before the current candle) to show whether it was bullish, bearish, or neutral.
This data gives a reference point for recent price action and helps validate the next candle prediction.
6. Visual Signals and Reversal Zones
Bullish/Bearish Bias Signals: The indicator can plot green circles on bullish bias and red circles on bearish bias to highlight points where the trend is likely to continue.
Reversal Zones: If the current streak length reaches or exceeds the average, it suggests the trend may be overextended, indicating a potential reversal zone. The indicator highlights these zones with shaded backgrounds (green for possible bullish reversal, red for bearish) on the chart.
Summary of What You See on the Chart
Bullish and Bearish Bias Signals: Green or red circles mark areas of expected continuation in the trend.
Reversal Zones: Shaded areas in red or green suggest that the trend might be about to reverse.
Tables:
The Next Candle prediction table displays the trend direction of the previous candle and the likely trend of the next candle.
The Streak Information table shows the current up and down streak lengths, along with their averages for easy comparison.
Practical Use
This indicator is helpful for traders aiming to understand trend momentum and potential reversals based on historical patterns. It’s particularly useful for swing trading, where knowing the typical length of bullish or bearish trends can help in timing entries and exits.
Delta Volume Columns Pro [LucF]█ OVERVIEW
This indicator displays volume delta information calculated with intrabar inspection on historical bars, and feed updates when running in realtime. It is designed to run in a pane and can display either stacked buy/sell volume columns or a signal line which can be calculated and displayed in many different ways.
Five different models are offered to reveal different characteristics of the calculated volume delta information. Many options are offered to visualize the calculations, giving you much leeway in morphing the indicator's visuals to suit your needs. If you value delta volume information, I hope you will find the time required to master Delta Volume Columns Pro well worth the investment. I am confident that if you combine a proper understanding of the indicator's information with an intimate knowledge of the volume idiosyncrasies on the markets you trade, you can extract useful market intelligence using this tool.
█ WARNINGS
1. The indicator only works on markets where volume information is available,
Please validate that your symbol's feed carries volume information before asking me why the indicator doesn't plot values.
2. When you refresh your chart or re-execute the script on the chart, the indicator will repaint because elapsed realtime bars will then recalculate as historical bars.
3. Because the indicator uses different modes of calculation on historical and realtime bars, it's critical that you understand the differences between them. Details are provided further down.
4. Calculations using intrabar inspection on historical bars can only be done from some chart timeframes. See further down for a list of supported timeframes.
If the chart's timeframe is not supported, no historical volume delta will display.
█ CONCEPTS
Chart bars
Three different types of bars are used in charts:
1. Historical bars are bars that have already closed when the script executes on them.
2. The realtime bar is the current, incomplete bar where a script is running on an open market. There is only one active realtime bar on your chart at any given time.
The realtime bar is where alerts trigger.
3. Elapsed realtime bars are bars that were calculated when they were realtime bars but have since closed.
When a script re-executes on a chart because the browser tab is refreshed or some of its inputs are changed, elapsed realtime bars are recalculated as historical bars.
Why does this indicator use two modes of calculation?
Historical bars on TradingView charts contain OHLCV data only, which is insufficient to calculate volume delta on them with any level of precision. To mine more detailed information from those bars we look at intrabars , i.e., bars from a smaller timeframe (we call it the intrabar timeframe ) that are contained in one chart bar. If your chart Is running at 1D on a 24x7 market for example, most 1D chart bars will contain 24 underlying 1H bars in their dilation. On historical bars, this indicator looks at those intrabars to amass volume delta information. If the intrabar is up, its volume goes in the Buy bin, and inversely for the Sell bin. When price does not move on an intrabar, the polarity of the last known movement is used to determine in which bin its volume goes.
In realtime, we have access to price and volume change for each update of the chart. Because a 1D chart bar can be updated tens of thousands of times during the day, volume delta calculations on those updates is much more precise. This precision, however, comes at a price:
— The script must be running on the chart for it to keep calculating in realtime.
— If you refresh your chart you will lose all accumulated realtime calculations on elapsed realtime bars, and the realtime bar.
Elapsed realtime bars will recalculate as historical bars, i.e., using intrabar inspection, and the realtime bar's calculations will reset.
When the script recalculates elapsed realtime bars as historical bars, the values on those bars will change, which means the script repaints in those conditions.
— When the indicator first calculates on a chart containing an incomplete realtime bar, it will count ALL the existing volume on the bar as Buy or Sell volume,
depending on the polarity of the bar at that point. This will skew calculations for that first bar. Scripts have no access to the history of a realtime bar's previous updates,
and intrabar inspection cannot be used on realtime bars, so this is the only to go about this.
— Even if alerts only trigger upon confirmation of their conditions after the realtime bar closes, they are repainting alerts
because they would perhaps not have calculated the same way using intrabar inspection.
— On markets like stocks that often have different EOD and intraday feeds and volume information,
the volume's scale may not be the same for the realtime bar if your chart is at 1D, for example,
and the indicator is using an intraday timeframe to calculate on historical bars.
— Any chart timeframe can be used in realtime mode, but plots that include moving averages in their calculations may require many elapsed realtime bars before they can calculate.
You might prefer drastically reducing the periods of the moving averages, or using the volume columns mode, which displays instant values, instead of the line.
Volume Delta Balances
This indicator uses a variety of methods to evaluate five volume delta balances and derive other values from those balances. The five balances are:
1 — On Bar Balance : This is the only balance using instant values; it is simply the subtraction of the Sell volume from the Buy volume on the bar.
2 — Average Balance : Calculates a distinct EMA for both the Buy and Sell volumes, and subtracts the Sell EMA from the Buy EMA.
3 — Momentum Balance : Starts by calculating, separately for both Buy and Sell volumes, the difference between the same EMAs used in "Average Balance" and
an SMA of double the period used for the "Average Balance" EMAs. The difference for the Sell side is subtracted from the difference for the Buy side,
and an RSI of that value is calculated and brought over the −50/+50 scale.
4 — Relative Balance : The reference values used in the calculation are the Buy and Sell EMAs used in the "Average Balance".
From those, we calculate two intermediate values using how much the instant Buy and Sell volumes on the bar exceed their respective EMA — but with a twist.
If the bar's Buy volume does not exceed the EMA of Buy volume, a zero value is used. The same goes for the Sell volume with the EMA of Sell volume.
Once we have our two intermediate values for the Buy and Sell volumes exceeding their respective MA, we subtract them. The final "Relative Balance" value is an ALMA of that subtraction.
The rationale behind using zero values when the bar's Buy/Sell volume does not exceed its EMA is to only take into account the more significant volume.
If both instant volume values exceed their MA, then the difference between the two is the signal's value.
The signal is called "relative" because the intermediate values are the difference between the instant Buy/Sell volumes and their respective MA.
This balance flatlines when the bar's Buy/Sell volumes do not exceed their EMAs, which makes it useful to spot areas where trader interest dwindles, such as consolidations.
The smaller the period of the final value's ALMA, the more easily you will see the balance flatline. These flat zones should be considered no-trade zones.
5 — Percent Balance : This balance is the ALMA of the ratio of the "On Bar Balance" value, i.e., the volume delta balance on the bar (which can be positive or negative),
over the total volume for that bar.
From the balances and marker conditions, two more values are calculated:
1 — Marker Bias : It sums the up/down (+1/‒1) occurrences of the markers 1 to 4 over a period you define, so it ranges from −4 to +4, times the period.
Its calculation will depend on the modes used to calculate markers 3 and 4.
2 — Combined Balances : This is the sum of the bull/bear (+1/−1) states of each of the five balances, so it ranges from −5 to +5.
█ FEATURES
The indicator has two main modes of operation: Columns and Line .
Columns
• In Columns mode you can display stacked Buy/Sell volume columns.
• The buy section always appears above the centerline, the sell section below.
• The top and bottom sections can be colored independently using eight different methods.
• The EMAs of the Buy/Sell values can be displayed (these are the same EMAs used to calculate the "Average Balance").
Line
• Displays one of seven signals: the five balances or one of two complementary values, i.e., the "Marker Bias" or the "Combined Balances".
• You can color the line and its fill using independent calculation modes to pack more information in the display.
You can thus appraise the state of 3 different values using the line itself, its color and the color of its fill.
• A "Divergence Levels" feature will use the line to automatically draw expanding levels on divergence events.
Default settings
Using the indicator's default settings, this is the information displayed:
• The line is calculated on the "Average Balance".
• The line's color is determined by the bull/bear state of the "Percent Balance".
• The line's fill gradient is determined by the advances/declines of the "Momentum Balance".
• The orange divergence dots are calculated using discrepancies between the polarity of the "On Bar Balance" and the chart's bar.
• The divergence levels are determined using the line's level when a divergence occurs.
• The background's fill gradient is calculated on advances/declines of the "Marker Bias".
• The chart bars are colored using advances/declines of the "Relative Balance". Divergences are shown in orange.
• The intrabar timeframe is automatically determined from the chart's timeframe so that a minimum of 50 intrabars are used to calculate volume delta on historical bars.
Alerts
The configuration of the marker conditions explained further is what determines the conditions that will trigger alerts created from this script. Note that simply selecting the display of markers does not create alerts. To create an alert on this script, you must use ALT-A from the chart. You can create multiple alerts triggering on different conditions from this same script; simply configure the markers so they define the trigger conditions for each alert before creating the alert. The configuration of the script's inputs is saved with the alert, so from then on you can change them without affecting the alert. Alert messages will mention the marker(s) that triggered the specific alert event. Keep in mind, when creating alerts on small chart timeframes, that discrepancies between alert triggers and markers displayed on your chart are to be expected. This is because the alert and your chart are running two distinct instances of the indicator on different servers and different feeds. Also keep in mind that while alerts only trigger on confirmed conditions, they are calculated using realtime calculation mode, which entails that if you refresh your chart and elapsed realtime bars recalculate as historical bars using intrabar inspection, markers will not appear in the same places they appeared in realtime. So it's important to understand that even though the alert conditions are confirmed when they trigger, these alerts will repaint.
Let's go through the sections of the script's inputs.
Columns
The size of the Buy/Sell columns always represents their respective importance on the bar, but the coloring mode for tops and bottoms is independent. The default setup uses a standard coloring mode where the Buy/Sell columns are always in the bull/bear color with a higher intensity for the winning side. Seven other coloring modes allow you to pack more information in the columns. When choosing to color the top columns using a bull/bear gradient on "Average Balance", for example, you will have bull/bear colored tops. In order for the color of the bottom columns to continue to show the instant bar balance, you can then choose the "On Bar Balance — Dual Solid Colors" coloring mode to make those bars the color of the winning side for that bar. You can display the averages of the Buy and Sell columns. If you do, its coloring is controlled through the "Line" and "Line fill" sections below.
Line and Line fill
You can select the calculation mode and the thickness of the line, and independent calculations to determine the line's color and fill.
Zero Line
The zero line can display dots when all five balances are bull/bear.
Divergences
You first select the detection mode. Divergences occur whenever the up/down direction of the signal does not match the up/down polarity of the bar. Divergences are used in three components of the indicator's visuals: the orange dot, colored chart bars, and to calculate the divergence levels on the line. The divergence levels are dynamic levels that automatically build from the line's values on divergence events. On consecutive divergences, the levels will expand, creating a channel. This implementation of the divergence levels corresponds to my view that divergences indicate anomalies, hesitations, points of uncertainty if you will. It precludes any attempt to identify a directional bias to divergences. Accordingly, the levels merely take note of divergence events and mark those points in time with levels. Traders then have a reference point from which they can evaluate further movement. The bull/bear/neutral colors used to plot the levels are also congruent with this view in that they are determined by the line's position relative to the levels, which is how I think divergences can be put to the most effective use. One of the coloring modes for the line's fill uses advances/declines in the line after divergence events.
Background
The background can show a bull/bear gradient on six different calculations. As with other gradients, you can adjust its brightness to make its importance proportional to how you use it in your analysis.
Chart bars
Chart bars can be colored using seven different methods. You have the option of emptying the body of bars where volume does not increase, as does my TLD indicator, and you can choose whether you want to show divergences.
Intrabar Timeframe
This is the intrabar timeframe that will be used to calculate volume delta using intrabar inspection on historical bars. You can choose between four modes. The three "Auto-steps" modes calculate, from the chart's timeframe, the intrabar timeframe where the said number of intrabars will make up the dilation of chart bars. Adjustments are made for non-24x7 markets. "Fixed" mode allows you to select the intrabar timeframe you want. Checking the "Show TF" box will display in the lower-right corner the intrabar timeframe used at any given moment. The proper selection of the intrabar timeframe is important. It must achieve maximal granularity to produce precise results while not unduly slowing down calculations, or worse, causing runtime errors. Note that historical depth will vary with the intrabar timeframe. The smaller the timeframe, the shallower historical plots you will be.
Markers
Markers appear when the required condition has been confirmed on a closed bar. The configuration of the markers when you create an alert is what determines when the alert will trigger. Five markers are available:
• Balances Agreement : All five balances are either bullish or bearish.
• Double Bumps : A double bump is two consecutive up/down bars with +/‒ volume delta, and rising Buy/Sell volume above its average.
• Divergence confirmations : A divergence is confirmed up/down when the chosen balance is up/down on the previous bar when that bar was down/up, and this bar is up/down.
• Balance Shifts : These are bull/bear transitions of the selected signal.
• Marker Bias Shifts : Marker bias shifts occur when it crosses into bull/bear territory.
Periods
Allows control over the periods of the different moving averages used to calculate the balances.
Volume Discrepancies
Stock exchanges do not report the same volume for intraday and daily (or higher) resolutions. Other variations in how volume information is reported can also occur in other markets, namely Forex, where volume irregularities can even occur between different intraday timeframes. This will cause discrepancies between the total volume on the bar at the chart's timeframe, and the total volume calculated by adding the volume of the intrabars in that bar's dilation. This does not necessarily invalidate the volume delta information calculated from intrabars, but it tells us that we are using partial volume data. A mechanism to detect chart vs intrabar timeframe volume discrepancies is provided. It allows you to define a threshold percentage above which the background will indicate a difference has been detected.
Other Settings
You can control here the display of the gray dot reminder on realtime bars, and the display of error messages if you are using a chart timeframe that is not greater than the fixed intrabar timeframe, when you use that mode. Disabling the message can be useful if you only use realtime mode at chart timeframes that do not support intrabar inspection.
█ RAMBLINGS
On Volume Delta
Volume is arguably the best complement to interpret price action, and I consider volume delta to be the most effective way of processing volume information. In periods of low-volatility price consolidations, volume will typically also be lower than normal, but slight imbalances in the trend of the buy/sell volume balance can sometimes help put early odds on the direction of the break from consolidation. Additionally, the progression of the volume imbalance can help determine the proximity of the breakout. I also find volume delta and the number of divergences very useful to evaluate the strength of trends. In trends, I am looking for "slow and steady", i.e., relatively low volatility and pauses where price action doesn't look like world affairs are being reassessed. In my personal mythology, this type of trend is often more resilient than high-volatility breakouts, especially when volume balance confirms the general agreement of traders signaled by the low-volatility usually accompanying this type of trend. The volume action on pauses will often help me decide between aggressively taking profits, tightening a stop or going for a longer-term movement. As for reversals, they generally occur in high-volatility areas where entering trades is more expensive and riskier. While the identification of counter-trend reversals fascinates many traders to no end, they represent poor opportunities in my view. Volume imbalances often precede reversals, but I prefer to use volume delta information to identify the areas following reversals where I can confirm them and make relatively low-cost entries with better odds.
On "Buy/Sell" Volume
Buying or selling volume are misnomers, as every unit of volume transacted is both bought and sold by two different traders. While this does not keep me from using the terms, there is no such thing as “buy only” or “sell only” volume. Trader lingo is riddled with peculiarities.
Divergences
The divergence detection method used here relies on a difference between the direction of a signal and the polarity (up/down) of a chart bar. When using the default "On Bar Balance" to detect divergences, however, only the bar's volume delta is used. You may wonder how there can be divergences between buying/selling volume information and price movement on one bar. This will sometimes be due to the calculation's shortcomings, but divergences may also occur in instances where because of order book structure, it takes less volume to increase the price of an asset than it takes to decrease it. As usual, divergences are points of interest because they reveal imbalances, which may or may not become turning points. To your pattern-hungry brain, the divergences displayed by this indicator will — as they do on other indicators — appear to often indicate turnarounds. My opinion is that reality is generally quite sobering and I have no reliable information that would tend to prove otherwise. Exercise caution when using them. Consequently, I do not share the overwhelming enthusiasm of traders in identifying bullish/bearish divergences. For me, the best course of action when a divergence occurs is to wait and see what happens from there. That is the rationale underlying how my divergence levels work; they take note of a signal's level when a divergence occurs, and it's the signal's behavior from that point on that determines if the post-divergence action is bullish/bearish.
Superfluity
In "The Bed of Procrustes", Nassim Nicholas Taleb writes: To bankrupt a fool, give him information . This indicator can display lots of information. While learning to use a new indicator inevitably requires an adaptation period where we put it through its paces and try out all its options, once you have become used to it and decide to adopt it, rigorously eliminate the components you don't use and configure the remaining ones so their visual prominence reflects their relative importance in your analysis. I tried to provide flexible options for traders to control this indicator's visuals for that exact reason — not for window dressing.
█ LIMITATIONS
• This script uses a special characteristic of the `security()` function allowing the inspection of intrabars — which is not officially supported by TradingView.
It has the advantage of permitting a more robust calculation of volume delta than other methods on historical bars, but also has its limits.
• Intrabar inspection only works on some chart timeframes: 3, 5, 10, 15 and 30 minutes, 1, 2, 3, 4, 6, and 12 hours, 1 day, 1 week and 1 month.
The script’s code can be modified to run on other resolutions.
• When the difference between the chart’s timeframe and the intrabar timeframe is too great, runtime errors will occur. The Auto-Steps selection mechanisms should avoid this.
• All volume is not created equally. Its source, components, quality and reliability will vary considerably with sectors and instruments.
The higher the quality, the more reliably volume delta information can be used to guide your decisions.
You should make it your responsibility to understand the volume information provided in the data feeds you use. It will help you make the most of volume delta.
█ NOTES
For traders
• The Data Window shows key values for the indicator.
• While this indicator displays some of the same information calculated in my Delta Volume Columns ,
I have elected to make it a separate publication so that traders continue to have a simpler alternative available to them. Both code bases will continue to evolve separately.
• All gradients used in this indicator determine their brightness intensities using advances/declines in the signal—not their relative position in a pre-determined scale.
• Volume delta being relative, by nature, it is particularly well-suited to Forex markets, as it filters out quite elegantly the cyclical volume data characterizing the sector.
If you are interested in volume delta, consider having a look at my other "Delta Volume" indicators:
• Delta Volume Realtime Action displays realtime volume delta and tick information on the chart.
• Delta Volume Candles builds volume delta candles on the chart.
• Delta Volume Columns is a simpler version of this indicator.
For coders
• I use the `f_c_gradientRelativePro()` from the PineCoders Color Gradient Framework to build my gradients.
This function has the advantage of allowing begin/end colors for both the bull and bear colors. It also allows us to define the number of steps allowed for each gradient.
I use this to modulate the gradients so they perform optimally on the combination of the signal used to calculate advances/declines,
but also the nature of the visual component the gradient applies to. I use fewer steps for choppy signals and when the gradient is used on discrete visual components
such as volume columns or chart bars.
• I use the PineCoders Coding Conventions for Pine to write my scripts.
• I used functions modified from the PineCoders MTF Selection Framework for the selection of timeframes.
█ THANKS TO:
— The devs from TradingView's Pine and other teams, and the PineCoders who collaborate with them. They are doing amazing work,
and much of what this indicator does could not be done without their recent improvements to Pine.
— A guy called Kuan who commented on a Backtest Rookies presentation of their Volume Profile indicator using a `for` loop.
This indicator started from the intrabar inspection technique illustrated in Kuan's snippet.
— theheirophant , my partner in the exploration of the sometimes weird abysses of `security()`’s behavior at intrabar timeframes.
— midtownsk8rguy , my brilliant companion in mining the depths of Pine graphics.

BK AK-Flag Formations🏴☠️ BK AK-Flag Formations — Raise the standard. Drive the line. Continue the assault. 🏴☠️
Built for traders who exploit momentum with discipline: flagpoles, flags, and pennants detected, tagged, and briefed—so you press advantage instead of hesitating.
🎖️ Full Credit (Engine + Logic — Trendoscope)
Original foundation (Trendoscope Flags & Pennants):
The entire detection engine—multi-zigzag swing extraction, pivot logic, pattern validation, classification framework, and drawing architecture—is Trendoscope. He’s the architect of the core system.
I’m not claiming the engine. I’m shipping a cleaner, more tactical interface layer on top of his work.
🧩 BK Enhancements (on top of Trendoscope)
Purpose: read continuation faster with less chart noise.
Short-form pattern tags so structure stays obvious without burying price:
BF / BeF / BP / BeP / F / P / UF / DF / RF / FF / AF / DeF
Label transparency controls (text + background), plus separate transparency control for short labels
Hover tooltips (toggle): hover the tag to reveal full pattern name + bias (Bullish / Bearish / Neutral)
Upgraded alert system: filters by Bias (Bullish/Bearish/Neutral) and Type (Flag / Pennant), with clearer alert messages
Pattern border extension (optional): extends the two pattern boundary lines forward by N bars so your levels stay mapped for break/retest planning
Everything else is Trendoscope’s architecture and math.
🧠 What It Does (The Mission)
This script hunts continuation formations that form after a strong impulse move:
Detects the flagpole (impulse)
Validates a consolidation structure (flag or pennant)
Tags it cleanly with short codes
Optional hover-briefing gives the long name + bias exactly when you need it
You get continuation structure in real time, across multiple swing sensitivities.
🧭 How It Detects (So You Know It’s Not Random)
This isn’t “pattern art.” It’s rule-based geometry + swing logic:
1) Multi-Zigzag Sweep (micro → macro)
Runs up to 4 zigzag engines so it catches both tight and larger continuations.
(Default BK tuning uses 4 levels with different swing lengths/depths.)
2) Quality Filters (you control strictness)
Key scanning controls:
Error Threshold: tolerance used during trendline validation
Flat Threshold: what qualifies as “flat” vs sloped
Max Retracement (default 0.618): limits how deep the consolidation can retrace the impulse
Verify Bar Ratio (optional): checks proportion/spacing of pivots, not just price
Avoid Overlap: prevents stacking formations on top of each other
Repaint option: allows refinement if better coordinates form (for real-time users)
3) Classification (Flag vs Pennant)
Once the engine confirms an impulse + valid consolidation, it classifies:
Flag = orderly channel/wedge-style consolidation after the pole
Pennant = tighter triangle-style compression after the pole
Then it labels with bias based on direction and formation context.
🏳️ Read the Continuation (Short Codes that Actually Matter)
BF — Bull Flag: strong pole → controlled pullback; watch for break + continuation expansion
BP — Bull Pennant: thrust → tight compression; expansion confirms carry
BeF — Bear Flag: down impulse → weak rallies; breakdown favors continuation lower
BeP — Bear Pennant: pause beneath resistance; release favors trend continuation
F / P: generic flag / pennant tags when the system can’t (or shouldn’t) over-specify
Standards aren’t decoration—they’re orders.
🧑🏫 Mentor A.K.
A.K. is the discipline behind this release.
No chasing. No gambling. No emotional entries.
He drilled one rule into everything: structure first, then execution—never the reverse.
This indicator exists to make that possible under pressure.
🤝 Give Forward (The Code of the Crew)
If this tool sharpens your edge:
Teach one trader how to read continuation properly (pole → base → trigger → invalidation)
Share process, not just screenshots (entry logic, stop logic, management plan)
If you build on open work: credit loudly and contribute improvements back when you can
Tools multiply force. Character decides the outcome.
👑 Respect to King Solomon (Wisdom > Impulse)
“Plans are established by counsel; by wise guidance wage war.” — Proverbs 20:18
Continuation trading is the same: impulse → formation → execution.
BK AK-Flag Formations — when the standard rises, the line advances.
Gd bless. 🙏

Market Exhaustion [WavesUnchained]Market Exhaustion
Multi-oscillator exhaustion detector combining MFI + optional CCI, HTF bias, StochRSI timing, and a divergence engine with an Exhaustion Score (0-100).
CORE CONCEPT
- Detects exhaustion via regular divergences anchored on price pivots
- Scores each divergence (0-100) using 5 components
- Line width = quality, color = direction (never thicker than main line)
OSCILLATOR MODES
- MFI : Engine uses MFI only
- CCI : Engine uses CCI mapped to 0-100
- MFI+CCI : Both plotted, engine source selectable (MFI or CCI)
EXHAUSTION SCORE (0-100)
1. Sequence (Div 1/2/3...) - repeated attempts increase score
2. Fatigue - no new oscillator extreme over lookback
3. Formation Time - bars between pivots
4. Reaction - post-divergence bounce/drop vs ATR
5. Impulse - MFI/CCI delta + swing size
DIVERGENCE ENGINE
- Price-pivot anchored (LL/HH) with osc confirmation (HL/LH)
- OS/OB gating with dynamic zones + fallback to 20/80
- Tolerant direction checks (price + osc eps)
- Auto cleanup (max objects)
HTF CONTEXT
- Auto-HTF MFI bias label
- Optional HTF filter for signals
- Bias bonus (optional) for Exhaustion Score
SIGNALS & TIMING
- StochRSI timing + MFI zone confirmation
- Context + timing signals (L/S markers)
- Zone confirm bars
VISUALIZATION
- Color-coded MFI line (OB/OS/neutral)
- Optional CCI (mapped 0-100) line
- Divergence line width = quality, endpoint markers
- Optional mid-label with score
- Dynamic zones + optional fill
BEST USE CASES
- Reversal scouting at extremes
- Filtering weak swings
- 15M-4H swing exhaustion reads
- HTF bias + divergence confluence
Version: 1.0.0
Author: WavesUnchained
Pine Script: v6
