Market Bias (CEREBR)Hello Everyone. I hope you are all doing great. It's been a long time since I posted my first script here, and I got a lot of response from that.
So, I thought I should share this script also to everyone, and anyone that may find it useful. Personally, I use it to tell the general market conditions.
Here's how I works : The script tries to determine the overall direction of the market, using smoothed Heiken Ashi candles. The coloring system (using bright and dark colors) is an attempt to detect strong market and weak market conditions. There's also an oscillator within the script, but for now it isn't plotted. Credits to @jackvmk, I used part of his open-script code in this indicator.\
I have considered using the slope of the indicator plot as a filter for ranging market conditions. The plot goes relatively flat in 'flat' markets. However, I have not done anything about that yet. Maybe some other time.
I hope you find this useful. If you find a way to use this, please share it with the community in the comment section.
NOTE: THIS IS BY NO MEANS FINANCIAL ADVICE. You'll have to make your studies and come up with a way to apply this indicator to your trading style and strategy.
By the way, I would be going with the name 'CEREBR' for any subsequent scripts I release from now on.
Happy Trading, guys.
Search in scripts for "bias"

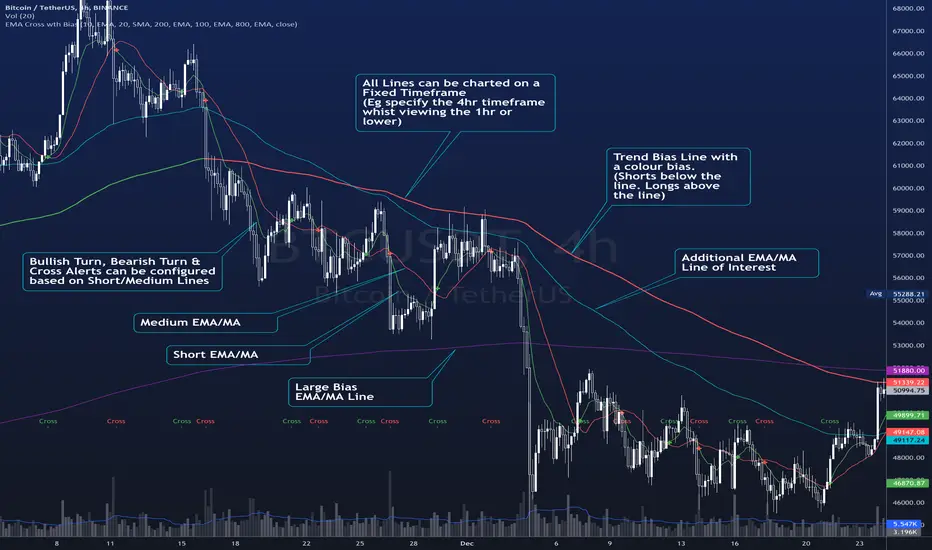
EMA Cross wth BiasThe Script plots 4 Moving averages.
1. Short Moving Average
2. Medium Moving Average
2. Trend Bias (Usually a much slower Moving Average) - Plots in Green when price action is above the line and Red for when price action is below the line.
3. Alerts are triggered when the short MA/ EMA turns. Can be used for Early Entry signals and Exits.
4. Alerts are triggered for Crosses of the Short and Medium MA
Each Moving average line can be confirmed to be a Simple MA or and EMA
Volume BiasHere’s an indicator that calculates the difference between the average distance we need to look back to find the up and down volume equal to the total volume of the last n bars. The further we need to look back to find the up or down volume, the more bearish or bullish its value is.
A not-yet published indicator from the PS-V5 blog!

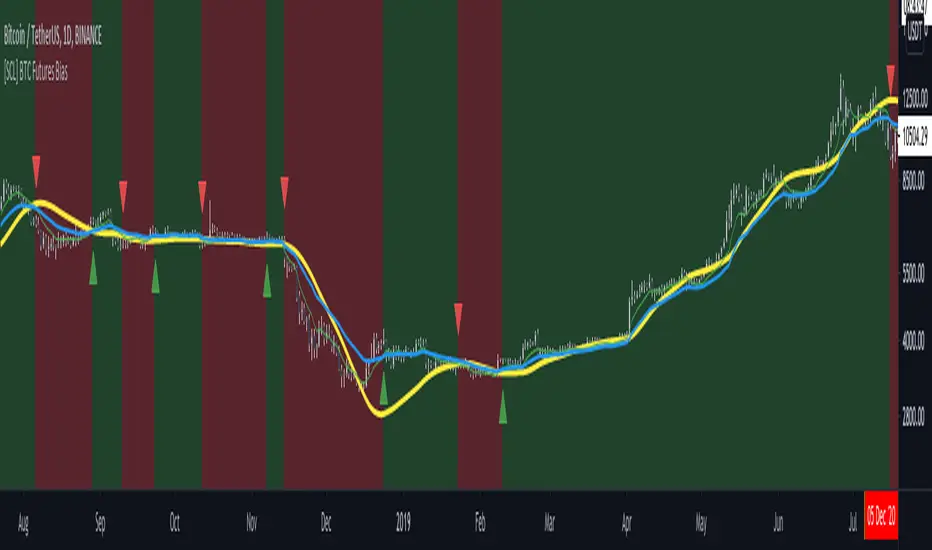
[SCL] BTC Futures Daily Bias (CME BTC1!)Derives a bias for BTC/USD on the daily timeframe and displays it on the chart in a configurable way. Takes price data from the CME BTC futures chart (exchange is configurable), regardless of what symbol you run it on.
Why? Because futures are said to give cleaner charts, but most traders are not trading CME futures. So you can use this indicator on whichever exchange you want to chart Bitcoin on.
Uses the 80D HMA and the 8D and 21D EMAs by default; all intervals are configurable.
Trends & RangesTrends & Ranges uses EMA ATR bands as a SuperTrend indicator.
How to use:
This indicator can be used to give you a direction bias, with the added function to create ranges which often lead to reversals or flat trading periods. Trade the break-out or wait for pull backs in the direction of the trend.
I'm not great at explaining stuff and will probably make things only more complicated, so I won't bother for now,
but if you have a question on how the script works I will gladly give it a try.
The option "Flexible Trends" will disable the min/max function (trailing or non trailing).
Flexible Trends enabled:
Flexible Trends disabled:
Settings are not optimized for any asset or time frame, you will have to do that for yourself. Feel free to share them in the comments.
Thanks for showing interest, enjoy and good luck! :)

Separated Moving Average [2] - evoThis is an updated version on one of my previous scripts. Small explanation in the description.
This new script gives you a direction bias based on closing above and below the lines, with an option to filter fake signals by waiting for one more candle close.
Also added more moving averages compared to the first script (built ins + donchian)
Hope you like it!
(If you're a coder with a slightly larger brain than me, please tell me in the comments if I fixed the repainting problem correctly, I'm not 100% sure..)

7EMA_5MA (G/D + Bias + 12/26 Signal)This script alow you to survey multiple crossing signals as Golden/Death cross (MA50/200), Institutional Bias (EMA9/18), or EMA 12/26 crossing. You can show/hide all EMAs/MAs and show/hide all signals. Default config displays EMA 50/100/200 and MA 20. Full script includes display of EMA 9/18/12/26/50/100/200 and MA 20/21/50/100/200.

RSI direction bias - JDThis simple indicator gives you a bias on the market that can be used as a filter, an entry indicator for pullbacks,...
Enjoy!
JD.
#NotTradingAdvice
#DYOR


2R overlay positive biasHere is a pretty clean 2R - risk reward assessment that is overlaid on the price action. Positive bias, kind of lazy on the release but you can edit to change look back period or drop into one of your indicator edits as another metric for trade risk. If this helps drop a comment or thumbs up.
-Squam

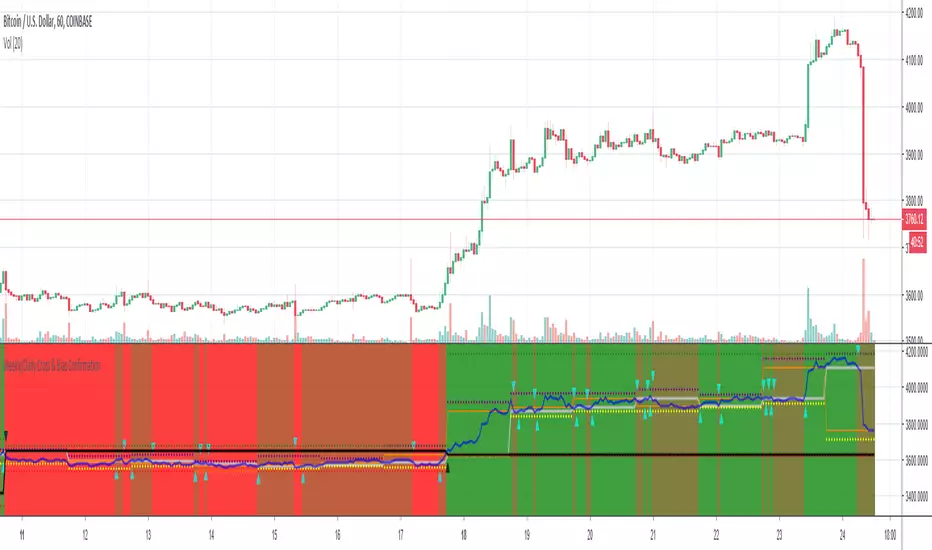
Weekly/Daily Cross & Bias ConfirmationThis indicator plots the weekly and daily open in addition to a current close price line.
It also signals when price closes above or below the daily and weekly opens.
Also, the bull/bear bias is painted on this indicator as well.
Black is the weekly open
Silver is the daily open
Weekly is default black arrows. Up is going above open, down is going below
Daily is default aqua arrows. Up is going above, down is going below
RSI + Volume + Bias linesJust added lines for bullish / bearish bias regions to the indicator from LazyBear


Inline Institutional BiasTrend identification indicator. Estimates (higher-timeframe) market state using the "Institutional Bias" MA relationship (9ema - 18ema, 1D timeframe). A "reference" MA (30sma - TRI's preferred MA for Trade Location) is then plotted, and colour-coded according to higher-timeframe market state.
NOTE: All MA lengths, types, and the timeframe to use are configurable, but default as above. All MAs are calculated using the "IB timeframe", even when zoomed in.

Bias Table-manualIt is just at tabular column to manually update Bullish/Bearish for multiple timeframes. Provided date option which is also manual, to denote when the analysis was done and table updated. This will be helpful for multiple stocks/securities analysis on regular basis

Bias Ratio-ETH-3H @CTTC5108Most of the code of this strategy should be my own original.
This Ethereum 3-hour time cycle strategy can be traced back to February 24, 2023. Although the profit and winning rate are not high, it is still relatively stable.
This strategy uses the deviation rate to enter the market. Invest 10% of the principal each time.
The limit start time adopts a rolling design (should be original).
Real-time retracement and maximum retracement are accurately calculated (should be original).
Adopt segmented stop profit (optional) design.
Open source for learning and other use.

Risk Adjusted Geometric Exponent [VynthraQuant]RAGE Index (Risk-Adjusted Geometric Exponent)
Overview
The RAGE Index is a quantitative momentum oscillator that measures the efficiency and quality of an asset's price trend. Standing for Risk-Adjusted Geometric Exponent , this indicator goes beyond simple price action by evaluating the average logarithmic growth rate relative to the asset's volatility.
In institutional finance, it is not just about how much an asset moves, but how it moves. RAGE identifies trends that exhibit high compounding growth with minimal "noise" or volatility.
The Logic Behind RAGE
The indicator is built on two core quantitative pillars:
1. Geometric Exponent (GE): Instead of simple percentage changes, we calculate the geometric mean of log-returns. This represents the true compounding "velocity" of the price.
2. Volatility Normalization: We divide the GE by the standard deviation of returns (Volatility) over a specific lookback period.
How to Interpret the RAGE Index
* The Zero Line: The most critical level. When RAGE crosses above 0, the asset has entered a state of positive geometric growth. Below 0, the asset is in a state of efficient decay.
* Trend Quality: A rising RAGE value indicates that the trend is becoming more "efficient", growth is increasing while volatility is staying low or decreasing.
* Color-Coded Candles: The script features a `force_overlay` function that colors the candles on your main chart.
* Bullish Color: Efficient growth detected (Long bias).
* Bearish Color: Efficient decay detected (Short bias).
Key Features
* Logarithmic Accuracy: Uses log-returns to ensure time-additivity and eliminate the bias found in standard percentage calculations.
* Adaptive to Volatility: Unlike a standard RSI or MACD, RAGE penalizes "choppy" price action, helping you stay out of sideways markets.
* Optimized Performance: Written in Pine Script v6 with high-efficiency math to ensure fast loading even on lower timeframes.
Settings
* GE Lookback: The window used to calculate the average growth rate.
* Volatility Lookback: The window used to measure the "risk" or noise of the price action.
General Disclaimer
This indicator is for informational and educational purposes only. It does not constitute financial advice. The creator bears no responsibility for any financial decisions or losses resulting from its use. Past performance is not indicative of future results.
Islamic Disclaimer
All trading activity should be approached with awareness of halal and haram principles. Ensure your investments, instruments, and methods align with Islamic ethical standards. This tool does not promote speculative or impermissible practices.

Futures Ultra CVD (Pure )Futures Ultra CVD (Pure)
Futures Ultra CVD (Pure) is a volume-driven Cumulative Volume Delta (CVD) indicator designed to expose real buying and selling pressure behind price movement. Unlike price-only indicators, this script analyzes how volume is distributed within each bar to determine whether aggressive buyers or sellers are in control, then tracks how that pressure evolves over time.
This version is intentionally pure and ungated: it does not rely on external symbols, market filters, session bias, or macro confirmation. All signals are derived strictly from price, volume, and delta behavior of the active chart, making it suitable for futures, equities, crypto, and FX.
Core Concept: How CVD Is Calculated
For each bar, volume is split into buying pressure and selling pressure using the bar’s price position:
Buying volume increases as price closes closer to the high
Selling volume increases as price closes closer to the low
The difference between buying and selling volume forms Delta:
Positive delta = net aggressive buying
Negative delta = net aggressive selling
This delta is then accumulated into Cumulative Volume Delta (CVD) using one of three user-selectable modes:
Total – running cumulative sum of all delta values
Periodic – rolling sum over a fixed lookback period
EMA – smoothed cumulative delta using an exponential average
This flexibility allows traders to choose between raw order-flow tracking or smoother, trend-like behavior depending on timeframe and instrument.
Visual Structure & Histogram Logic
The CVD is displayed as a column histogram, not a line, to emphasize momentum and pressure shifts.
Enhanced coloring provides additional context:
Brighter green/red bars indicate increasing momentum
Muted colors indicate stalling or weakening pressure
Optional footprint-style highlights appear when buy or sell volume overwhelms the opposite side by a user-defined imbalance factor
This allows traders to visually distinguish:
Strength vs weakness
Continuation vs exhaustion
Absorption and aggressive participation
Built-In Order Flow Signals
The script automatically detects and labels key order-flow events:
Strong Delta
Triggered when delta exceeds a user-defined threshold, highlighting unusually aggressive buying or selling.
Delta Surge
Detects sudden expansion in delta compared to the prior bar, often associated with breakout attempts or liquidation events.
Zero-Line Crosses
Marks transitions between net bullish and bearish participation as CVD crosses above or below zero.
CVD Continuation Logic (Trend Confirmation)
Beyond raw delta, the script evaluates CVD structure to identify continuation conditions:
A bullish continuation requires:
Positive and rising CVD
Strong buy delta
Confirmation from at least one of the following:
CVD above its EMA and SMA
Bullish price expansion
Sustained positive delta pressure
Bearish continuation follows the inverse logic.
These continuation signals are designed to confirm participation strength, not predict reversals.
Conflict Detection (Divergence Warning)
The indicator also flags conflict conditions, where:
Strong buying occurs while CVD remains negative
Strong selling occurs while CVD remains positive
These scenarios often precede failed breakouts, absorption zones, or short-term reversals and can be used as cautionary signals.
Alerts & Practical Use
All major events include built-in alerts:
Strong delta
Delta surge
CVD continuations
Zero-line crosses
Buy/sell imbalances
Conflict signals
Alerts can be set to trigger on bar close or intrabar in real time, depending on trader preference.
How Traders Typically Use This Indicator
Confirm breakouts with delta participation
Validate trends using CVD continuation instead of price alone
Identify absorption or exhaustion via conflicts and imbalances
Combine with price structure, VWAP, or market profile tools
This script is not a trading system by itself. It is a decision-support tool designed to reveal what price alone cannot: who is actually in control of the market.
On-Chart Symbols & What They Mean
This script uses a small number of visual symbols to communicate order-flow events clearly and consistently. All symbols are derived directly from the Cumulative Volume Delta calculations described above.
Δ+ (Green Up Arrow)
Strong Buy Delta
Indicates that buying pressure on the current bar exceeded the Strong Delta Threshold
Represents aggressive market buying dominating selling volume
Often appears during breakouts, trend acceleration, or initiative buying
This symbol does not imply direction by itself; it only confirms strong buyer participation.
Δ− (Red Down Arrow)
Strong Sell Delta
Indicates that selling pressure on the current bar exceeded the Strong Delta Threshold
Represents aggressive market selling dominating buying volume
Often appears during breakdowns, liquidation events, or initiative selling
Like Δ+, this symbol measures participation strength, not trade direction.
↑ (Green Label Up)
CVD Bullish Continuation
Appears when all of the following are present:
CVD is positive and increasing
Strong buy delta is detected
At least one confirmation condition is met:
CVD is above its EMA and SMA
Price shows bullish expansion
Consecutive positive delta bars (sustained buying pressure)
This symbol highlights trend continuation supported by volume, not a reversal signal.
↓ (Red Label Down)
CVD Bearish Continuation
Appears when:
CVD is negative and decreasing
Strong sell delta is detected
At least one confirmation condition is met:
CVD is below its EMA and SMA
Price shows bearish expansion
Consecutive negative delta bars (sustained selling pressure)
This indicates bearish continuation with participation confirmation.
Cyan / Orange Histogram Bars
Footprint-Style Volume Imbalance
Cyan bars indicate buy volume exceeds sell volume by the imbalance factor
Orange bars indicate sell volume exceeds buy volume by the imbalance factor
These bars highlight areas where one side is overwhelming the other, often associated with absorption, initiative moves, or failed auctions.
Bright vs Muted Histogram Colors
CVD Momentum State
Bright colors = CVD increasing in the direction of its current bias
Muted colors = CVD losing momentum or stalling
This allows quick visual identification of strengthening vs weakening participation.
Conflict Alerts (No Symbol by Default)
Delta vs CVD Disagreement
These conditions trigger alerts (but no fixed chart icon):
Strong buying while CVD remains negative
Strong selling while CVD remains positive
Conflicts often signal absorption, trap conditions, or short-term exhaustion.
Important Usage Notes
All symbols are informational, not trade entries.
Signals are calculated from price-based volume distribution, not true bid/ask data.
Results depend on the quality of volume data provided by the exchange and TradingView.

Market Risk Regime Dashboard (SPX/VIX)Market Risk Regime Dashboard (SPX–VIX)
Market Risk Regime Dashboard (SPX–VIX) is a context and confirmation tool designed to classify market conditions as Risk-On, Risk-Off, or Neutral by analyzing the real-time relationship between the S&P 500 Index (SPX) and the CBOE Volatility Index (VIX).
Rather than predicting price direction, this script focuses on identifying market environment and participation conditions that often influence trade quality, position sizing, and strategy selection.
Core Concept: SPX vs VIX Risk Regimes
The indicator operates on a well-documented market relationship:
SPX reflects equity risk appetite and directional participation
VIX reflects implied volatility and risk aversion
The script classifies conditions as:
Risk-On → SPX bullish and VIX falling
Risk-Off → SPX bearish and VIX rising
Neutral → Any mixed or non-aligned condition
This alignment is visualized using:
Background color on the chart
A compact dashboard table
Optional alerts
Trend Strength via Normalized EMA Distance (n-Value)
To quantify trend strength, the script computes a normalized trend metric (“n-value”) for SPX:
A fast EMA and slow EMA are calculated on SPX
The absolute distance between the EMAs is measured
That distance is normalized by an ATR-based volatility measure
The result is a dimensionless value that expresses trend strength relative to volatility, allowing comparisons across timeframes.
Higher n-values indicate stronger directional conditions, while lower values suggest compression or range behavior.
Dashboard Display
A movable on-chart table summarizes:
SPX directional bias (Bullish / Bearish / Neutral)
VIX behavior (Rising / Falling)
SPX n-value trend strength
This allows traders to quickly assess market context without switching symbols or charts.
Strong Candle Detection (SPX)
The script identifies strong directional candles on SPX using objective criteria:
Candle body must represent a minimum percentage of total range
Close must occur near the extreme (high for bullish, low for bearish)
Direction must align with candle body
When detected:
A triangle marker is plotted
The chart bar is optionally colored
Additional alerts can trigger when strong candles align with Risk-On or Risk-Off regimes
These signals are intended to highlight initiative participation, not standalone entries.
Visual & Alert Features
Background color reflects current risk regime:
Green = Risk-On
Red = Risk-Off
Gray = Neutral
Alerts available for:
Risk-On alignment
Risk-Off alignment
Neutral conditions
Strong candles aligned with risk regime
Elevated normalized trend strength (n-value range)
Alerts can be used for situational awareness rather than execution triggers.
How Traders Typically Use This Script
Filter trades based on broader market risk context
Adjust aggressiveness or size during Risk-On vs Risk-Off regimes
Confirm directional conviction when price action aligns with volatility behavior
Avoid forcing trades during neutral or conflicting environments
This script is not a trading system and does not provide entries or exits. It is a contextual decision-support tool designed to improve alignment between price action and market risk conditions.
