[DS]Bitcoin BTC ETH and others cryptos==DESCRIPTION - English version
The purpose of this script is to show information on graph that can help your decision to buy and sell cryptos.
The script is indicated for Position Trade (Long Term - Holder) and Swing Trade (Medium term).
Position Trade it is recommended to use the Weekly (W) and Daily (D) charts, Swing trade to use the 4H and 2H charts.
It is not advisable to use this indicator with graphic time frame less than 2 hours because the noise levels of information are very high.
An alert function has been inserted in the indicator and to activate this function you will need configure it in the Tradingview.
This alert will indicate the likely points of entry and exit of the asset.
**DESCRIÇÃO - Versão em Português
A proposta deste script é mostrar no gráfico informações que possam auxiliar a sua decisão de compra e venda de cryptos.
Este script é indicado para negociação Position Trade (Longo Prazo - Holders) e Swing Trade (Médio prazo).
Para Position Trade (Holders) é indicado utilizar os gráficos Semanal (W) e Diário (D), para Swing trade utilizar os gráficos 4H e 2H.
Não é aconselhável utilizar este indicador com tempos gráficos menores que 2hs pois os níveis de ruídos nas informação são muito altos.
Foi inserido no indicador uma função de alerta e para ativar esta função, você precisará configurá-la no seu Tradingview.
Este alerta irá indicar os provaveis pontos de entrada e saída do ativo.
====================================================================================================
** English Version
====================================================================================================
█ SETUP applied to Indicator
The setup is based on the average 8, 21 and 56 of the weekly chart (taught on youtube channel: Augusto Backes)
Price above the average 8 on the weekly, indicates that the market is UP trend, below the average 8 on the weekly that the market is DOWN trend
RSI greater than 60% the market is UP trend
RSI greater than 40% and lower 60% the market is in ACCUMULATION
RSI less than 40% the market DOWN trend
The weekly average 8 is represented in GREEN (Upward Trend) and RED (Downward Trend).
The weekly average 21 is represented in LIGHT ORANGE
The weekly average 56 is represented in LIGHT PURPLE
The crossing of weekly averages 8 and 21 is represented with a GREEN (HIGH trend) and RED (LOW trend) cross - this signal is disabled on the graph but you can enable it by clicking on the graph setup
█ FUNCTION USE
(1) Average 8, 21 and 56 on Weekly - show the average 8, 21, 56 weekly on graphic (Average 8 in color red and green, 21 - light orange, 56 light purple)
(2) Crossing of averages 8 and 21 Weekly - is not active but you can activate
(3) Calculation of RSI
(4) barcolor() - mark the candles with the green color (High market) and red color (Dow market)
(5) alertcondition() - you can active this alert on Tadingview
█ BUY AND SELL POINTS - likely points
The indication of the BUY position is shown by a green arrow pointing upwards and the sell position by a red arrow pointing downwards. Buy and sell indications are obtained from the divergence in the market trend.
█ THANK TO
PineCoders for everything they do, all the tools and help they provide, and their involvement in making a better community. All PineCoders, Pine Pros and Pine Wizards, people who share their work and knowledge because of it and helping others, I am so happy and so grateful.
█ NOTE
This indicator is not a buy and sell recommendation, it indicates the most likely buy and sell points. Every purchase and sale decision is your responsibility
*****************************************************************************************************
** Versão em Português
*****************************************************************************************************
█ SETUP aplicado no Indicador
O setup está baseado na média 8, 21, e 56 do gráfico semanal
Preço acima da média 8 no semanal indica que o mercado esta em tendência de ALTA, abaixo da média 8 no semanal que o mercado está em tendência de BAIXA
RSI maior que 60% o mercado está em ALTA
RSI maior que 40% e menor 60% o mercado está em ACUMULAÇÃO
RSI menor que 40% o mercado está em BAIXA
A média 8 semanal está representadas nas cores VERDE (Tendência de Alta) e VERMELHA (Tendência de Baixa).
A média 21 semanal está representada na cor laranja claro
A média 56 semanal está representada na cor roxa claro
O cruzamento das médias 8 e 21 semanal esta representado com uma cruz VERDE (Tendência de ALTA) e VERMELHA (Tendência de BAIXA) - este sinal esta desativado no gráfico mas você pode ativá-lo clicando no setup do gráfico
█ FUNÇÕES UTILIZADAS
(1) Média 8, 21 e 56 no Semanal - mostra a média 8, 21, e 56 no gráfico
(2) Cruzamento das médias 8 e 21 Semanal - não está ativo mas você pode ativá-lo
(3) Cálculo do RSI
(4) barcolor() - marca a vela (Candle) com a cor verde (Mercado em Alta) e a cor vermelha (Mercado em Baixa)
(5) alertcondition () - você pode ativar o alerta no Tradingview
█ PONTOS DE COMPRA E VENDA - prováveis pontos
A indicação da posição de COMPRA é apresentada por uma seta na cor verde apontada para cima e a posição de VENDA por uma seta na cor vermelha apontada para baixo. As indicações de compra e venda são obtidas a partir da divergência na tendência do mercado.
█ OBRIGADO PARA
PineCoders por tudo o que fazem, todas as ferramentas e ajuda que fornecem, e seu envolvimento em fazer uma comunidade melhor. Todos os PineCoders, Pine Pros e Pine Wizards, pessoas que compartilham seu trabalho e conhecimento por causa dele e ajudando os outros, estou muito feliz e muito grato.
█ NOTA
Este indicador não é uma recomendação de compra e venda ele indica os pontos mais prováveis de compra e venda. Toda decisão de compra e venda é de sua responsabilidade
Search in scripts for "bitcoin"

Asset through the lens of BTCIntended for the cryptocurrency asset class, this indicator will show via background color whether or not Bitcoin is above the 20w SMA and 21w EMA. This allows for a user to easily distinguish how the behavior of a crypto asset acts when BTC is above the bull market support band and below the bull market support band.

ATR Start & Stop BotThis script is using Average True Range (ATR) and works very well on the Bitcoin 4 hour timeframe to determine when to stop and start your bots.
It has a very similar visual to the EMA RSI Indicator found here:
This 'ATR Start & Stop Bot' is better because it has less confusion during sideways market movement.
As an example - You are using 3commas and have a Composite bot setup with several alt coins, you can use this indicator with the ' Stop bot ' alert to disable your composite bot from taking trades at times when the market is on a trend that looks in the red.
Alternatively you can use the ' Start bot ' alert to turn your bot back on during the green uptrends.
Using this indicator with these alerts on the Bitcoin 4-Hour chart add a great layer of automation to your already existing bots.
Credits:
Original 'ATR Stops' indicator belong to the user failathon and that script is found here:
Also credits to Dradian for the alert additions.

Chanu Delta IndicatorThe Chanu Delta Indicator was created as the price difference between the two markets using the principle that the Bitcoin price fluctuations in the BTCUSD market on the BYBIT exchange are greater in the BTCUSDT market. This indicator shows the strength of the current market's buys and sells, and helps in short-term trading.
Chanu Delta Indicator (Δ) = BTCUSD ($) - BTCUSDT ($) (Unit: Dollar, Source: Close)
● Δ > 100 : Strong Buy
● 20 < Δ < 100 : Buy
● -20 < Δ < 20 : Neutral
● -100 < Δ < -20 : Sell
● Δ < -100 : Strong Sell

Aggregated Volume Colored (Bitcoin, ETH, Altcoins, everything)BITSTAMP:BTCUSD
This indicator aggregates trading volume data of up to 10 symbols and can display the individual data by color.
It is useful for assets which are traded on multiple exchanges, like cryptocurrencies, commodities, forex and derivatives showing you what is happening across the market and on the individual exchanges to give you beter insights.
You can change the symbols from which the indicator gathers data in the settings under inputs, just like the colors, and you can add a moving average.
By default trading volume is aggregated from the following symbols:
Binance, BTC /USDT
Binance, BTC /BUSD
Bingbon, BTC /USD
Huobi, BTC /USDT
OkeX, BTC /USDT
Coinbase, BTC /USD
Bitfinex, BTC /USD
Gemini, BTC /USD
Kraken, XBT/USD
Bitstamp, BTC /USD

Bubble indicatorA simple and accurate indicator that signals the end of the Bitcoin's bull run. This indicator is an inverted lower Bollinger band , taken from a weekly chart. An interesting observation led to the creation of this indicator: on the weekly chart the lower band takes negative values (the red zone in the indicator) at the end of the Bitcoin's bull run. The advantage of this indicator is that the signal comes in advance.

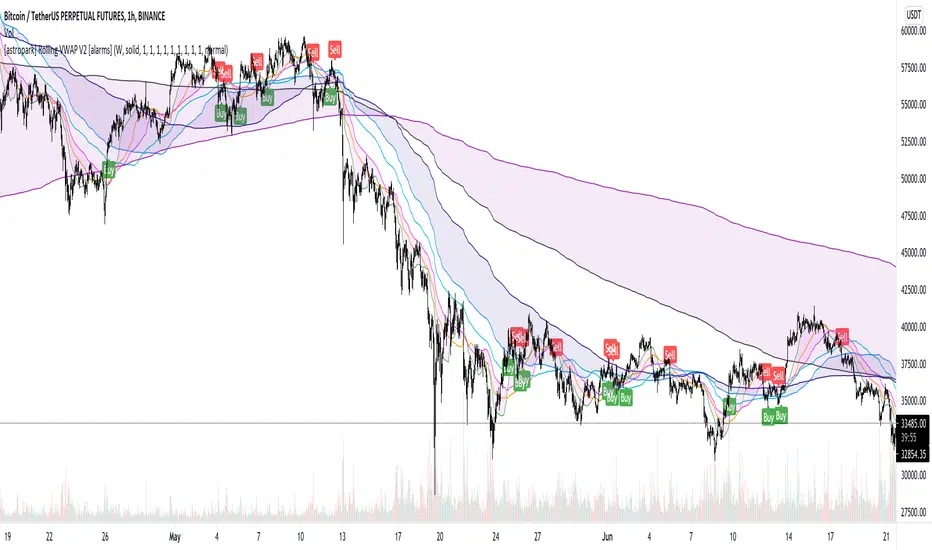
[astropark] Rolling VWAP V2 [alarms]Dear Followers,
today I'm glad to present you yet another awesome Analysis Tool and Strategy, that you may like to use in your trading journey: Rolling VWAP V2 !
This is an upgraded version of my "Progressive VWAP" analysis tool (progressive and rolling are synonymous for me), its description describes quite well what a progressive/rolling vwap is and why they are important to watch:
This indicator can print automatically for you many important Rolling VWAPs:
Daily (D)
2 days (2D)
3 days (3D)
4 days (5D)
Weekly (W)
2 weeks (2W)
Monthly (M)
Quarterly (Q)
Yearly (Y)
As an indicator it will let you:
enable/disable each rolling vwap, change its color and line style and thickness
enable/disable labels and/or price on labels, as well as change their size
As a strategy it will let you:
enable/disable buy/sell signals
choose which strategy to use (all based on rolling vwaps of course)
choose a starting date & time from which to start backtesting
enable/disable individually long and short setups in the backtesting
You should choose low timeframe rolling vwap strategy if you are on a low timeframe, while higher timeframe rolling vwaps are good on medium-high timeframes.
For example D-2D-3D rolling vwap strategies are good at 1h or below, the others on higher timeframes. Backtesting results will help you in understanting this point quite easily.
This indicator works on every timeframe, market and pair. By the way it must be said that, as a bot strategy it has been tested and designed mostly for Bitcoin trading and it works best on 1h or above.
As I always say, all tools are great if you use them correctly: this is not the "Holy Grail", so always use proper money and risk management strategies.
This indicator is the alarms version of the backtesting one you can see here below:
This is a premium indicator , so send me a private message in order to get access to this script.
SWING for GOLD / BITCOIN Hey everyone
I want to share my swing trading system with you.Based on two moving averages coupled to RSI
The options
Shows current trends and entries for trades. Average trade retention 15-20 days
Entries for trades with a crossover of two lines
The percentage of successful test deals XAU/USD for 2010-2021: 69%

Aggregated Perpetuals BasisCONCEPT
The aggregated perpetuals basis compares the prices of perpetual swap contracts in crypto (or "perps" for short) with the price of the spot market.
The idea behind this is that it can help you analyse whether the derivatives market is being overly bullish or bearish.
When the indicator shows positive values (grey colouring by default) it means that perps are trading at higher prices than spot.
Generally speaking we say this is bearish or at least not an ideal scenario to long yourself because most of the time this means that derivatives market participants are too aggressive (overbought territory).
Vice versa when the indicator shows negative values (green colouring by default) it means that there's a spot premium which is considered bullish.
A spot driven market is a healthy market. There could also be a spot premium because market participants that are trading perps are aggressively shorting which puts them at risk of getting short squeezed (again, bullish).
FEATURES
The indicator works for both BTC and ETH.
It's aggregated because it looks at the prices of multiple contracts and it's also volume weighted so that more important markets have a bigger impact.
There are three different types of premiums you can select: coin margin, dollar margin or the combined version.
In crypto there are two types of perpetual swap contracts. Contracts that work with coin margin and contracts that work with dollar margin, which is mostly USDT although FTX for example also accepts other collateral. Sometimes these contracts trade at slightly different prices and you'll notice that there's also a shift in bullishness and importance between these contracts from time to time.
However most of the time the values will be very similar for coin margin and dollar margin.
Markets used for the coin margin perps:
Binance
Bybit
Deribit
Markets used for dollar margin perps:
Binance
Bybit
FTX
The combined premium combines them all.
The spot indices used are:
BXBT (for BTC)
BETH (for ETH)
By default it uses "close" as candle source which means it looks at the premium as if the candle were to close right now.
If you're looking at higher timeframes I suggest using "ohlc4" because there's a lot that happens within one daily candle for example so you might want to use an average candle price (ohlc4 = open+high+low+close/4)
There's a "clamp" feature which puts a cap on extreme values.
Sometimes during capitulation events there's a massive spot premium which dwarfs all the other values and that makes the indicator unreadable.
In such cases the clamp helps to make the indicator useful again.
As you can see I created support and resistance zones (which you can turn off) that max out at 0.4% for bitcoin because by looking at historical data it seems that the premium almost never moves outside of those thresholds (except for those few exceptions during liquidation cascades).
There's also an option to smooth out the values.
TRADING
As discussed earlier, a spot premium is generally speaking considered bullish and a derivatives premium is considered bearish.
It doesn't give buy an sell signals, but it helps you with establishing a bias and gauging general market sentiment.
This in turn can help you with deciding what side of the trade to take and it shows if the conditions are still favourable for you to take the trade you want, because a spot premium for example usually leads to negative funding which makes it interesting to go long.
Send me a private message if you want access so we can discuss it.
Cheers.
High Timeframe POCBecause the big Bitcoin crash I have been looking a lot at high timeframe metrics. I never spent much time learning POC so I decided to create a little script for determining these on higher timeframes.
Currently included: Monthly, 3 months and 6 months.
/* DEFINITION */
Point Of Control (= POC) is a price level at which the heaviest volumes were traded.
Value Area High/Low (=VAH/VAL) is a range of prices where the majority of trading volume took place. Naturally, Value Area High being the top price level and Value Area Low being the lowest. POC always is between the two.
/* HOW TO TRADE WITH THIS INDICATOR */
The basis for POC is determining bias on whichever timeframe you choose.
1. Identify a POC on the timeframe of your choosing.
/* If you choose a "low" timeframe (monthly here) then make sure to look at the higher timeframes to see how it is playing against a higher timeframe POC.
2. When the price is moving away from the POC (either to the upside or downside) this will confirm or invalidate the trade.
3. You can now enter the trade on bias or wait for a retest of the same POC.
/* EXAMPLE TRADES /*
Here is a screenshot of some of the trades that are possible solely using the POC and some common sense.
s3.tradingview.com

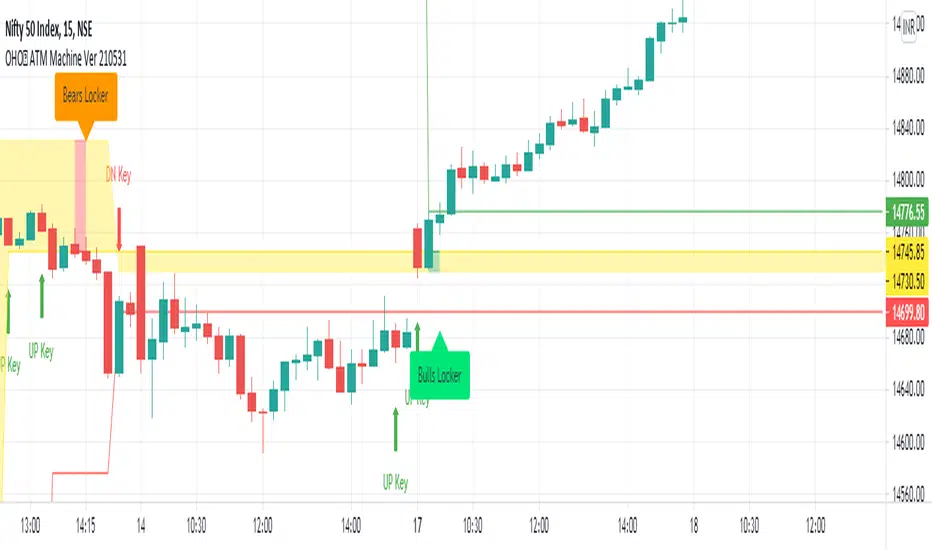
OHO ATM MachineStudies Used:
We have used different type of candle stick patterns, open, close, high, low, Moving Averages, volumes and Average True Ranges in creation of this indicator.
Usage:
It can be used for scalping and intra-day trading. It works best on Nifty 5 Minutes , 15 Minutes, 1 Hour, Daily, Weekly and Monthly Time Frames.
It provides easy to visualize multiple information:
1) It gives the correct Entry on Time. Yellow ATM Area, Means No Trade.
2) Fake Signals are shown when There is Sell Signal and Below is ATM Area.
3) Fake Signals are shown when There is Buy Signal and Above is ATM Area.
4) It gives proper Target at the time of Entry.
5) Stop Loss is Hit when The Candle Closes below ATM Area in Buying and vice versa.
6) No Trade is Recommended, when ATM Area is Yellow.
How to read OHO ATM Machine Indicator?
Buy - When ATM Area is Turned Green in Color First Time after Last Red.
Sell - When ATM Area is Turned Red in Color First Time after Last Green.
Stop Loss - When The Candle Closes below ATM Area in Buy Trade and When The Candle Closes above ATM Area in Sell Trade.
Target - Thin Green Line for Buy Trade and Thin Red for Sell Trade.
Trailing SL - We can Trail the Trade, till the Stop Loss is HIT.
Recommendations:
This can be used for Nifty, Bank Nifty, Stocks, Commodities, Bitcoin, Currency and any other tradable instrument.
What time frame should I use?
5 Minutes and 15 Minutes are best time-frames for Intra-day Trades.
15 Minutes and Hourly are best time-frames for Swing Trades.
Hourly and Daily are best time-frames for Short Term Trades.
But you can check different time-frames in Strategy Testing section or as per your requirements.
Disclaimer:
Past performance is not the guarantee of future performance.
For any type of queries kindly send us personal message.
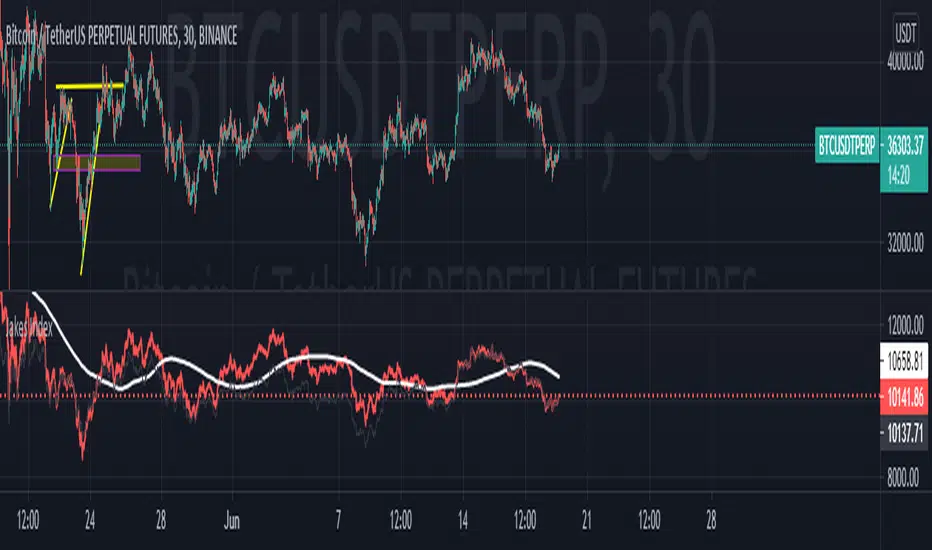
Jakes Index------------
English
I introduce the community to the Jakes Index. Basically, this is an index containing the top 10 cryptocurrencies, classified according to their Marketcap. The purpose of this index is to show a general market context, without being tied to a single crypto. With an overview of the market, it is easier to identify the market trend, in addition to being an excellent indicator to gauge the performance of your Crypt portfolio. Supply data comes from CoinMarktCap, and price data comes mostly from Binance, however some crypts are not yet available for trading by it, so the prices used come from the first broker indicated by TradingView in the search.
Given that one of the crypts was launched very recently, Internet Computer to be more exact, I decided to leave it out of the index, adding "//" to the code in all references to it. If you want to see the performance of the index with the included cryptography, just delete the bars that follow in front of your code, such parts: "ASSET8; SUPPLY8; PESO8; QOC8; FINM8" after that add "//" in "PESO11" and remove the bars from "PESSO11F", in addition to also removing the F. Do the same with "JAKESINDEX" at the end of the code, and you will have the result with the Internet Computer included.
The calculation of the index takes into account the Marketcap of the crypto, which is divided by the sum of the Marketcap of all the others, and then the result is multiplied by the market value of the Cryptocurrency. Thus, we have an index weighted by Marketcap with the 10 most important cryptocurrencies in the market AT THE TIME. It is important to remember that this index must be updated, both in terms of the currencies that change their place in the ranking with certain frequency, as the Supply that each one has, since coins with active mining, as is the case of Bitcoin, change their Supply frequently.
To keep the index up to date, I will do ONE Monthly update, always posting the code with the new changes.
------------
Português
Apresento a comunidade o Jakes Index. Basicamente, este é um índice contendo as 10 principais criptomoedas, classificadas de acordo com seu Marketcap. O objetivo deste índice é mostrar um contexto geral do mercado, sem ficar preso a uma única cripto. Com um apanhado geral sobre o mercado, fica mais fácil identificar a tendência do mercado, além de ser um excelente indicador para balizar o desempenho da sua carteira de Criptos. Os dados referentes a Supply são advindos do CoinMarktCap, e os dados dos preços vem em sua maioria da Binance, porém algumas criptos ainda não estão disponíveis para negociação pela mesma, portanto os preços utilizados vem da primeira corretora indicada pelo TradingView na busca.
Tendo em vista que uma das criptos foi lançada muito recentemente, a Internet Computer para ser mais exato, decidi deixa-la de fora do índice, adicionando "//" no código em todas as referencias a mesma. Caso queira ver o desempenho do índice com a cripto incluída, basta apagar as barras que seguem na frente de seu código, sendo tais partes: "ASSET8; SUPPLY8; PESO8; QOC8; FINM8" após isso adicione "//" em "PESO11" e remova as barras de "PESSO11F", além de remover também o F. Faça o mesmo com "JAKESINDEX" no fim do código, e terá o resultado com a Internet Computer incluída.
O calculo do índice leva em conta o Marketcap da cripto, que é dividio pela soma do Marketcap de todas as outras, e então o resultado é multiplicado pelo valor a mercado da Criptomoeda. Dessa forma, temos um índice ponderado pelo Marketcap com as 10 Criptomoedas mais importantes do mercado NO MOMENTO. É importante lembrar que este índice deve ser atualizado, tanto em questão das moedas que mudam com certa frequência seu lugar no ranking, como o Supply que cada uma tem, visto que moedas com mineração ativa, como é o caso do Bitcoin, mudam seu Supply com frequência.
Para manter o índice atualizado, farei UMA atualização Mensal, postando sempre o código com as novas alterações.
Moving Average BandsUse this script to find buy and sell zones for BTC based on momentum of the move relative to the average asset price over a given period. The script plots a series of offset bands above and below the Simple Moving Average. When price crosses another band further from the SMA, the background is rendered brighter. The brighter the background, the stronger the buy and sell signal is, as the expectation is that price wants to return to the SMA. Settings are adjustable to fine tune to various time frames and assets. Good settings for BTC Daily are length 30, layers at 10, 20, 30, and 40.
On 1H BTC/USD I use length 200, layers at 5, 10, 15, 20 to find decent swing trading opportunities.
On BTC/USD 1D chart, combine with Bitcoin Logarithmic Growth Curve from @mabonyi (original by @quantadelic )for confluence of very reliable signals.

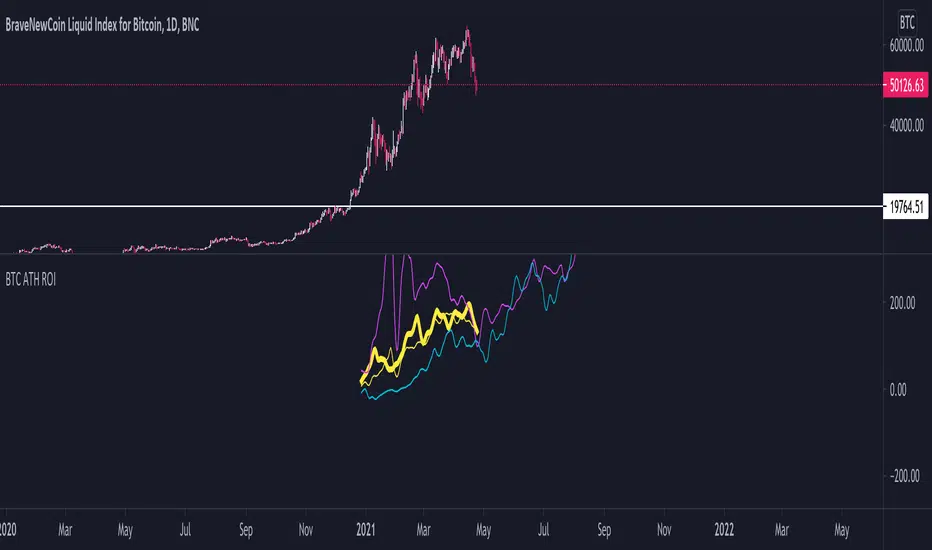
BTC ATH ROIThis indicator shows the ROI % of Bitcoin from when it passed its ATH of the previous bull cycle. I found it interesting that each time it crossed its ATH it took around 260-280 days to peak for each one. This bull run seems to follow between both of the previous bull runs including this recent dip.
There are a couple issues I want to fix but can't figure out:
1. You need to completely scroll out and move towards 2013 on the Daily chart for all 3 lines to show up. Would be nice to load all of that data at the start.
2. I can't query the value of the plots after they have been offset. This would be useful to create a prediction bias for the current plot so would could see where btc might go.
If you peeps know of a way to load all data or query plot values after offsets, please share. That would be awesome.
Hourly Scalp Engine◆ Purpose of this Script
The Hourly Scalp Engine (HSE) is designed to show scalp long opportunities on lower timeframes (H, 2H or 4H) based on a Fibonacci-valued MA-like structure. It was tested for Bitcoin and Ethereum, with the 2H timeframe seemingly giving the best test results. The chart shows a few instances where the price crossed below the HSE to trigger an entry (marked manually with arrows).
◆ Settings
Default scaling input (10.6) is tuned for Ethereum (ETH/USD) on Kraken.
Scaling input for Bitcoin (XBT/USD) on Kraken: 10.4.
Reasonable timeframes: H, 2H, 4H. Recommended timeframe: 2H.
You should probably set an alert for when Price crosses under the HSE.
◆ Instructions
As this is purely a scalp engine (and not feasible for long-term trades), the instructions have to be followed precisely for intended functionality:
As soon as Price crosses below the HSE, contemplate if you want to scalp, i.e. check current price, other indicators and market conditions. If yes, enter a scalp long. Do not enter the trade if : price has crossed above the HSE already and sits more than 1 % above it, or the down-wick was so deep and quick that it already retraced 10 % to the upside from the wick low (even if price is still below the HSE). In both cases it might be too late to enter.
Watch the 2H candle, at which you entered the trade, closing. Draw a 10 % price range from the wick low to the upside. The range high is your exit point. Set a take profit trigger there. Set a stop loss slightly below the wick low.
Observe the price action for the next 6 hours (i.e. the next three 2H candle closes). If price bounces up and hits the target, you exit with 10 % gains. If price hasn't moved to the target after 6 hours, close the trade at current price. If the stop loss should be hit in the meantime, you will have closed the trade automatically. The 10 % gain as a target was chosen because it seems to be hit very often, while higher targets are not reliably hit.
◆ Example Trade
Shown below is an example trade with correct drawing of the 10 % price range.
◆ Viability
From backtesting this should be a viable strategy for most instances where the HSE is crossed. However the HSE is not as hard as a boundary as e.g. the Confidence Bands (also published by DeanTrader), so that price can and will sometimes breach through (= close below) the HSE (as e.g. in the case of the March 2020 black swan event). Still even there a profitable trade could have been performed on the first bounce dependent on actual entry, although more risky due to very high volatility. Before using the HSE please make yourself familiar with the price action history of the considered asset and review the instances where the price crossed below the HSE in connection with the rules laid out in "Instructions" to understand the system and how to execute the trades. Also note that scalp trades are generally harder to perform than slower-paced swing trades, as timing becomes much more important and noise becomes relevant.
◆ Access
For access to this indicator please contact me via DM on TradingView or on Twitter (linked on my TradingView profile and in my signature).

BTC/usd BTC/usdt Volume & AltcoinsMarketcap dominance BithanosIndex introduction:
Function 1 of this indicator:Display the average trading volume of the 8 major BTC spot exchanges.
Bitcoin trading volume select BTC /USD
VOLBITSTAMP
VOLCOINBASE
VOLGEMINI
VOLKRAKEN
Bitcoin trading volume select BTC /USDT
VOLHUOBI
VOLBINANCE
VOLOKEX
VOLBITFINEX
Average trading volume = ( BTC /USD trading volume aggregation + BTC /USDT trading volume aggregation) / 8
This indicator function 2:Display BTC /USD trading volume as a percentage of total trading volume .
BTC /USD trading volume ratio = BTC /USD trading volume aggregation / ( BTC /USD trading volume aggregation + BTC /USDT trading volume aggregation)*100%
This indicator function 3:Displays the percentage of the market value of altcoins in the total market value of the cryptocurrency market.
Market value of altcoins = total market value of altcoins / total market value of cryptocurrencies * 100%
Glossary:
"MA length volume moving average period"
"Adopt Vol MA Enable Volume Moving Average"
"Vol average BTC combin shows the average trading volume of the 8 largest BTC spot exchanges"
"Adopt Btc /Usd Vol% Enable Btc /Usd Vol %"
"Adopt ALTS marketcap% enabled altcoin market cap"
"EmaBoll for Vol% / Marketcap% The Bollinger Bands based on Ema's mid-rail can be used for the volume ratio or the market value ratio"
本指标功能1:显示8大BTC现货交易所均摊成交量。
比特币成交量选取 BTC /USD
VOLBITSTAMP
VOLCOINBASE
VOLGEMINI
VOLKRAKEN
比特币成交量选取 BTC /USDT
VOLHUOBI
VOLBINANCE
VOLOKEX
VOLBITFINEX
均摊成交量 = (BTC/USD 成交量聚合 + BTC /USDT 成交量聚合)/ 8
本指标功能2:显示BTC/USD 成交量 占总成交量百分比。
BTC /USD 成交量占比 = BTC /USD 成交量聚合 / (BTC/USD 成交量聚合 + BTC /USDT 成交量聚合)*100%
本指标功能3:显示 山寨币市值 占据 加密货币市场总市值 百分比。
山寨币市值 占比 = 山寨币总市值 / 加密货币总市值 * 100%
名词解释:
" MA length 成交量均线周期"
"Adopt Vol MA 启用成交量均线"
"Vol average BTC combin 显示8大BTC现货交易所均摊成交量"
"Adopt Btc /Usd Vol % 启用Btc/Usd成交量占比"
"Adopt ALTS marketcap % 启用山寨币市值占比"
"EmaBoll for Vol% / Marketcap% 基于Ema中轨的布林带 可用于成交量占比 或 市值占比"

Performante's Average Bitcoin Volume EMA Indicator This is the average Bitcoin volume with the data collected from the major retail exchanges + the exponential moving average (EMA) for the volume added on to better understand relative volume.
Thank you Julio!

(D7R) Deribit Bitcoin FuturesDeribit Contract Futures Price with 3 different value display modes. (Percentage, Delta, Absolute).
This information can be used to understand when futures are trading at relative strong premium or discount against each other.
This information can either be used for hedging or price speculation when difference between contracts offer that arbitrage.

Sharktank - Pi Cycle PredictionThe Pi Cycle indicator has called tops in Bitcoin quite accurately. Assuming history repeats itself, knowledge about when it might happen again could benefit you.
The indicator is fairly simple:
- A daily moving average of 350 ("long_ma" in script)
- A daily moving average of 111 ("short_ma" in script)
The value of the long moving average is multiplied by two. This way the longer moving average appears above the shorter one.
When the shorter one (orange colored) crosses above the longer (green colored) one, it could mean the top is in.
These moving averages rise at a certain rate. Using these rates we could try to estimate a possible crossover moment. That's exactly what this indicator does! It gives the user a prediction of when a crossover might happen.
Special thanks to:
- Ninorigo, for making his indicator public. This one uses his as a starting point.
- The_Caretaker, for coming up with this idea about calling a top. Yet, his is more price-based, this one is more time-based.

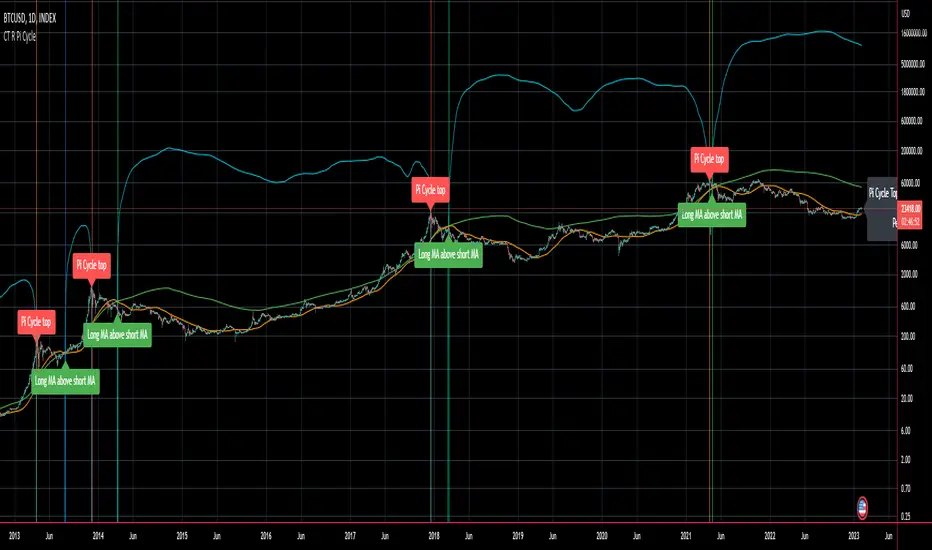
CT Reverse Pi Cycle Bitcoin Top IndicatorIntroducing the Reverse BTC Pi Market Cycle Top indicator
Much respect to Philip Swift the original creator of this idea and big thanks to Tradingview author Ninorigo for sharing the script which this indicator is based on.
Philip Swift has noted that:
Using the x2 multiple of the 350 day moving average along with the 111 day moving average provides an interesting market cycle indicator.
Over the past three market cycles, when the 350DMA x2 crosses below the 111DMA, Bitcoin price peaks in its market cycle, this has been accurate to within three days of Bitcoin price topping out.
Here I have modified an existing script by Tradingview author @Ninorigo which shows the moving averages and gives signals upon crossover by adding the following features:
A function which shows the price at which the 350DMA will Cross Below the 111DMA.
(This is calculated from the prior bar closing data and does not repaint)
An “anticipated cross” function which may give a 1 bar advanced warning of a cross.
(this is calculated from current bar values and may change and repaint)
The crossover levels are shown in an info label to the right of the current price.
When there is a BTC Pi Market Cycle Top anticipated cross on the next bar there will be an orange background signal.
When there is an actual BTC Pi Market Cycle Top cross there will be a red background signal
When there is an anticipated cross back there will be a blue background signal
When there is an actual cross back there will be a green background signal
This indicator will show the appropriate moving averages and crossover information from the daily timeframe regardless of the timeframe you are using.
This should be helpful in more accurately identifying the price level where the Pi Market Cycle moving averages will cross denoting a possible market cycle top.
It is interesting to note:
350 / 111 = 3.153
Which is the closest we can get to Pi when dividing 350 by another whole number.
This is a script to give another view and metric on an interesting experimental idea. This is not financial advice.
Adaptive RSI and MACDHello guys,
this script provides a adaptive version of the RSI and MACD. Also you can check in the settings for the long-short-ratio of bitcoin and ethereum.
The indicator is adaptive, because it looks at historic price action of a specific period to define, wether the trend is bullish or bearish and therefore adapts the values.
What you need to look out for:
- MACD crosses, highs (top area) and lows (lower area)
- RSI divergences (e.g. adaptive rsi falls and price goes higher)
- long-short divergences (e.g. long-short ratio rises and price goes down)
- if macd or rsi is above the middle line, the trend is rising and other way around
Let me know, what you've been thinking bout the script :-)

BTC Price to Hash scoreGrowing btc hashrate are associated with increasing btc price.
During speculative phase price growth is disproportionate to the hashrate.
On the opposite when the price fall to much in comparison to the hashrate, bitcoin could be undervalued.
This indicator identified 3 of 4 major tops and a lot of optimal buy opportunities.
Value under 0 signal overbought situations, value above 5.6 signal extremely oversold situations.
BIO
