SFP + TP/SL + WT JSON BOT (Touch/Return)Smart Reversal Engine with Automated TP/SL & WunderTrading Integration
This invite-only indicator is designed for traders seeking highly responsive reversal detection and fully automated execution.
It combines multiple market conditions into a single confirmation system that identifies high-probability turning points with minimal delay.
The tool provides:
🔷 Key Features
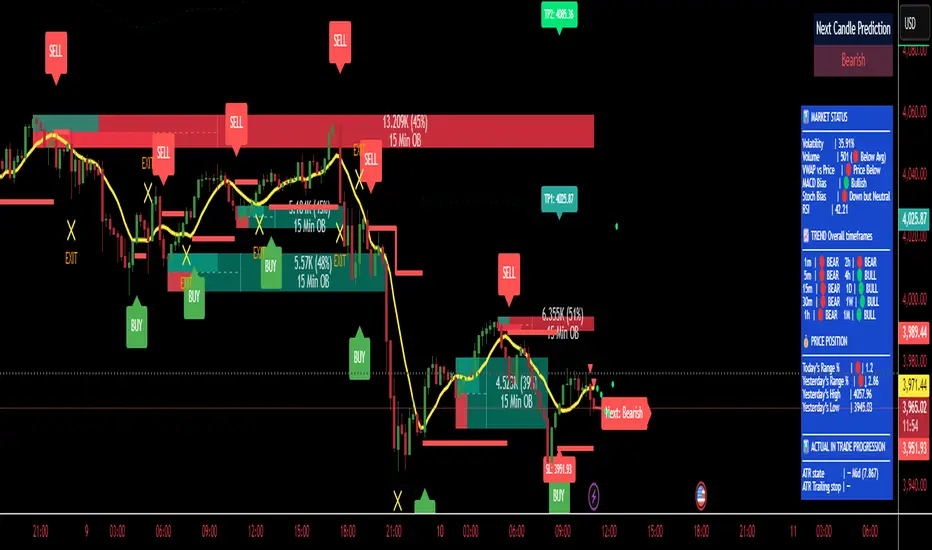
✔ Real-time reversal detection
Signals are generated the moment specific market conditions align—no need to wait for candle closures.
This allows extremely early entries with minimal lag.
✔ Auto-calculated TP/SL levels
Profit-taking and protection levels are dynamically generated based on market structure.
Visual TP/SL lines appear directly on the chart for clarity.
✔ Backtesting suite
Last N trades statistics
Monthly performance summary (last 4 months)
Estimated PnL based on user-defined capital & leverage
On-chart TP/SL markers
Everything updates automatically as new signals appear.
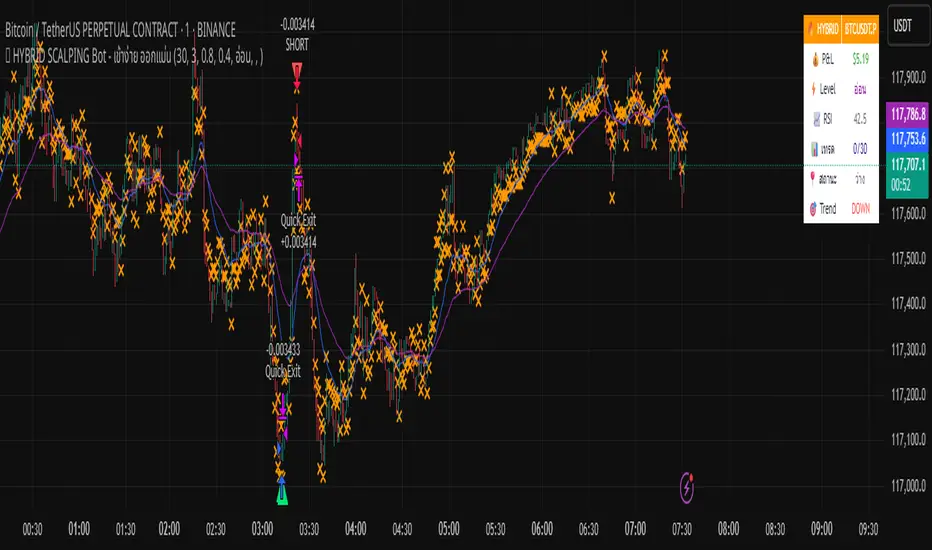
✔ Fully automated execution through WunderTrading
When enabled, the indicator automatically sends structured JSON alerts compatible with WT bots:
Enter Long
Enter Short
Exit All
Including:
Market orders
Position size based on your capital settings
Exchange-level TP/SL placement
This allows the chart signals to translate directly into live trading actions.
🔷 Customization
Users can freely adjust:
Entry behavior mode
TP/SL model
Capital allocation
Leverage settings
Backtest window
Without exposing or modifying the underlying logic.
🔷 Notes
This script does not repaint after confirmation.
Real-time signals may update during candle formation (normal for intrabar processing).
Strategy logic is proprietary and not disclosed.
Access is invite-only.
If you would like access, contact me directly through TradingView messages.
Setup guide and WT integration instructions are provided for all subscribers.
智能反转引擎(Smart Reversal Engine)+ 自动 TP/SL + WunderTrading 全自动交易接口
这是一个 邀请制(Invite-Only) 指标,专为追求高响应性反转信号、自动化交易执行的用户打造。
它将多重市场条件整合成统一的判定系统,在极短延迟下识别潜在的高概率转折点。
不会披露策略逻辑、指标原理或内部结构。
🔷 主要功能
✔ 实时反转信号(无需等待收线)
当关键市场条件同时满足时,系统会即时给出提醒。
适用于希望提前布局、减少延迟的交易者。
✔ 自动计算 TP / SL
止盈/止损根据市场位置自动生成,图表上清晰显示,仅需跟随即可。
无需手动测量价格距离。
✔ 完整回测统计系统
最近 N 笔交易统计
最近 4 个月月度表现
根据本金与杠杆估算的 PnL
每一笔 TP / SL 自动打标
所有统计数据均实时更新。
✔ 完整支持 WunderTrading 全自动下单
启用后可自动发送结构化 JSON 信号,包括:
开多
开空
全部平仓
并自动附带:
市价单
依照用户设置的手数 / 杠杆
交易所级别 TP / SL 挂单
实现从图表信号 → 自动交易执行的全流程自动化。
🔷 自定义设置
你可以自由调整:
入场模式
TP/SL 比例
本金
杠杆
回测窗口长度
无需触碰或理解核心逻辑。
🔷 注意事项
指标在信号确认后不会重绘
实时信号在未收线时可能动态变化(属正常现象)
核心算法为私有内容,不会公开
采用 Invite-Only 授权方式
Pine Script® indicator