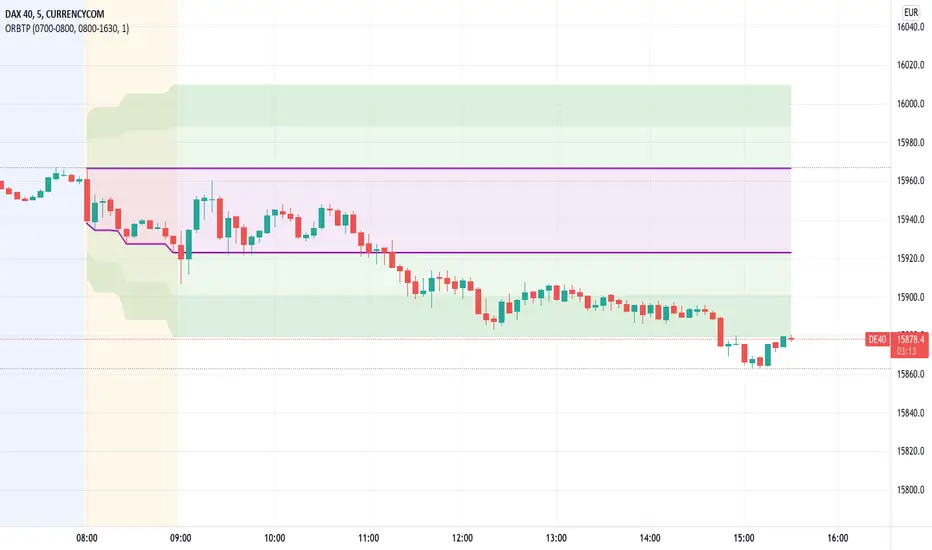
Open Range Breakout With Take Profit Zones
Open Range Breakout With Take Profit Zones prints the open range and profitable zones based on the high and low during the opening hours.
This indicator can be used to prepare breakout trades following the OPR strategy. The time window for the open range as well as for the market hours can be configured. Also custom alerting templates allow to create alerts when a breakout out of the opening range occurs or when 50% take profit level is reached.
The background of pre and post market hours is coloured according to the configured time windows.
This indicator was written to support scalping and day trading. It does not calculate or display results on hourly, daily or weekly charts.
The open range and trading hours must be adjusted to the market time zone of your instrument. Also please take care that these settings are saved on the layout and not per instrument. Eventually create multiple layouts for instruments with different market time zones.
Search in scripts for "breakout"
NVME Breakout DetectorMain Description:
NVME Breakout Detector is an indicator designed for breakout traders that helps those traders simplify trading through saving their time by automatically finding appropriate high and low zones on the chart for the trader. The indicator also provides the user with alerts of newly printed zones and zones that were broken through giving a trader the confirmation to stay in a trade longer or perhaps to find a new trade position following the trend that is shown.
How To Use It?
This is a beginner and user friendly indicator that is simple to follow, firstly the user should add this script on to their charts, secondly they will see 2 generated zones (the high being in red and the low being in green), once the user identifies those zones, the user should wait for price to close past those zones to get the idea that price may want to continue in that direction.
Settings:
Use Higher Accuracy Method - This will add another condition into the zone detection algorithm causing the indicator to detect less zones but these zones will be better for accuracy.
Use Bar Close - This will add another condition into the breakout calculator and alerts, which will force the indicator to wait for the bar to close before any confirmations can take place.
Show Breakout History - This will print all the previous zones and labels for the asset you are on.
Show Breakout Labels - This will show the breakout labels next to each zone and allow the user to see how many times that zone has been broken through or if it hasn't been broken through.
Supported Assets: All Assets Supported
Will This Come With Other NVME Scripts? Yes

CCI Breakout TraderWorks well on Bitcoin or most altcoins on a 15min chart or higher.
What is this exactly?
This is an indicator that uses horizontal RSI + EMA lines with a CCI line on top of it to provide optimal entry and exit positions for trading. There is also a breakout indicator based on the width of Bollinger Bands.
How to use:
If the blue stream passes upwards on the red heading to the white - it's heading towards a good BUY signal. To be safe you wait until it passes above the white line, then BUY LONG. Another signal to buy long is when the blue stream passes above the white and green lines.
Selling is essentially the opposite, if the blue stream is passing down from the green or white lines, then it's time to sell and exit your trade.
If you need help knowing when to enter and exit a trade the indicator will draw a grey candle on your chart to signal it's time to exit a long trade and it will draw a purple candle when it's time to enter a long.
--
Breakout alert:
If you see a green vertical bar it's a warning that there is a potential breakout in price coming for whichever coin you are looking at. The price breakout could go either direction, so make sure you watch the blue stream.
--
Important tips:
The direction of the green/white/red lines are important - if they are heading down that means it might not be the best time to enter your trade, even if the blue stream crosses up on the red and/or white lines.
The colored horizontal lines are there to let you know if the blue stream is near the bottom of those lines (anywhere from hline 15 to 50) and heading upwards, you will more likely have a longer positive trade. If the blue stream is above 60 hline and it looks like a good trade (passing up on the red and white lines), expect to have a shorter trade.
I use this for swing trading various crypto currencies, once you learn how to read it, you can catch amazing uptrends really early and you can exit trades before some big drops happen.

[TVExtBot]Volatility Breakout Plus Indicator(With Alerts)It is based on the legendary trader Larry R. Williams' volatility breakout strategy.
The volatility breakout strategy is a short-term trading strategy that realizes rapid profits on a daily basis, following the upward trend of a strong upward trend that exceeds a certain level on a daily basis.
The Volatility Breakout Plus strategy is a strategy modified to a long-term trend by supplementing the existing Volatility Breakout strategy.
변동성 돌파 전략이란 전설적인 트레이더 래리 윌리엄스(Larry R. Williams)의 변동성 돌파 전략을 기본으로 개발한 전략입니다.
변동성 돌파 전략은 일일 단위로 일정 수준 이상의 범위를 뛰어넘는 강한 상승세를 돌파 신호로 상승하는 추세를 따라가며 일 단위로 빠르게 수익을 실현하는 단기매매 전략입니다.
이번 출시하는 변동성 돌파 플러스 전략은 기존 변동성 돌파 전략을 보완하여 장기 추세로 수정한 전략입니다.
※특징으로는 선물보다는 현물차트에 더 효과적입니다.
기본적인 설정은 기존 변동성 돌파 전략과 동일하고 장기 추세에서의 리스크를 줄이기 위해 익절과 손절 기능을 추가하였습니다.
Default Options(기본설정)
BeforeDay Open-Close Volatility (%) (전날 시가종가 변동률) : 6%
StopLoss (%) (손절) : 6%
TakeProfit (%) (익절) : 30%

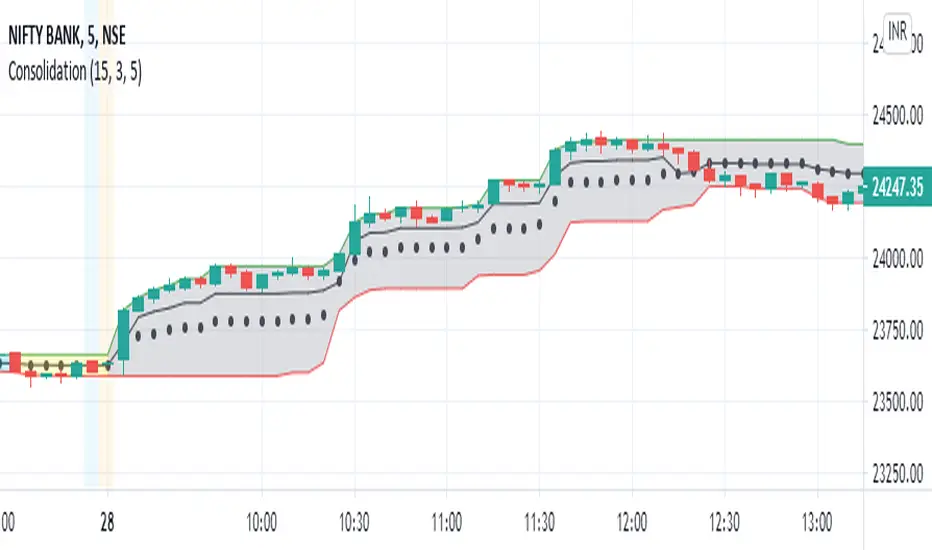
Consolidation and Breakout detectorExperimental : This script identifies the consolidation of a stock for selected time period. The consolidation period and range can be configured. 2 levels of consolidation levels can be selected. i.e Strong and medium. The range for strong and medium level of consolidation can also be configured by the user.
A movement in the direction of breakout of the consolidation level is observed most of the times. I have also added reversal line/stoploss line, so that the breakout movement is cancelled once that line is crossed by the candle close.
Currently consolidation levels are configured for 5 minute chart NSE:BANKNIFTY OANDA:NAS100USD . Can be reconfigured easily for any timeframe.
Z+ Trend Finder & Breakout 3in1 for Crypto Stock & Forex TradingDear all,
If you like this indicator please hit the like button and do follow me. It takes lot of effort & calculations to bring some good strategy on charts. Keep Supporting & will update this indicator regularly.
Z+ Trend Finder Pro🚀 by Zia 💎 a combination of RSI+MACD+SMA
Z+ Trend Finder Pro is a 3in1 Indicator for Crypto, Stock Market & Forex Trading. This indicator is a combination of RSI , MACD , SMA & few other important settings with unique strategy keeping scalping & intraday trading in mind. Please read all points below for better understanding of how this indicator works. I'll make it very simple and easy to understand.
When you load the indicator on chart, you will see candles in 2 colors blue & dark brown (You can change color from settings if you want).
Blue means price is going up
Brown means price is going down
On Top you will see thick Red line - Overbought , means if price is above this line ( RSI above 80) - market is overbought and RSI is too high and chances market will reverse.
Bottom you will see thick Green line - Oversold , means if price is below this line - market is oversold & RSI very low around 20 & chances market will reverse.
In-between you will thick Green/Red line called breakout line . If price is below this line, color will red means market is in downtrend and will further go down.
If price is above this line, its color will be green & means market is in up trend and will go further up.
Breakout Line -
Whenever price break the Breakout line upside, up breakout will come means open long position, if downside, down breakout will come means open short.
Rest things are self explanatory.
Apart from this, you will see green and red bands. The wider the band indicates trend is strong, & if bands width is getting narrow means trend is fading - Get out of trade at that time.
Market overview Display Box
On the right side, you will see yellow box with particular coin details along with other market top performing coins in terms of MarketCap. From settings you will change it to either Crypto, Stock or Forex. You can control the display of this box from script setting.
Which is the best timeframe to use with this indicator?
I personally check things first at 1hr chart, to know how market is performing in broad time frame.
Next if you see more volatility in market, you can use 15min time frame too.
Also it depends from coin 2 coin and market conditions too. Sometimes you will find things are pretty good with 5 min and sometimes 15min, and sometimes you might stick with 1hr.
EURUSD Example
NIFTY Example
What is the accuracy?
Personally when i use it with 1hr TF for intraday swing calls, i see pretty good result & accuracy almost above 90%.
But do keep in mind, its not a magical stick - always DYOR fully after seeing any type of recommendation from this indicator either on buy/long or sell/short side.
Disclaimer:- This indicator is just for educational purpose and does not guarantee to make you rich overnight. It only helps you to understand market trend, so you take prefect entry. Anyone who guarantees you will make money, is pretty much guaranteeing that you will lose money. Trading and technical analysis is extremely difficult, it takes patience, discipline and most people do not make it. Applying these tools and investing in your trading education can help put the odds in your favor but will only assist the individual in their execution, decision making, thought process and executing their own individual trades, NOT make them for you.
You're always welcome to share any type of suggestion & feedback.
To access this indicator, Interested traders can pm me our use below links.

Daily Close Breakout 20/10 + 200 (Signals)Daily Close Breakout 20/10 + 200 (Signals)
A simple “check once per day” breakout signal tool designed for the Daily (1D) chart.
Quickstart:
* Signals are confirmed at the daily candle close.
* If a triangle prints today, the earliest you act is the next day’s open (not the same candle).
* Green triangle = consider entering long.
* Red triangle = consider exiting.
* Long-only (no shorts).
How to use:
* Use on the Daily (1D) timeframe.
* Check the chart once per day after the daily candle closes.
* Do not act intraday on signals.
Rules (default settings 20 / 10 / 200):
* BUY: A green up triangle prints when the daily close is above the prior 20-day high and above the 200-day Simple Moving Average.
* SELL: A red down triangle prints when the daily close is below the prior 10-day low.
Lines and colors:
* Prior 20-day high (entry level): red
* Prior 10-day low (exit level): yellow
* 200-day Simple Moving Average: aqua
Notes:
* Best used on the Daily (1D) timeframe. Other timeframes may behave differently.
* This script plots signals and reference levels only. For performance metrics, use a matching strategy/backtest script.
* Educational use only. Not financial advice.

Breakout Scanner (Screener)Breakout Scanner (Screener style — single indicator to drop in Screener tab)

Breakout Trading System• Breakout Trading System
Adaptive buy/sell engine tuned for crypto that blends EMAs, Ichimoku cloud context, breakout/consolidation filters, momentum checks, and volume validation. It auto-detects symbol
class (BTC, majors, alts, DeFi, small caps) and adjusts the logic accordingly. On the chart you see clean BUY/SELL tags, optional TP ideas, and peak/floor markers; support/resistance
price-action dots keep the view tidy.
Breakout helpers, consolidation and momentum pings, peak/floor updates, and TP suggestions all drive alert hooks so you can automate entries, exits, or take-profit workflows. A
bottom-right dashboard tracks buy/sell win counts (TP hits) and overall hit rate so you always know how the strategy is performing. Toggle the visual layers you need via the “Trade
Visuals” inputs to match your workflow—from scalping to higher-timeframe swing trading.

Trendline Breakout Navigator [LuxAlgo]The Trendline Breakout Navigator indicator shows three trendlines, representing trends of different significance between Swing Points.
Dots highlight a Higher Low (HL) or Lower High (LH) that pierces through the Trendline without the closing price breaking the Trendline.
A bar color and background color option is included, which offers insights into the price against the trendlines.
🔶 USAGE
Trendlines (TL) are drawn, starting as a horizontal line from a Swing Point.
When an HL (in the case of a bullish TL) or an LH (bearish TL) is found, this Swing Point is connected to the first Swing Point. In both cases, the TL can be optimized when one or more historical close prices breach the TL (see DETAILS).
A solid-styled long-term trendline represents the overall market direction, while a dashed-styled medium-term trendline captures medium-term movements within the long-term trend. Finally, a dotted-styled short-term trendline tracks short-term fluctuations.
🔹 Swing Points vs. Trend
A "Higher High" (HH) or "Lower Low" (LL) will initialize a new trendline, respectively, starting from the previous "Swing Low" or Swing High".
To spot the trend shift, "HH/LL" labels and an optional background color are included. They can be enabled/disabled or set at "Long, Medium, or Short" term TL (Settings—"MS", "HH/LL" and "Background Color").
These features are linked to one Trendline of choice only.
Where the "HH/LL" labels can show a potential trend shift, the background color is:
Green from the moment the close price breaks above a bearish trendline or when an HH occurs
Red from the moment the close price breaks below a bullish trendline or when an LL occurs
🔹 Bar Color
The bar color will depend on the location of the closing price against the three trendlines. When a trendline is unavailable (for example, if the close price breaks the TL and there is no HH/LL), the last known trendline value will be considered.
All three trendlines influence the bar color.
If the close price is above the "Long Term" TL, the bar color will show a gradient of green, darker when the close price is below the "Medium Term" and/or "Short Term" TLs.
On the other hand, when the close price is below the "Long Term" TL, the bar color will show a gradient of red, which becomes darker when the close price is above the "Medium Term" and/or "Short Term" TLs.
To keep the above example simple, only the "Long Term" TL is considered. The white line (not included in the script) resembles the actual value of the TL at each bar, where you can see the effect on the bar color.
Combined with the trendlines and dots, the bar color can provide extra depth and insights into the underlying trends.
🔹 Tested Trendlines
If a new HL/LH pierces the Trendline without the close price breaking the Trendline, the Trendline will be updated.
The exact location where the price exceeded the Trendline is visualized by a dot, colored blue on a bullish trendline and orange when bearish.
These dots can be indicative of a potential trend continuation or reversal.
🔹 Higher TimeFrame Option
The "Period" setting enables users to visualize higher-timeframe trendlines as long as the line length doesn't exceed 5000 bars.
🔶 DETAILS
When a new trendline is drawn, the script first draws a preliminary line and then checks whether a historical close price exceeded this line above (in the case of a bearish TL) or below (in a bullish case).
Subsequently, the most valid point in between is chosen as the starting point of the Trendline.
🔶 SETTINGS
Period: Choose "chart" for trendlines from the current chart timeframe, or choose a higher timeframe
🔹 Swing Length
Toggle and Swing Length for three trendlines: Period used for the swing detection, with higher values returning longer-term Swing Levels.
🔹 Style
Trendline: color for bullish/bearish Trendline
Wick Dot: color for bullish/bearish trendline test
Term: Long-, medium- or short-term
HH/LL: Show HH/LL labels (with or without previous Swing High/Low) of chosen Term
Background Color: Green when the closing price is above the trendline of choice, red otherwise
Bar Color

Clean ADX with bidirectional Breakout VolumeThe default Average Directional Index (ADX) helps traders determine the strength of a trend, not its actual direction. The Clean ADX helps traders determine the strength of a trend on a longer time, and the possible direction on different timeframes.
The bidirectional Breakout Volume determines both directions of breakout or breakdown volume. When volume is high by comparing the previous volume high over n periods to the current volume or when volume is lower by comparing the previous volume low over n periods to the current volume.
If the current volume exceeds the previous volume high or low, then the indicator columns will turn red or green.
This indicator should make trading easier and improve analysis. Nothing is worse than indicators that give confusingly different signals.
The combination of the first and second indicator therefore makes perfect sense to me and now you are able to find your long or short trends earlier.
I hope you enjoy my new ideas
best regards
Chervolino
Operietur ⸗ Time Range BreakoutOur T.R.B ( Time Range Breakout ) indicator is very similar to the O.R.B ( Open Range Breakout ) indicator. This script plots the high/Low within a custom time-range which then extends that plot to end-of-day. A Fibonacci extension is then drawn from that range. The default settings of this indicator set the similarities to the ORB. This script only displays the last trading day.
Due to Tradingview's singular refresh rate for the larger timeframes("resolutions"); this indicator works on timeframes LESS than 60min. Additionally, the smaller the timeframe the more accurate the price range will be.
The movements within the specified period of time define the projected Fibonacci prices associated with the allotted time's price range.
• Custom Time Range
• Fibonacci Extensions
• Up to 5 PTs
• Customizable Multiplier
Additional script features allow for fully adjustable settings and configurations:
• Adjustable; PT Colors
• Adjustable; Range Color
• Adjustable; Toggles

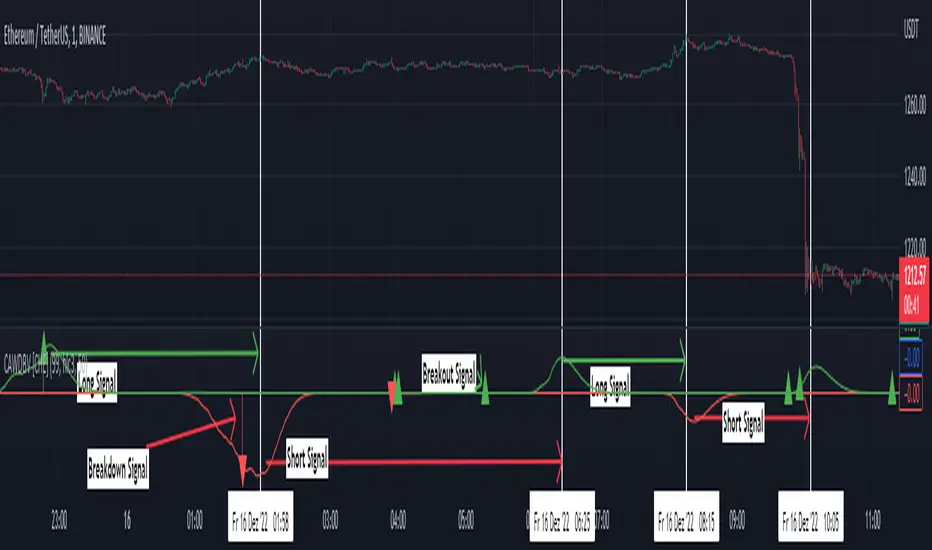
Breakout SignalsBreakout Signals analyzes buy and sell signals based on the Signal Money Plus indicator and trends on the chart.
Buy signals on the chart are a combination of signal patterns on the Signal Money Plus indicator and combine more trend conditions.
Sell signals on the chart are a combination of divergence and overbought signal patterns on the Signal Money Plus.
Follow signals on the chart are when the price crosses the MA200.
Br signals on the chart are when the price crosses the Ichimoku Cloud.
Trend colors:
and
When the Buy signals appear on the chart and then the price tends to cross the upper breakout, we continue to buy more.

Breakout in 20 daysbreakout condition
1. current close price must be higher than all close prices in 20 days
2. close prices change in 20 days must be less than 20%
3. current volume must be greater than previous volume by 10%
ブレイクアウト条件
1. 最新の終値が直近20日のすべての終値より高い
2. 直近X日の終値の変動率が20%以下
3. 最新の出来高が前日の出来高より10%大きい

Open Range Breakout with TSLThis ORB with TSL Indicator Session Time is Indian NSE and BSE Equity Market
This indicator Provide you 2 type Setup
Opening Range Plot Only for Observation
1st Range Breakout = Long
2nd Range Breakout = Short
How to work This Indicator?
When Market is Open This Indicator automatically Plot Opening Range High and Low,
if Market bullish & Candle Close above Opening Range high When This Indicator automatically Plot 1st Range High and Low if You Want to 1st Range High Plot Crossingup any Candle You can Also Add Alerts
if Market Bearish & Candle Close Below Opening Range Low When This Indicator automatically Plot 2nd Range High and Low if You Want to 2nd Range Low Plot CrossingDown any Candle You can Also Add Alerts
If you Have any Suggestion please mention here
Thank you so much
This Also Automatically start trailing SL on basis of ATR

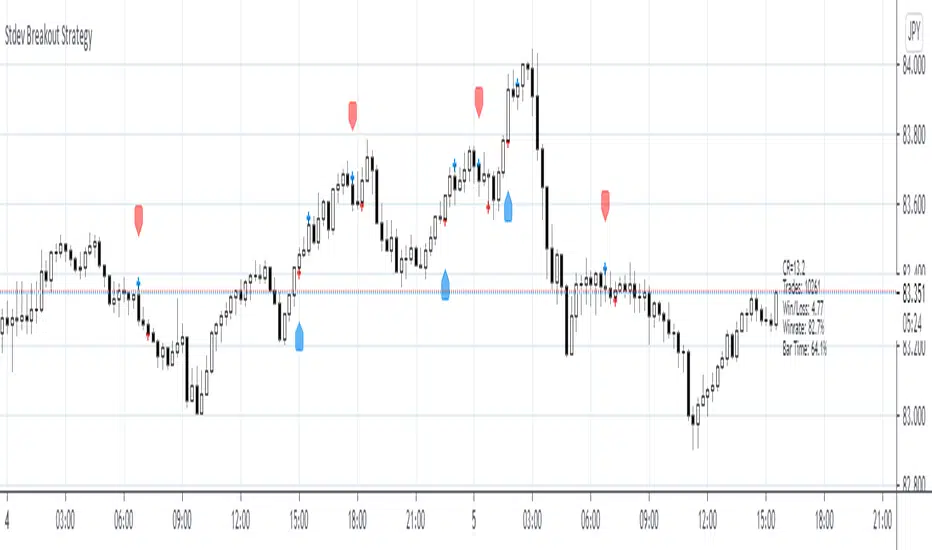
Stdev Breakout StrategyStdev Breakout Strategy
Description:
This script generates a long entry signal when the Standard Deviation crosses over the Simple Moving Average and the Close is greater than the Open, and/or generates a short entry signal when the Standard Deviation crosses under the Simple Moving Average and the Close is less than the Open.
Ravih Pro Trend BreakoutThis is a Trend Breakout Strategy on “DAILY Time-frame”
This Strategy is designed keeping in mind with Medium to Long Term traders. The strategy works only on Daily Time-frame and on Closing Price.
The concept here is to identify assets with potential change in trend. Primary focus is to position for the big move. There are times... trying to catch every trend, many of which can be unprofitable especially in side-way market. However, the primary purpose of this strategy is to catch all the major trend movements, which are much more profitable than minor market losses in all the side-way market.
I’ve simplified it to make it user-friendly.
How to use?
Set it to Daily Time-frame.
Buy, Take Profit 1,2,3 and Exit signals are included on chart based on the current Trend direction. The system shows an Exit signal if the system’s exit conditions are met. It works only on Daily Time-frame and on Closing Price.
Dark Blue Up Triangle denotes Buy at the Closing Price. Entry Price is Closing Price or with + or – 2% tolerance of the Closing Price for the following market day.
Purple Down Triangle denotes Exit to close any remaining position to free up capital.
Little Green Up Triangles denote the Bulls are in Control and Overpowering the Bears and represents minor Buying opportunities with strong probability of continuing up-moves.
Setting Up Alerts
The user has the option to Setup Alerts for all chart signals that is…
For Buy, for Exit, for Take Profit 1 set at 24%, for Take Profit 2 set at 48% and for Take Profit 3 set at 72%
The user also has the option to adjust the Take Profit as per their desire. However, the predetermined Take Profit set for this strategy does work reasonably well.
Remember...
This strategy is only built for stocks. It is Not for Indices neither for any other financial instruments.
No SHORT signals in this strategy.

True Range Breakout [racer8]TRB (True Range Breakout) plots the current TR (true range) as well as the previous TR high over n periods. If the current TR is greater than the previous TR high, then the TR histogram will become red. Red signals high volatility. Enter trades only when the histogram is above the TR high line. Happy trading! 🥳

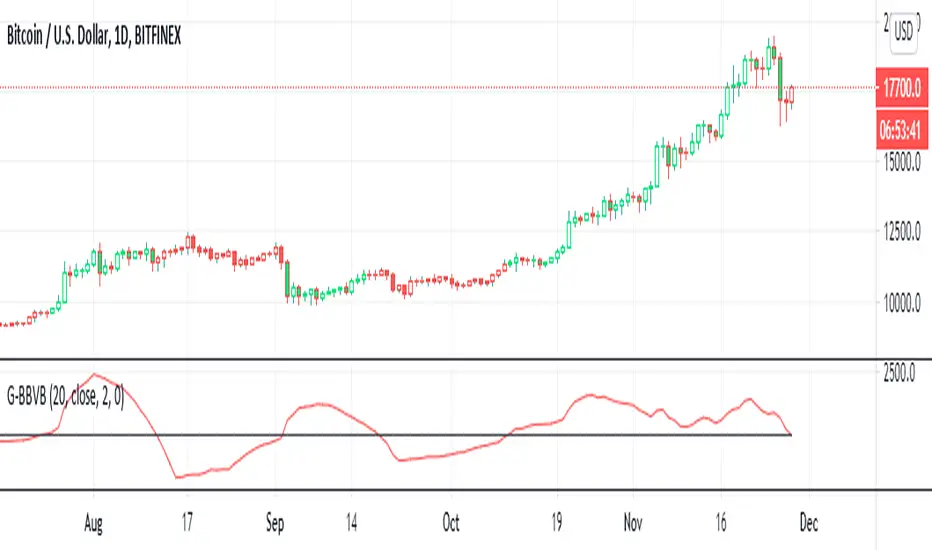
G-Bollinger bands volatility breakout v.1This is my frist publish scrpit. I developed this indicator origin is BB. It make from easy idea but powerful for sideway to breakout
1. I findout volatility by upper band of BB - lower band of BB (I called "Aline")
2. I created SMA of Aline (I called Bline)
3. I created the special line is "Cline" from Aline - Bline
4. I created 0 line " Baseline "
G-BBvB is the very good indicator to detect low volatility to begin the volatility = Buy signal
Now I can't find the sell signal form indicator. I try backtest sell at Cline cross zeroline but it not work.
I'll develop "G" indicator for free .
Goodluck :D
Session Range and Breakout Summary
This script presents the session range and post session movements relative to that range of all the majors and crosses on a single page. You can also set it to a daily range and weekly range (beta). It will even show you the pip value of the range. I made the indicator to easily stay on top of market movements at london open relative to the Asia session range. Its very easy to see which entire currency group is breaking its asia range WHIST ITS HAPPENING. Focus on NZD in the examples as it was the market lead today - I was able to get some of it when I saw the entire group breaking its range
Showing all the majors and crosses relative to the Asia range (00:00 - 07:00 GMT)
Active 'show on chart' to verify the indicator is measuring the range correctly. Compare below to the NZD box above - you can see how NZD had control of the market this morning and all NZD pairs broke out of their ranges.
'PIP MODE' - active pip mode to see what the pip range was of the session
Notes
The information is presented RELATIVELY - this means that all the ranges and movements are scaled to be the same size. You are therefore seeing the movements relative to their ranges. When you see a breakout it relative to the size of the range - for example, if GBPJPY had a range of 50pips and breaks out of the range by 100 pip and GBPEUR has a range of 20 pips and breaks out by 40 pips they have both broken out double the range and will be displayed as the same distance.
The indicator will show the movements whilst the range is forming. I did this so I can see what the groups are doing before Europe open and be ready - such as lingering at the top end of its INCOMPLETE asia range. Be aware through that if the lines are flat at the top of the range WHILST THE RANGE IS STILL FORMING this does not mean price was flat, it means that price was pushing up and growing the range. (Price can't breakout until the range has formed at the end of the session)
The currency pairs are organised to show the strength or weakness of the selected group - this means that the base currency is always the select group. This is to present the data with currencies moving in the same direction rather than some reversed but meaning the same in relation to currency strength. In the NZD example:
NZDAUD (not AUDNZD )
NZDCAD
NZDCHF
NZDEUR (not EURNZD )
NZDGBP (not GBPNZD )
NZDJPY
NZDUSD
I hope its useful. This is the most powerful indicator I've managed to write yet. It was difficult to make the code efficient enough to fit into the pinescript limit and still do everything.

Zeta BreakoutIf I ask you what moves the price, most of you will say the same old answer: Demand & Supply
But who creates Demand & Supply? You or Me, the retailers? No. It is Big Institutions and Mutual Funds and Big Banks which create this demand and supply because the
share of retailers in Stock Market is so little it does not affect the price in a big way.
The Big Institutions, Mutual Funds, Big Banks or in some cases Governments, are collectively called Smart Money.
When Smart Money steps in, the previous levels of Support or Resistance are broken and then the up or down move starts which most probably goes a certain distance.
Now the Support or Resistance levels are not static, they are dynamic in nature and keep changing with the time.
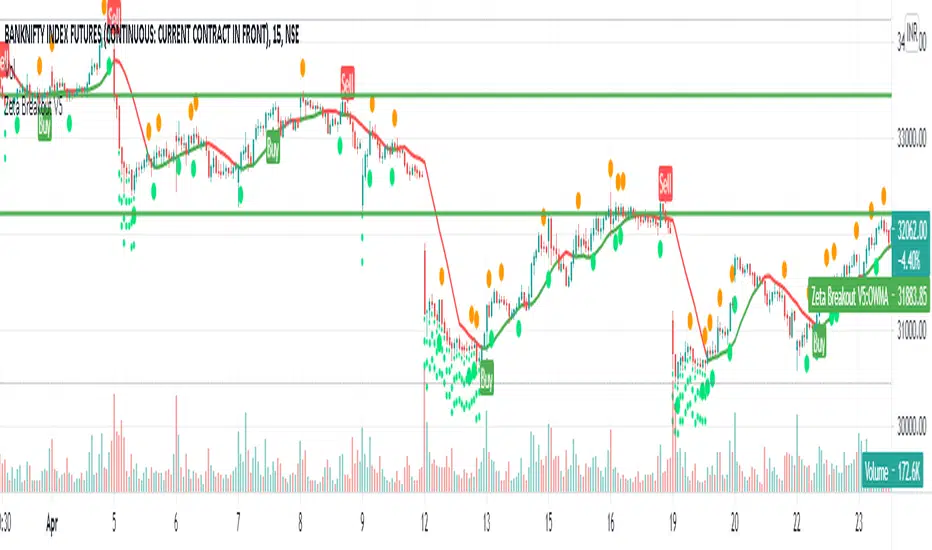
How does this indicator work?
Zeta Breakout dynamically and automatically detects and marks these levels and when the price break-outs or break-downs or bounces up or down from these levels, the Buy or Sell Signals are generated for you to follow.
The indicator keeps watching previous or newly created levels of Support or Resistance and as soon as price crosses these levels or bounces from these levels, the user is alerted in the form of 'Buy' or 'Sell' Signals.
How to use this indicator?
1. When you see a Buy Signal, take Buy Position and hold it till either (a) You see opposite signal or (b) Your Stop Loss is hit which is ideally the low of candle preceding the signal candle or any other user defined SL. If your stop loss is hit and then price again starts moving in the same direction as indicated by the last Buy signal, take a fresh position as soon as the price crosses the level where previous signal is sitting.
2. When you see a Sell Signal, close your Buy Position, take a Sell position and hold it till either (a) You see opposite signal or (b) Your Stop Loss is hit which is ideally the high of candle preceding the signal candle or any user defined SL. If your stop loss is hit and then price again starts moving in the same direction as indicated by the last Sell signal, take a fresh position as soon as the price crosses the level where previous signal is sitting.
What are the target instruments/markets for this indicator?
This indicator can be used on Stocks, Indices, Gold , Silver , Currency Pairs, Crude Oil or anything being trades on any exchange in the world.
This indicator is not limited to any specific time-frame. You may select any time-frame which suits your trading style.
How can you get this indicator?
This is an invite-only paid indicator but we can give you FREE TRIAL for 05 days if you are interested.
For Free Trial, send a message to @jellygill
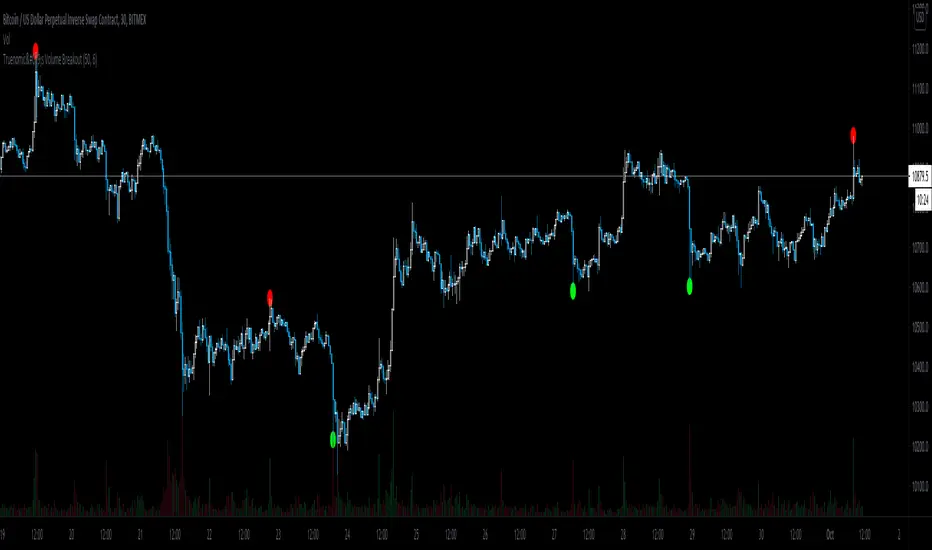
Truenomic's Volume BreakoutAn indicator that determines the breakout of the standard deviation of volume over a certain period.
[RS]The Breakout IndicatorSignals when there is a breakout from the trading range(donchian channel up to 300 bars back).
