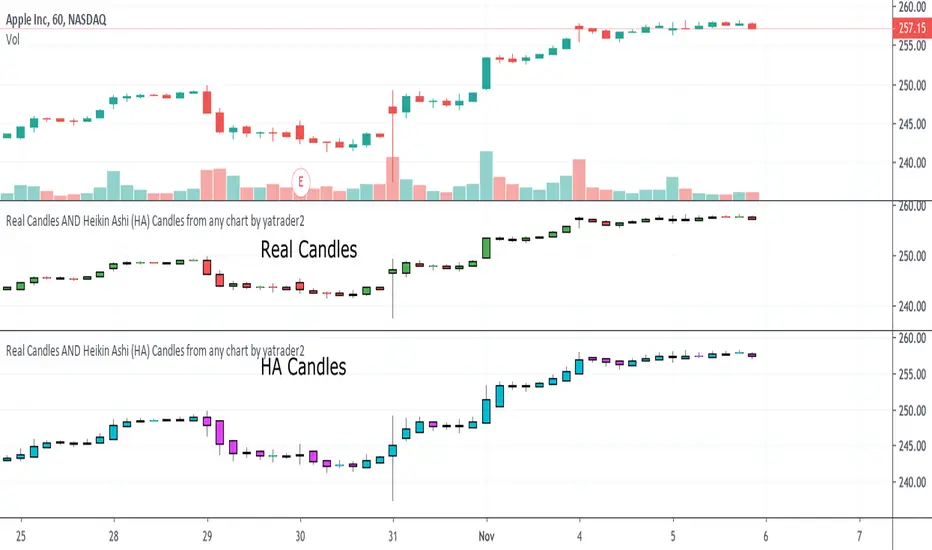
50% of Previous 1H Candle (Color Logic)📌 Script Title: 50% Midpoint of Previous 1H Candle (Color Coded)
📝 Description:
This indicator draws a horizontal line at the 50% (midpoint) of the most recently closed 1-hour candle, helping traders visualize intraday support/resistance and sentiment bias.
🔹 Key Features:
Plots the midpoint of the last 1H candle as a horizontal line.
Color-coded line and label:
🟢 Green: Previous candle was bullish
🔴 Red: Previous candle was bearish
⚪ Gray: Neutral (doji or equal open/close)
Displays the exact price level with a floating label.
Works on any lower timeframe chart (e.g., 5m, 15m, 30m).
Automatically updates every hour after the 1H candle closes.
📈 Use Cases:
Trade around the 1H midpoint as a dynamic pivot zone.
Confirm or fade price breakouts/rejections at this level.
Use it with trendlines, supply/demand zones, or VWAP.
🔍 Technical Notes:
The midpoint is calculated using:
Midpoint = (High + Low) / 2
from the most recent closed 1H candle.
Color logic is based on whether the 1H candle closed above or below its open.
🚀 Enhancement Ideas (future updates):
Add optional alerts on cross of the midpoint.
Show multiple historical midpoint levels.
Input toggle to enable/disable color coding.
Whether you’re scalping intraday or watching for reaction zones, this tool gives you a clean, real-time level to anchor your trades around.
Happy trading! 💹
— Built with ❤️ in Pine Script v6
Search in scripts for "candle"
Digital Clock with Candle Alert📊 Digital Clock with Candle Alert
A sleek, customizable digital clock for your trading charts that displays real-time with seconds and provides visual alerts before new candles form. Never miss a candle entry again!
✨ Key Features:
- Real-time Digital Clock - Shows hours, minutes, and seconds in your chosen timezone
- Visual Candle Alerts - Blinking notification before new candles form
- Multi-Timeframe Alerts - Get alerts for any timeframe regardless of your chart period
- Fully Customizable - Colors, size, position, and alert timing all configurable
- Half-Second Blinking - Eye-catching 2Hz blink rate for maximum visibility
- 6 Timezone Options - Exchange, UTC, New York, London, Tokyo, Sydney
🎯 Use Cases:
- Scalping - Know exactly when the next candle will form
- Entry Timing - Perfect for strategies that enter on new candles
- Multi-Timeframe Trading - Monitor higher timeframe candles while on lower timeframes
- General Awareness - Always know the current time in your trading timezone
⚙️ Settings:
Time Settings:
- Timezone selection (Exchange default or specific zones)
Display Options:
- Text and background colors for normal operation
- Alert colors for blinking state
- Text size (tiny to huge)
- Position (9 locations on chart)
Alert Configuration:
- Enable/disable blinking alerts
- Select timeframe to monitor
- Alert lead time (5 seconds to 1 hour)
📝 Important Notes:
- Clock updates depend on incoming price ticks
- During low-volume periods, updates may be less frequent
- Works best on liquid instruments during active market hours
- Alert timeframe is independent of your chart timeframe
💡 Tips:
- Use contrasting alert colors for maximum visibility
- Set lead time based on your reaction needs
- Position clock where it won't obstruct price action
- Try red background with white text for urgent alerts
🔄 Version 1.0 - Initial release
50/100 EMA Crossover with Candle Confirmation📘 **50/100 EMA Crossover with Candle Confirmation – Strategy Description**
The **50/100 EMA Crossover with Candle Confirmation** is a trend-following strategy designed to filter high-probability entries by combining exponential moving average (EMA) crossovers with strong price action confirmation. This strategy aims to reduce false signals commonly associated with EMA-only systems by requiring a **candle close confirmation in the direction of the trend**, making it more reliable for intraday or swing trading across Forex, crypto, and stock markets.
---
### 🔍 **Core Logic**
* The strategy is based on the interaction of the **50 EMA** (fast-moving average) and the **100 EMA** (slow-moving average).
* **Trend direction** is determined by the crossover:
* **Bullish Trend**: When the 50 EMA crosses **above** the 100 EMA.
* **Bearish Trend**: When the 50 EMA crosses **below** the 100 EMA.
* To **filter out false breakouts**, a **candle confirmation** is used:
* For a **Buy signal**: After a bullish crossover, wait for a strong bullish candle (e.g., full-body green candle) to **close above both EMAs**.
* For a **Sell signal**: After a bearish crossover, wait for a strong bearish candle to **close below both EMAs**.
---
### ✅ **Entry Conditions**
**Buy Entry:**
* 50 EMA crosses above 100 EMA.
* Latest candle closes **above both EMAs**.
* Candle must be bullish (green/full body preferred).
**Sell Entry:**
* 50 EMA crosses below 100 EMA.
* Latest candle closes **below both EMAs**.
* Candle must be bearish (red/full body preferred).
---
### 🛑 **Exit or Take-Profit Options**
* **Fixed TP/SL**: 1:2 or 1:3 risk-reward.
* **Trailing Stop**: Based on recent swing highs/lows or ATR.
* **EMA Exit**: Exit trade when the candle closes on the opposite side of 50 EMA.
---
### ⚙️ **Best Settings**
* **Timeframes**: 5M, 15M, 1H, 4H (works well on most).
* **Markets**: Forex, Crypto (e.g., BTC/ETH), Indices (e.g., NASDAQ, NIFTY50).
* **Recommended filters**:
* Use with RSI divergence or volume confirmation.
* Avoid using during high-impact news (especially on lower timeframes).
---
### 🧠 **Why This Works**
The 50/100 EMA crossover provides a **medium-term trend signal**, reducing noise seen in fast EMAs (like 9 or 21). The candle confirmation adds a **momentum filter**, ensuring price supports the directional bias. This makes it suitable for traders who want a balance of trend and entry precision without overcomplicating with too many indicators.
---
### 📈 **Advantages**
* Simple yet effective for identifying trends.
* Filters out fakeouts using candle confirmation.
* Easy to automate in Pine Script or other trading bots.
* Can be combined with support/resistance or SMC zones for better confluence.
---
### ⚠️ **Limitations**
* May lag slightly in ranging markets.
* Late entries possible due to confirmation candle.
* Works best with additional volume or volatility filter.
IU Inside/Harami candlestick patternDESCRIPTION
The IU Inside/Harami Candlestick Pattern indicator is designed to detect bullish and bearish inside bar formations, also known as Harami patterns. This tool gives users flexibility by allowing pattern detection based on candle wicks, bodies, or a combination of both. It highlights detected patterns using colored boxes and optional text labels on the chart, helping traders quickly identify areas of consolidation and potential reversals.
USER INPUTS :
Pattern Recognition Based on =
Choose between "Wicks", "Body", or "Both" to determine how the inside candle pattern is identified.
Show Box =
Toggle the appearance of colored boxes that highlight the pattern zone.
Show Text =
Toggle on-screen labels for "Bullish Inside" or "Bearish Inside" when patterns are detected.
INDICATOR LOGIC :
Bullish Inside Bar (Harami) is detected when:
* The current candle's high is lower and low is higher than the previous candle (wick-based),
* or the current candle’s open and close are inside the previous candle’s body (body-based),
* and the current candle is bullish while the previous is bearish.
Bearish Inside Bar (Harami) is detected when:
* The current candle's high is lower and low is higher than the previous candle (wick-based),
* or the current candle’s open and close are inside the previous candle’s body (body-based),
* and the current candle is bearish while the previous is bullish.
The user can choose wick-based, body-based, or both logics for pattern confirmation.
Boxes are drawn between the highs and lows of the pattern, and alert messages are generated upon confirmation.
Optional labels show the pattern name for quick visual identification.
WHY IT IS UNIQUE :
Offers three different logic modes: wick-based, body-based, or combined.
Highlights patterns visually with customizable boxes and labels.
Includes built-in alerts for immediate notifications.
Uses clean and transparent plotting without repainting.
HOW USER CAN BENEFIT FROM IT :
Receive real-time alerts when Inside/Harami patterns are formed.
Use the boxes and text labels to spot price compression zones and breakout potential.
Combine it with other tools like trendlines or support/resistance for enhanced accuracy.
Suitable for scalpers, swing traders, and price action traders looking to trade inside bar breakouts or reversals.
DISCLAIMER :
This indicator is not financial advice, it's for educational purposes only highlighting the power of coding( pine script) in TradingView, I am not a SEBI-registered advisor. Trading and investing involve risk, and you should consult with a qualified financial advisor before making any trading decisions. I do not guarantee profits or take responsibility for any losses you may incur.
Two Candle Theory (Filtered) - Labels & ColorsOverview
This Pine Script classifies each candle into one of nine sentiment categories based on how the candle closes within its own range and in relation to the previous candle’s high and low. It optionally filters the strongest bullish and bearish signals based on volume spikes.
The script is designed to help traders visually interpret market sentiment through configurable labels and candle colors.
⸻
Classification Logic
Each candle is assessed using two metrics:
1. Close Position – where the candle closes within its own high-low range (High, Mid, Low).
2. Close Comparison – how the current close compares to the previous candle’s high and low (Bull, Bear, or Range).
Based on this, a short label is assigned:
• Bullish Bias: Strongest (SBu), Moderate (MBu), Weak (WBu), Slight (SlB)
• Neutral: Neutral (N)
• Bearish Bias: Slight (SlS), Weak (WBa), Moderate (MBa), Strongest (SBa)
⸻
Volume Filter
A volume spike filter can be applied to the strongest signals:
• SBu and SBa are only shown if volume is significantly higher than the average (SMA × threshold).
• The filter is optional and user-configurable.
⸻
Display Options
Users can control:
• Whether to show labels, bar colors, or both.
• Which of the nine label types are visible.
• Custom colors for each label and corresponding bar.
⸻
Visual Output
• Labels appear above or below candles depending on bullish or bearish classification.
• Bar colors reflect sentiment for quicker visual scanning.
⸻
Use Case
Ideal for identifying momentum shifts, validating trade entries, and highlighting candles that break out of previous ranges with conviction and/or volume.
⸻
Summary
This script simplifies price action by translating each candle into an interpretable sentiment label and color. With optional volume filtering and full display customization, it offers a practical tool for discretionary and systematic traders alike.
Candle SequenceLooking to easily identify moments of strong market conviction? "Racha Velas" (or your chosen English name like "Consecutive Candles Streak") allows you to visualize clearly and directly sequences of consecutive bullish and bearish candles.
**Key Features:**
* **Real-time Counting:** Displays the number of consecutive candles directly on the chart.
* **Visual Customization:** Adjust the text size and color for optimal visualization.
* **Vertical Offset:** Control the position of the counter to avoid obstructions.
* **Maximum Streaks Table (Optional):** Visualize the largest bullish and bearish streaks found in the chart's history, useful for understanding volatility and price behavior.
* **Easy to Use:** Simply add the indicator to your chart and start analyzing.
This indicator is a valuable tool for traders looking to confirm trends, identify potential exhaustion points, or simply understand price dynamics at a glance. Give it a try and discover the market's streaks!
*****************************************************************************************************
¿Buscas identificar momentos de fuerte convicción del mercado? "Racha Velas" te permite visualizar de forma clara y directa las secuencias de velas consecutivas alcistas y bajistas.
**Características principales:**
* **Conteo en Tiempo Real:** Muestra el número de velas consecutivas directamente en el gráfico.
* **Personalización Visual:** Ajusta el tamaño y color del texto para una visualización óptima.
* **Offset Vertical:** Controla la posición del contador para evitar obstrucciones.
* **Tabla de Rachas Máximas (Opcional):** Visualiza las mayores rachas alcistas y bajistas encontradas en el historial del gráfico, útil para entender la volatilidad y el comportamiento del precio.
* **Fácil de Usar:** Simplemente añade el indicador a tu gráfico y comienza a analizar.
Este indicador es una herramienta valiosa para traders que buscan confirmar tendencias, identificar posibles agotamientos o simplemente entender la dinámica del precio en un vistazo. ¡Pruébalo y descubre las rachas del mercado!
Multi Candle Body MapperMulti Candle Body Mapper
Visualize higher-timeframe candle structure within lower timeframes — without switching charts.
This tool maps grouped candle bodies and wicks (e.g., 15min candles on a 5min chart) using precise boxes and lines. Ideal for intraday traders who want to analyze market intent, body bias, and wick rejection in a compressed, organized view.
Features:
Visualize 3, 6, or 12 candle groups (e.g., 15min / 30min / 1H views)
Body box shows bullish/bearish color with adjustable transparency
Wick box shows high-low range with adjustable thickness and color
Dashed line at group close level for market direction hint
Full color customization
Toggle individual elements ON/OFF
Clean overlay – doesn’t interfere with price candles
Great for spotting:
Hidden support/resistance
Momentum buildup
Reversal traps and continuation setups
Keep your chart simple but smarter — all without changing your timeframe.
DTFX Time based range candle box [Wang Indicators]DTFX Time based range candle box
Overview : This indicator highlights HTF Candles in specified timeframe within boxes and extend them until they are mitigated. Allowing traders to use them as zones from which you could find some turn-around or scalp
How does it works ?
Users can setup up to 8 desired timeframe with the hour/minute of the HTF candle
Be carrefull when you chose the time. You must put something coherent with the timeframe (e.g : you can't put 'minutes' = 45 if your timeframe is '1h')
Everyday, the indicator will draw a box around the specified candle for it timeframe
Once the price close above or bellow this candle in the same timeframe, the Zone become "active"
As long as the price doesn't came back into the zone, the retracements will extends
Once the price came back into the zone (in the current timeframe), it stops the expension
Exemple
Here we have those settings :
timeframe : 1 hour
time : 9am
mitigation : 10%
fibs : visible & dashed
The box highlights the 9am 1H candle (9am to 10am)
We now wait for the price to close in the same timeframe (1h here) above or bellow the price
At 11am we close above - the zone is now "active"'
Now we wait for the price to go back in this zone in the current timeframe (here 5min)
12:40am : we put a low above the 10% of the zone -> we stop the retracements, the zone is considered as "mitigated"
Settings
Hour : The hour of the begiging of the candle
Minute : Combined with hour (default 0)
Timeframe : In whichtimeframe we are looking for the candle
% Mitigation : % of the box in wich the price must go back-in in order to "mitigate" the box and stop the expension of the fibs/box (if settings enabled)
Retracements style : Hidden, dashed, dotted or lines for the fibs
Extend Box : extend the box itself until it get mitigated
Number of unmitigated zones : Max unmitigated zone drawed on the chart PER CONFIG
Timezone : Must be set to reflect your needs. (preferably the chart timezone)
How does it helps users ?
Once a Candle is "active" it can be used as a Zone
Fibonnacis levels (30, 50 and 70%) are displayed (if enabled)
Users can customize their apparence and the boxes as they see fit
The 30 - 50 - 70 levels are possible support/resistance that the price tend to bounce of off
You might find some success looking for an entry inside the zone at a level if price gives further confirmations such as a lower time frame flip.
Engulfing Candle Indicator with Single AlertEngulfing Candle Indicator with Alerts
This custom Pine Script indicator identifies Bullish and Bearish Engulfing Candles on the price chart, which are key reversal patterns. A Bullish Engulfing occurs when a smaller bearish candle is completely engulfed by a subsequent bullish candle, signaling a potential upward trend. Conversely, a Bearish Engulfing happens when a bullish candle is engulfed by a following bearish candle, indicating a possible downward trend.
The indicator highlights these patterns on the chart with green arrows for Bullish Engulfing and red arrows for Bearish Engulfing. It also includes an alert system that notifies the user whenever either of these patterns occurs.
The script uses an Average True Range (ATR) filter to ensure that the engulfing candles have sufficient size relative to market volatility. Additionally, users can adjust the minimum engulfing size to fine-tune the signal.
Crypto Candle Low Leverage TrackerCrypto Candle Low Leverage Tracker
The Candle Low Leverage Indicator is a powerful tool for long position traders seeking to manage risk effectively when using leverage. By evaluating the current candle's low price, this indicator helps traders make more informed decisions about potential entry points, stop losses, and leverage levels. The indicator matches the low of the candle to the leverage needed for liquidation, giving you a clear view of how leverage impacts your position.
This indicator provides two critical insights:
% from Candle Low: Tracks how much the price has moved from the low of the current candle. For long position traders, this percentage is crucial for understanding how far the price has come off the low and deciding whether it’s safe to enter a position or if further price action is needed.
Leverage Needed: Estimates the leverage required to reach the candle's low as the liquidation price. Long traders can use this information to adjust leverage to a safer level, ensuring they don’t overexpose themselves to liquidation risks by matching leverage to the candle’s low.
Key Features:
Customizable table positioning (top, middle, bottom).
Toggle options to show/hide % from Candle Low and Leverage Needed.
Visual indicators with color changes: green for positive change, red for negative change, and blue for leverage requirements.
Ideal for long traders, this tool helps evaluate market conditions, manage risks, and calculate the best leverage to use in long trades, ensuring that leverage aligns with the candle’s low to prevent unnecessary liquidations.
Stochastic candles "Stochastic Candles" is designed to provide higher timeframe stochastic calculations and enhance the chart with additional visual aids like colored candles and EMA plotting.
Features of the Script:
Higher Timeframe Stochastic Calculation:
This indicator computes the stochastic %K and %D values for a specified higher timeframe and ensures these values are fetched for the higher timeframe data.
Dynamic Label Placement:
The script places labels on the chart displaying the %K and %D values above and below the bars, respectively.
Labels are dynamically deleted after being updated, ensuring only the latest values are visible.
Candle Coloring:
Candles are colored blue if %K > %D, yellow if %D > %K, and retain the default color otherwise.
Exponential Moving Average (EMA):
This indicator work fine . Consolidate market put effects on its performance .
Opening Candle High/Low with Time Zone and Minute Offset
Title: Opening Candle High/Low with Time Zone and Minute Offset
Description:
The Opening Candle High/Low with Time Zone and Minute Offset indicator is a versatile tool that highlights the high and low of the first candle of the trading session, adjusted for your preferred time zone and minute offset. It is particularly useful for traders who focus on opening ranges as key reference points for their trading strategies.
---
Features:
1. Time Zone and Minute Adjustment:
- Allows customization of the start time by applying a time zone offset (in hours) and a minute offset.
- Ideal for traders operating in different time zones or trading sessions that don't align with midnight UTC.
2. Dynamic First Candle Detection:
- Automatically captures the high and low of the first candle after the adjusted time.
- Resets daily, ensuring accurate levels for each new trading session.
3. Visual Representation:
- Plots the high and low levels of the first candle directly on the chart for easy reference.
- Uses distinct colors (green for the high and red for the low) and adjustable line widths for clarity.
4. Simplicity and Versatility:
- Works across all markets and timeframes, providing essential information for opening range breakout strategies, support/resistance analysis, or session-based trading.
---
How It Works:
1. Time Adjustment:
- The indicator adjusts the current chart time by applying the user-defined hour and minute offsets.
- This ensures the "opening candle" aligns with your specific trading session requirements.
2. First Candle Detection:
- When the adjusted time matches the start of a new day (midnight with offsets), the indicator captures the high and low of the first candle.
- These values are stored and remain static throughout the trading day.
3. Plotting:
- The high and low levels of the opening candle are plotted on the chart, providing visual reference points for traders.
---
Use Case:
- This indicator is ideal for traders who rely on the opening range of a session for planning trades, such as breakout or reversal strategies.
- It can also serve as a key tool for identifying significant price levels in session-based trading.
Simplify your trading analysis and align your strategy with this customizable and intuitive indicator.
Brijesh TTrades candle plot"Brijesh TTrades candle plot" is a powerful and customizable indicator that allows you to overlay higher timeframe candles directly on your chart. Choose your desired timeframe (e.g., Daily, Hourly) and plot up to 10 recent candles with precise control over color, wick style, and width. The candles are offset by 40 bars to the right, providing a clear and unobstructed view of the current price action. Ideal for multi-timeframe analysis and gaining deeper insights into market trends.
Lower and Higher Timeframe Candles with Labels-AYNETHow It Works
Input Parameters:
Users define:
LTF timeframe (e.g., 5m, 15m, 1H).
Time range (e.g., 9 AM to 5 PM) for candle visibility.
Candle colors for bullish, bearish, and wick.
Data Fetching:
The script fetches LTF candle data (open, high, low, close) using request.security.
Conditional Plotting:
Candles are plotted only if the current time falls within the specified range.
Dynamic Label:
A label with the LTF name is created and updated dynamically as the chart progresses.
Use Cases
Multi-Timeframe Analysis:
Analyze LTF price action within the context of a higher timeframe chart.
Session-Specific Focus:
Limit candle visibility to specific trading hours for better insights.
This script combines LTF visualization and a dynamic label for clear and actionable multi-timeframe analysis.
Large Candle Detector (6-Candle Comparison)This indicator identifies large price candles that are bigger than the previous six candles, helping traders spot potential breakout or reversal signals. By highlighting significant candles compared to recent price action, it provides insights into key moments of increased volatility or momentum shifts in the market.
Next Candle Predictor with Auto HedgingThe "Next Candle Predictor with Auto Hedging" is a Pine Script indicator designed for use on TradingView. It combines predictive analysis and basic hedging techniques to assist traders in making informed decisions. Here's a detailed explanation suitable for public sharing on TradingView:
Overview
This script predicts the closing price of the next candle based on the current candle's open and close prices. It also includes an auto hedging feature that suggests potential hedging levels to mitigate risk based on the predicted price movement. The indicator is particularly useful for traders looking to enhance their trading strategies with predictive analytics.
Key Features
Next Candle Prediction:
The indicator analyzes the current candle's data (open and close prices) to predict whether the next candle will close higher or lower.
If the current candle is bullish (close > open), it predicts a higher close for the next candle. Conversely, if the candle is bearish, it predicts a lower close.
Auto Hedging:
The script calculates a hedging level based on the predicted close price.
If the predicted close indicates a bullish move, the hedge level is set slightly below the predicted close, suggesting where a trader might consider placing a hedge. If the prediction indicates a bearish move, the hedge level is set above the predicted close.
Elliott Wave Analysis:
The script includes a basic implementation of identifying significant price movements, akin to Elliott Wave analysis, by detecting peaks and troughs over a specified number of bars (wave length).
This can help traders identify potential trend reversals or continuations.
How It Works
Input Parameters: Users can customize the waveLength parameter, which determines how many bars back the script looks to identify significant highs and lows.
Peak and Trough Detection: The script identifies the highest high and lowest low within the specified wave length, plotting these points on the chart for visual reference.
Prediction Logic: The predicted close is calculated based on the current candle's behavior, allowing traders to anticipate price movements.
Hedging Level Calculation: The script dynamically calculates a hedging level based on the predicted close, providing a visual cue for potential risk management strategies.
Visual Representation
The indicator plots:
Elliott Wave Highs: Marked in green.
Elliott Wave Lows: Marked in red.
Predicted Close: Shown as a blue step line.
Hedge Level: Displayed as an orange step line.
Benefits
Enhanced Decision-Making: By providing predictions and potential hedging levels, traders can make more informed decisions about entering or exiting positions.
Risk Management: The auto hedging feature helps traders manage risk by suggesting levels where they might place hedges against adverse price movements.
Customizable: The script allows for user-defined parameters, making it adaptable to different trading strategies and market conditions.
Conclusion
The "Next Candle Predictor with Auto Hedging" indicator is a powerful tool for traders seeking to enhance their trading strategies with predictive analytics and risk management techniques. By utilizing this indicator, traders can gain insights into potential price movements and make more informed trading decisions.
Feel free to explore the script, customize it to fit your trading style, and engage with the TradingView community for further insights and improvements!
Related
Candle Strength Oscillator by SyntaxGeekThis candle strength oscillator displays a smoothed rolling difference between the body range (close and open) and total candle range (high and low).
When candles have small bodies, such as a doji, it can indicate weakness, when candles have essentially little to no wicks it can indicate strength.
There are two modes of display for the strength trend to show potential exhaustion on either side, bollinger bands and donchian channels. Each has their own pros and cons but as most are familiar with bollinger bands this is the default.
Another feature is the ATR measurement, which can assist in displaying an overall reduction in range volatility when comparing historical price movements to current oscillations.
The zero line can show some importance with regards to the peaks and valleys of the main measurement, when everything is trending and there's a reversal, if the zero line isn't broken it could be considered a trend continuation pullback vs a complete reversal.
Trend arrows and bar coloring are available but should not be considered trade signals for entry and exit, merely just another way of viewing the lower study information.
As the raw data of each candle measurement is quite noisy, the entire dataset is passed through an HMA smoothing process, if more options are requested I'll consider adding them.
Thanks for view my script and happy trading!
Joesax Red to Green with Alert V2 Candle IndicatorThis indicator displays transitions of candles from red to green and from green to red on a chart, with the ability to set an adjustable percentage threshold. When a candle transitions from red to green and the percentage change exceeds the specified threshold, a red to green transition signal is issued. Similarly, when a candle transitions from green to red and the percentage change exceeds the specified threshold, a green to red transition signal is issued.
Parameters:
Percentage threshold %: Allows you to set the percentage threshold to determine when to consider the transition from one candle to another significant.
Description:
This indicator uses the absolute percentage change between the opening price and the closing price of a candle to determine whether the candle is red or green. When a candle transitions from red to green and the percentage change exceeds the set threshold, a red to green transition signal is issued. Similarly, when a candle transitions from green to red and the percentage change exceeds the set threshold, a green to red transition signal is issued. Alerts are triggered when such transitions occur.
This indicator helps traders identify significant directional changes on the chart, enabling them to make informed decisions during financial market analysis.
Previous Candle + Inside/OutsideThe script uses the previous candle of the current timeframe to assess the state of the current candle.
1. Previous candle high/low and midpoint are displayed
2. Highlights current bar if INSIDE previous candle
3. Highlights current bar if POTENTIAL OUTSIDE bar. This condition uses the logic that if the previous high/low has been swept and price then reaches previous bar 50%, then an OUTSIDE bar is possible.
4. If current candle breaks previous high/low, a label is added to identify.
5. If above condition is true and current candle color is opposite of previous, then label is highlighted to show possible bull/bear condition.
6. If current candle live price is below previous midpoint, a BEAR label is shown
7. If current candle live price is above previous midpoint, a BULL label is shown
I personally use the indicator on Daily/Weekly/Monthly charts to help with my overall market assessment. However users may find their own use for the indicator...or modify it to their own preferences.
As ever, the indicator should only be used with live trading accounts after thorough backtesting using a large data range.
Candle Close TrendFirst of all, a huge credit to Wade for all the help with this indicator. An absolute Legend!
The idea behind this indicator is to identify a potential trend with simply the close of candles.
If a candle closes above the previous candle High, the trend would be "bullish" and remain bullish until there is a candle that closes below the previous candle Low. The opposite is true for a "bearish" trend.
As always, this is NOT intended to be used by itself, but with other TA.
For cleanest results, I find it best to use with the candle borders turned off in the chart settings but that is just my preference.
Works on all timeframes.
First CandleDay first candle breakout Indicator
In this indicator script, we search for the high and low of the first candle of the day. After the breakout of either the high or low, we initiate a trade. This indicator is based on the breakout of the opening range of the first candle.
Buy Breakout -
1. Identify the high and low of the first candle of the day.
2. If there is an upside breakout, or a downside breakout, stop extend the high and low accordingly.
Sell Breakout -
1. Identify the high and low of the first candle of the day.
2. If there is a downside breakout or an upside breakout, stop extend the high and low accordingly.
Height of Candle BodyUnderstanding the Height of Candlestick Body
Candlestick charts are a popular method of displaying price data in financial markets. They provide a visual representation of price movements and are used by traders to make informed decisions about buying and selling assets. Understanding the height of a candlestick body is an important aspect of technical analysis and can help traders identify trends and make profitable trades.
The height of a candlestick body is the distance between the opening and closing price of an asset over a given time period. When the closing price is higher than the opening price, the candlestick body is typically colored green or white and is considered bullish. Conversely, when the closing price is lower than the opening price, the candlestick body is typically colored red or black and is considered bearish.
The height of the candlestick body is important because it can provide valuable information about market sentiment. If the candlestick body is relatively small, it suggests that there is indecision in the market and that buyers and sellers are evenly matched. Conversely, if the candlestick body is relatively large, it suggests that there is a significant amount of buying or selling pressure in the market.
Weekly Options Expiry Candle V.2In India Weekly options expire on Thursday and that creates a different price action candle than the week timeframe.
My previous script Weekly Options Expiry Candle has some limitations. This script overcame those limitations and added some features.
You can use this in any intraday time frame candle.
It will show:
All expiry candle in box format
Expiry OHLC label
Pivot (Floor or Fibonacci) based on expiry OHLC data
Developing Expiry candle and Pivot
A table showing expiry range(high-low) and Expiry body abs(open-close) stats.
You can turn on or off any feature.
Please let me know if you found this script useful or have any questions or suggestions.
NSE:BANKNIFTY
NSE:NIFTY