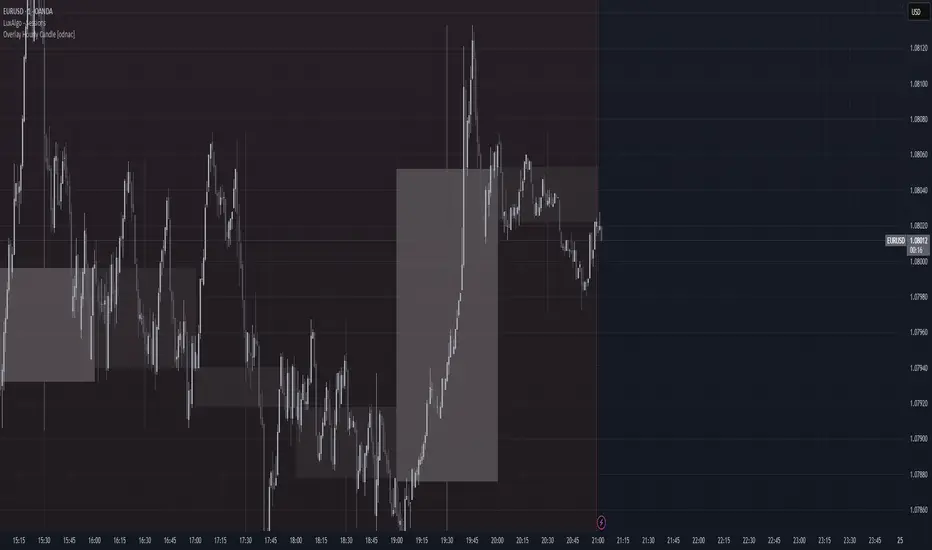
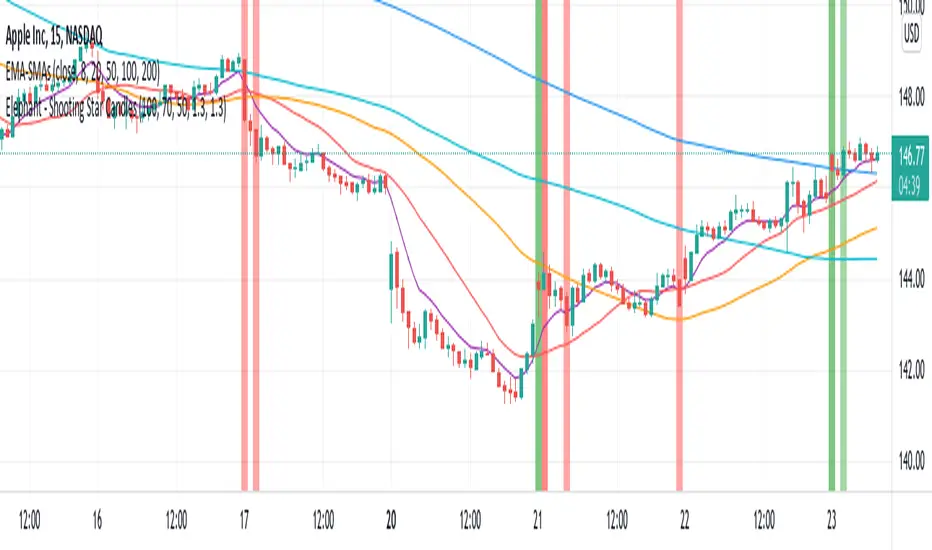
15m Candle ToolShows historical 15min candles for the 1m, 3m , and 5m time frames.
Counts down the time until the current 5m, 15m, and 1H candles close.
Recommended use on the 1m, 3m , and 5m TimeFrames!!!
Legend:
Vertical Lines (Left to Right)
-15m Candle wick (solid line) *
-Close of current 5m candle (red dotted)
-Close of current 15m candle (blue dashed)
- Close of current 1H candle (green solid)
Horizontal Lines (Top to Bottom)
- Previous 15m high (top of wick) *
- Subdivisions of the low to high of the previous 15m candle (.25, .50, .75) (WHITE LINES, .50 is extended)
- inter candle average of the highs within the previous 15m candle (solid green)
- average of the inter candle highs and lows (grey dashed)
- inter candle average of the lows within the previous 15m candle (solid red)
- Previous 15m low (bottom of wick) *
Previous Candle Body *
* = Changes color based on the bar color.
Search in scripts for "candle"
Candle Percent Volatility by AllenlkThis indicator gives you the percentage movement of each candle. Measurements are taken between the candle High point and Low point, and also between the Open and Close and calculated in percent %. From there it smooths out the data with a moving average. This gives you an idea of how much volatility is within each candle given the time resolution of the chart.
I like to use this information as a way to turn off a strategy, or select a proper time resolution for a strategy. If each candle has less than 2.5% Volatility most strategies will typically buy and sell rapidly at prices that are too close together, potentially losing money. During those times it seems best to either temporarily turn off the strategy, change the time resolution or switch to another strategy.
Inefficient Candle TrackerThe Inefficient Candle Tracker indicator highlights large, inefficient price moves and plots their midpoints as Squared Up Points.
Detects large candles using Percentile or ATR multiple methods
Draws dynamic dashed lines at candle midpoints until price “squares them up”
Built-in alerts for new SUP creation and when levels are touched
Great for spotting unfinished business in price action, confluence with support/resistance, and potential return levels.
Daily Candle by NatantiaIntroduction to the Daily Candle Indicator
The Daily Candle Indicator is a powerful and customizable tool designed for traders to visualize daily price action on any chart timeframe.
This Pine Script (version 5) indicator, built for platforms like TradingView, overlays a single candle representing the day's open, high, low, and close prices, with options to adjust its appearance and session focus.
Key Features:
Customizable Appearance: Users can set the colors for bullish (default green) and bearish (default white) candles, as well as the wick color (default white). The horizontal offset and candle thickness can also be adjusted to fit the chart layout.
Dynamic Updates: The candle updates on the last bar, with wicks drawn to reflect the daily high and low, providing a clear snapshot of the day's price movement.
Have a nice trades!
-Natantia
Time Based Range CandleThis indicator creates a visual candle representation from price action during a specified time period.
Key Features:
Configurable Sessions: Set any calculation period (when range is measured) and display period (when visualization appears)
Candle Visualization: Draws a large candle showing open, close, high, low with proper body coloring
Wick/Tail Analysis: Displays wicks and tails with quarter-level subdivisions based on candle type (bullish vs bearish)
End Marker: Vertical line marks exactly when the calculation period ends
Quarter Lines: Optional dotted/dashed lines showing 25%, 50%, 75% levels within body, wicks, and tails
Common Use Cases:
Overnight range analysis (18:00 - 6:00 ET) displayed during regular hours
Session-based range trading (Asian, London, NY sessions)
Custom time period analysis for any market
The indicator follows proper candle terminology where wicks and tails are measured differently for bullish vs bearish candles, making it useful for precise level analysis and range trading strategies.
High Volume Reversal CandlesIdentifies candles which display reversal patterns (mainly hammers, inverted hammers, spinning top) on unusually high volume.
This makes the candlestick pattern more likely to fulfil.
Remember to always wait for confirmation; should only be used as an entry locator, not entry trigger.
Big CandleBig Candles, most of the times, indicate actions by market makers . Also the candle high and low can be thought of as liquidity zones.
LaCrazy Smash CandleLaCrazy Smash Candle highlights powerful engulfing candles that signal potential momentum reversals or breakout continuation.
Smash Long: The candle's low touches or dips below the prior candle's low, then closes above the previous high with a strong body (minimum % of the candle range).
Smash Short: The candle's high touches or exceeds the prior high, then closes below the previous low with a strong body.
These “Smash” moves often occur at key pivot points, signaling decisive rejections or trend continuation. Customize the body strength filter to match your strategy needs.
Mark specific candle (e.g. bar 20)This Pine Script indicator, "Mark specific candle (e.g. bar 20)" (short title "Mark candle"), is a simple yet powerful tool to visually highlight a particular candle on your chart.
What it does:
It marks a specific candle (e.g., the 20th, 10th, or any number you choose) counting backwards from the most recent candle on your chart. The marked candle will be colored in a subtle light grey and also feature a tiny, matching grey arrow pointing down from above it.
Why it's useful:
This indicator helps you quickly identify and track a consistent reference point in recent price action. It's great for strategies that depend on fixed look-back periods or for simply keeping an eye on a specific historical candle's position as new data comes in.
Key Features:
Adjustable Candle Number: Easily change which candle is marked (e.g., 20th, 10th, 5th) directly from the indicator settings using the "Candle Number to Mark (from end)" input.
Clear Visuals: Both the candle color and a small arrow provide a subtle, yet effective, visual cue.
How to use:
Simply add this script to your TradingView chart. Then, open the indicator's settings to set your desired candle number.
Abusuhil Bullish CandlesAbusuhil Bullish Candles is a pattern recognition indicator designed to identify key bullish reversal candlestick formations including Hammer, Bullish Engulfing, Morning Star, Piercing Line, Three White Soldiers, and Three Inside Up.
The script includes optional filters such as Stochastic and Volume Confirmation, providing more precise signal detection.
Each pattern and filter is fully customizable via settings. Alerts are also included to support active trading workflows.
This script was written originally and does not copy open-source indicators. It's ideal for traders seeking visual clarity on bullish opportunities with professional-grade logic.
مؤشر الشموع الصعودية هو مؤشر احترافي يكتشف أبرز نماذج الانعكاس الصعودي في الشموع اليابانية مثل: Hammer، Bullish Engulfing، Morning Star، Piercing Line، Three White Soldiers، و Three Inside Up.
يوفر المؤشر فلاتر إضافية مثل فلتر Stochastic وفلتر الفوليوم لتعزيز دقة الإشارات. جميع الإعدادات قابلة للتعديل بما يتناسب مع احتياج كل متداول.
يحتوي المؤشر أيضًا على تنبيهات تلقائية لدعم استراتيجيات التداول اللحظي. تمت برمجة المؤشر من الصفر ويعتمد على منطق خاص غير منسوخ من سكربتات مفتوحة المصدر.
VWAP + Candle-Rating SELL (close, robust)This multi‐timeframe setup first scans the 15-minute chart for strong bearish candles (body position in the bottom 40% of their range, i.e. rating 4 or 5) that close below the session VWAP. When it finds the first such “setup” of a trading period, it pins the low of that 15-minute candle as a trigger level and draws a persistent red line there. On the 5-minute chart, the strategy then waits for a similarly strong bearish candle (rating 4 or 5) to close below that marked low—at which point it emits a one‐time SELL signal. The trigger level remains in place (and additional sell signals are locked out) until the market “rescues” the price: a 15-minute bullish candle (rating 1 or 2) closing back above VWAP clears the old setup and allows the next valid bearish 15-minute candle to form a new trigger. This design ensures you only trade the most significant breakdowns after a clear bearish bias and avoids repeated signals until a genuine bullish reversal resets the system.
Sweep Engulf 2 Candle🔍 Overview:
This script identifies Bullish Engulfing and Bearish Engulfing candlestick patterns on the chart. These formations are widely used in technical analysis to spot potential reversals in price action. The indicator helps traders quickly identify these patterns by marking them directly on the chart with small arrows.
📌 Features:
✅ Bullish Engulfing & Bearish Engulfing Detection
✅ Customizable Display Options (Enable/Disable Bullish or Bearish signals)
✅ Real-Time Alerts (Receive notifications when a pattern is formed)
✅ Optimized Marker Size (Smaller icons for better chart visibility)
📊 How It Works:
1. Bullish Engulfing Condition:
The second candle's low is lower than the first candle's low.
The second candle's close is higher than the first candle's open (if the first candle is bearish) OR higher than the first candle's close (if the first candle is bullish).
2. Bearish Engulfing Condition:
The second candle's high is higher than the first candle's high.
The second candle's close is lower than the first candle's close (if the first candle is bearish) OR lower than the first candle's open (if the first candle is bullish).
⚙️ How to Use:
Add the script to your TradingView chart.
Adjust settings to enable/disable Bullish or Bearish Engulfing patterns.
Enable alerts to receive real-time notifications when a pattern is detected.
Use this indicator to support your technical analysis and trade decisions.
📌 Notes:
This indicator is best used in combination with other technical analysis tools like support & resistance levels, trendlines, or volume analysis.
It works on all timeframes and asset
Wickless Candle Indicator with Extended Lines (final)This Pine Script indicator identifies “wickless” candles—those with no upper wick (when the close equals the high) or no lower wick (when the open equals the low)—and marks these events on the chart. When such a candle is detected, it:
Records the Level and Bar Index:
Saves the price level (high for wickless tops, low for wickless bottoms) and the bar index where the condition occurred.
Draws an Extended Horizontal Line:
Creates a green horizontal line for a wickless top or a red line for a wickless bottom, starting at the detection bar and extending across subsequent bars as long as the price remains below (for tops) or above (for bottoms) the recorded level.
Resets When the Price Breaks the Level:
If a future bar’s price moves beyond the saved level (i.e., a high above a wickless top or a low below a wickless bottom), the indicator resets that level, ending the extension of the line.
Visual Markers:
Additionally, it plots a small triangle above a wickless top and below a wickless bottom for easy identification on the chart.
Overall, this script helps traders visualize potential support or resistance levels created by candles that close at their highs or open at their lows, with lines that dynamically adjust as price evolves.
Multi-Timeframe Candles HistogramsAt some community members' requests, I have built on the original code to make it a single indicator with the option for users to check off which timeframes they want to be shown. Choices are 1-hour, daily, weekly, and monthly.
I couldn't figure out how to separate each timeframe into its own histogram, so this is the best I can offer at the moment. If any community member wants to take a crack at it, be my guest.
Colors are customizable.
If you have a paid TW account, you can lay it down twice and put the hour and daily on one and the weekly and monthly on the other.
That said, I hope you enjoy this version of this indicator.
R.I.P. Rob Smith, creator of TheStrat.
---
Key Features and Benefits
1. Custom Timeframe Selection:
- Choose from an array of timeframes ranging from minutes to months, giving you complete flexibility in your market analysis.
- Quickly switch between different timeframes (e.g., 1-hour, daily, or weekly) to track continuity across varying levels.
2. Visual Representation of High/Low Markers:
- Enable or disable the display of high and low points to better understand price ranges and reversals.
- These markers allow you to spot key turning points on different timeframes, facilitating better entry or exit decisions.
3. Enhanced Candle Visualization:
- Displays candles with precise price levels aligned to your chosen timeframe, giving a clearer view of price trends.
- Candles are color-coded to reflect price movement, which is customizable by the user.
---
How to Use This Indicator
Monitor Multiple Timeframes Simultaneously:
- Place the indicator on your chart and choose the timeframes you want to follow (e.g., hourly, daily, weekly, monthly).
- For each instance, checkmark the desired timeframes in the menu to ensure that you’re tracking the right period.
Achieve Timeframe Continuity:
- By aligning lower timeframes with higher ones, this tool helps you confirm trends, detect reversals, and avoid trades that go against the broader market movement.
---
Why This Indicator is Valuable for Traders
This tool simplifies a core principle of TheStrat—full timeframe continuity—by visually representing price action across multiple timeframes in a clear and actionable way. It removes the guesswork and helps traders stay in sync with market momentum, regardless of the timeframe they are analyzing.
This solution offers flexibility, clarity, and speed, enabling traders to quickly grasp critical movements and improve decision-making. Whether you are a scalper focusing on intraday moves or a swing trader watching weekly trends, this tool empowers you to maintain alignment with the overall market structure.
In essence, it brings the power of TheStrat to your fingertips by offering precise and easy-to-read visual aids, allowing you to seamlessly apply Rob Smith’s philosophy to your trading.
Engulfing Candle IndicatorThis indicator helps identify Bullish and Bearish Engulfing candle patterns on your chart.
Bullish Engulfing: Occurs when a green candle completely engulfs the prior red candle, signaling potential upward momentum.
Bearish Engulfing: Occurs when a red candle completely engulfs the prior green candle, signaling potential downward momentum.
The script highlights these patterns with green triangles below the bars for Bullish Engulfing and red triangles above the bars for Bearish Engulfing.
This tool is helpful for traders who use candlestick patterns as part of their technical analysis strategy.
Engulfing Candles Alert - Multi Symbol (Miu)This indicator plots triangle shapes on each engulfing candles (bullish or bearish) on current chart.
The main use for this indication is to set alerts on multiple symbols at once.
Please follow steps below to set your alarms:
1) Add indicator to the chart
2) Go to settings
3) Check symbols you want to receive alerts (choose up to 8 different symbols)
4) Check if you want only bullish or bearish alerts or both
5) Once all is set go back to the chart and click on 3 dots to set alert in this indicator, rename your alert and confirm
6) You can remove indicator after alert is set and it'll keep working as expected
What does this indicator do?
This indicator will generate alerts anytime a candle closes and reaches bullish or bearish engulfing condition for any of symbol set.
Alert messages example: "Bullish alert on {Symbol}"
This script requests open and close information for each symbol through request.security() built-in function.
Detailed indicator description:
If current bar open is less than or equal to the previous bar close AND current bar open is less than previous bar open AND current bar close is greater than previous bar open THEN True
bullishEngulfing = (openBarCurrent <= closeBarPrevious) and (openBarCurrent < openBarPrevious) and (closeBarCurrent > openBarPrevious)
The opposite condition will be bearishEngulfing
Feel free to give feedbacks on comments section below. Enhancement suggestions are welcome =).
Enjoy!
[F][IND] - Candle Range SizeDescription:
Understanding market volatility is paramount for making informed trading decisions, and the Candle Range Histogram Indicator is designed to provide traders with a visual representation of price volatility over time.
Key Features:
1. Histogram Display:
The indicator presents a histogram on your TradingView chart, offering a clear visualization of the range of each candle, calculated as the difference between the high and low prices.
2. Volatility Insight:
Easily identify periods of heightened or subdued volatility. Larger histograms indicate greater price ranges, suggesting increased volatility, while smaller histograms signify lower volatility.
3. Intraday Analysis:
Intraday traders can benefit from monitoring the Candle Range Histogram to gauge volatility patterns throughout the trading day. This information is valuable for setting realistic profit targets and adjusting risk management strategies.
4. Breakout Opportunities:
Recognize potential breakout opportunities by observing significant increases in candle range. Traders often associate expanded ranges with potential strong price movements.
5. Trend Confirmation:
Confirm the strength of trends by assessing consecutive candles with expanding or contracting ranges. This can aid trend-following traders in making more informed decisions.
It's important to note that while the histogram provides valuable information, it's usually more effective when used in conjunction with other technical indicators and analysis methods. Traders often combine multiple tools to gain a comprehensive understanding of the market and make well-informed trading decisions.
Alerts:
You can enable alerts on this indicator to receive timely notifications.
Disclaimer:
This indicator is provided for educational purposes only. Trading involves risk, and users should consult with a financial professional before making any trading decisions.
Your Feedback Matters!
Please feel free to comment or reach out if you have any improvement suggestions or if you would like to request the development of a specific indicator. Your feedback is invaluable!
Choose Symbol, candle and Trend modeThis Pine Script code is designed for technical analysis and visualization of price movements on the TradingView platform. It serves as a tool for traders and investors to:
Price Chart Analysis: The code plots the price chart of a selected symbol and utilizes Heikin-Ashi candlesticks to visualize price movements. This aids in better understanding price trends, support and resistance levels, retracements, and other price actions.
Trend Identification: The code also employs the Exponential Moving Average (EMA) to identify the price trend. EMA is commonly used to determine the strength and direction of a trend. Traders and investors can use this information to track trends and develop trading strategies.
Buy and Sell Signals: The code generates buy and sell signals based on EMA. These signals provide information on when to consider buying or selling a specific symbol. This is particularly useful for traders when making trading decisions.
Timeframe Customization: Users can adapt the code to different timeframes. This flexibility is valuable for those looking to develop strategies for both short-term and long-term trading.
Customization: The code allows users to customize various parameters, including the symbol, timeframe, Heikin-Ashi mode, and others. This enables it to be tailored to different assets and trading styles.
Please note that this code is provided for educational and informational purposes only. It does not constitute financial advice or recommendations for specific trading actions. Any trading decisions made using this code should be based on individual research, analysis, and a clear understanding of the associated risks.
Bar composition in 1minute | True candlestick colorThe indicator shows the true color of a bar based on the internal composition on 1 minute timeframe and the final outcome. It uses following parameters of 1minute and current timeframe inputs
relative bar close, average volume vs current volume and finally the volume of internal candles.
It follows following steps:
First, it defines the arrays of high, low, close, volume in one minute timeframe
Second, it identifies the negative and positive volume based on the bar closing at one minute timeframe
Third , it adds all the volume and find whether the overall volume is positive or negative for overall bar in higher timeframe (current timeframe)
Fourth, it compare the volume in current timeframe to average of volume in in current timeframe
Fifth, if relative closing, relative volume (current timeframe) and the combined volume (in 1 minute timeframe) gives same outcome then color of the bar is decided whether the bar is bullish, bearish or inconclusive/contnuation.
Through this you get to check price action in 1minute timeframe and the ultimate outcome in current timeframe. this helps in understanding whether the bar is truly bullish or bearish or continuation of the trend
Feel free to connect for any query.
Open Interest with Heikin Ashi candlesA simple modification of the Tradingview free script of futures Open Interest to Heikin Ashi candles. It displays the volume of the Open Interest futures contracts by applying the HA formula.
I use it to clear out the "noise" of up's and down's especially in intraday small time frames when I am scalping in crypto.
Background color can be turned on/off.
Just to give back a little something to a community that gave me A LOT!
Let me know what you think and if you need anything to add.
Have fun :)
P.S. The way I use it is to try to find traps in the market and take (fast) advantage of them. When the OI are going up really fast in small time frames (which means either longs or shorts are going up) this creates a good opportunity for a squeeze (the trap).
Of course I use other indicators/oscillators to determine that but it gets me on my toes to look for... something ;)
Close CandlesClosing candle takes any input and turs it into a candle stick chart. You can go from a regular candle chart by setting the length to 1, to heikin ashi by setting the length to 4. One of the features of this scripts is the ability to reuse the function. This function is a great addition to most scripts as it makes it really easy to give your script a candle view. As always I hope that you find this release useful. If you find any bugs please let me know. The same goes with any features you might want to request. This includes requesting custom indicators. Enjoy!
Turk Pivot Candle Order BlocksOrder Blocks based on pivot reversal candle
When a pivot High or Pivot Low is found and confirmed, a box will be plotted on the open and close values of that pivot candle
You also have the ability to change the amount of candles the box stretches over as well as the colors of the bullish and bearish boxes
How To Use:-
Pivot points often provide Support and Resistance points on their own,
one way of marking up order blocks is by taking the pivot candle and marking that up as a resistance area where you could be looking for price to reverse
Engulfing Candle Marker (Full Candle)A simple indicator that marks FULL CANDLE engulfing candles...
current high > previous high
current low < previous low
bullish: close > open (triangle below)
bearish: close < open (triangle above)
A lot of the engulfing indicators available are body only. I created a FULL CANDLE indicator because that's what I prefer using.
Can be useful for spotting both reversal and continuation price action. Always have a complete trading plan and backtest it for yourself, engulfing candles in themselves to not guarantee a profit.
You are more powerful than you know...keep expanding!