Shark_AlgoGram_IndicatorHello traders!
I have been developing Shark trading indicator over the last year. This algorithm indicator is based on a set of different strategies, each with its own weight (weighted strategy). The set of strategies that I currently use are 6:
MACD
Stochastic RSI
RSI
Supertrend
MA crossover
Donchin Channel
Moreover, this indicator includes STOP losses criteria and a taking profit strategy. this indicator must be optimized for the desired asset to achieves its full potential.
Best Time-Frame :
The 30 & 31 Minutes Time frame give good results. The algo has been tested for several asset (same dataframe, different optimization values).
When to Buy & Sell :
Buy Entry & Exit : Take entry when Green Arrow or Buy Trigger on screen & Exit when Purple Arrow or exit trigger on screen
Sell Exit & Exit : Take entry when Red Arrow or Sell Trigger on screen & Exit when Purple Arrow or exit trigger on screen
Important note:
Backtest the algorithm with different data stamps to avoid overfitting results
How it works:
The algorithm is based on a combination of well-documented indicators. First, the algorithm calculated the weight_strategy, which represents a value from 0 to 5 of the number of strategies that are fulfilled (in case the weight of each strategy is the same). To open a position, the value of weight_strategy must be greater than the value of weight_signal, by default 2. Modify the indicator parameters for the desired asset and data frame. Set stop-loss and take profit criteria.
Features:
* The algorithm allows to trade with long, short or both positions.
* Backtest the algorithm over a defined interval (data stamp), e.g., from 2022
* stop loss (SL) orders based on movement of the previous candle source, e.g., close or candle volatility. Only close the position after the candle is close!
* It can moves the stop loss when this indicator takes profit (TP) & Market true such condition where trailing SL Activate
* Take profit based on market movement and once 3 condition true out of 6 True they push exit order
* Define delays to evaluate the strategies of more previous candles:
+ Candle Delay is for MACD strategy
+ Candle delay Stoch RSI is for the Stochastic RSI strategy.
+ RSI Candle Delay is for the RSI strategy.
+ Candle delay Exit is the number of candles the algorithm waits to open a new position.
* Choose if you want to use the weighted strategy or just some of them.
* Choose the weight (relevance) of each strategy.
* Customize the well-documented MACD strategy.
* Customize the well-documented Stochastic RSI strategy.
* Customize the well-documented RSI strategy.
* Customize the well-documented Supertrend strategy.
* Customize the well documented MA cross strategy.
Disclaimer :
AlgoGram Script,Indicator,Strategy,Trading Idea & presentations are only for educational & Research purposes and are not intended as investment advice. I cannot guarantee the accuracy of any information provided above , please take trade with help of your Financial adviser or on your own risk
Cheers! & Best Of Luck
By AlgoGram
Search in scripts for "candle"

MomentumInvest TrendFollower [@TradersVenue]VSA CheatSheet - Have kept the chart clean and clear not by putting each signal pattern name. What matters is identifying the real price action than the pattern name. To keep the charts clutter free, haven't put the signal name under/above the candle.
Rejection or reversal patterns
Green Circle - Typical SellingClimax, Stopping Volume and Bag Holding signal patterns as per VSA. Strong price volume action but price rejection at lower level.
Red Circle - Typical Buying Climax, End Of Rising, Supply Overcoming Demand signal patterns as per VSA. Strong price volume action but price rejection at higher level.
Green Square - Typical bullish TrendReversal candle as per VSA. Bullish breakout bar immediately after a bearish breakout bar and engulfing the previous one or cover max part of it.
Red Square - Typical bearish TrendReversal candle as per VSA. Bearish breakout bar immediately after a bullish breakout bar and engulfing the previous one or cover max part of it.
Momentum breakout patterns
Blue/Green Star - Bullish breakouts. Downthrust bars with significant price volume action. Green if smaller low weak otherwise blue.
Red/Pink Star - Bearish breakouts. Downthrust bars with significant price volume action. Red if low higher weak else pink.
Candle Color
Green - Bullish with strong price action. Good to enter long towards close with SL of day low. System suggests quantity as per 2% trading rule. One can play with risk defined option strategies or cash segment as per quantity suggested.
Red - Bearish with strong price action. Good to enter short towards close with SL of day high. System suggests quantity as per 2% trading rule. One can play with risk defined option strategies like bear put spread or bear call spreads or go for hedged shorts.
Pink - Bearish with muted price action. Trail SL. Better to avoid trading these candles.
Light blue - Bullish with muted price action. Trail SL. Better to avoid trading these candles.
Plotted EMA Ribbon gives a sense of the strength of momentum. When each MA is placed with wide gaps momentum is strong. When there is EMA confluence, chances of trend strength are weakening. Background color of the chart green indicates bullishness in the underlying and red indicates that bearish pressure in the scrip. If the background color is green and you see one Blue/Green star candle it's good to go long. If the background color is red and you see one Red/Pink star candle it's good to go short.
A word of caution: Trading breakouts is very good. But you need to prepare for breakout failures. Here the system picks wide range bars for going long or short that means SL is wide probably 3% and above. Also if you notice after a strong PV breakout if price sustains below that it can see long unwinding pressure and simillary after a strong PV breakdown, if price sustains above the breakdown candle, chances of short covering is higher. Here money management and risk management becomes very important. Same has been included as part of the indicator to give you an optimal quantity for trade to keep the drawdowns lower. If you enable (1) RECO message and (2) Show Strategy (Else Study)? options then it shows a RECO box with quantity calculated as per 2% loss per trade rule. Lot of risk management, scale up/down for compounding is also available. You may try out those options one by one.
This indicator needs to be used along with the “VSA + Volume Oscillator ”, because this setup relies on VSA (Volume Spread Analysis). The overall usage will be provided through a demo to the subscribing users. In order to gain access to this indicator you may contact me using the below signature.

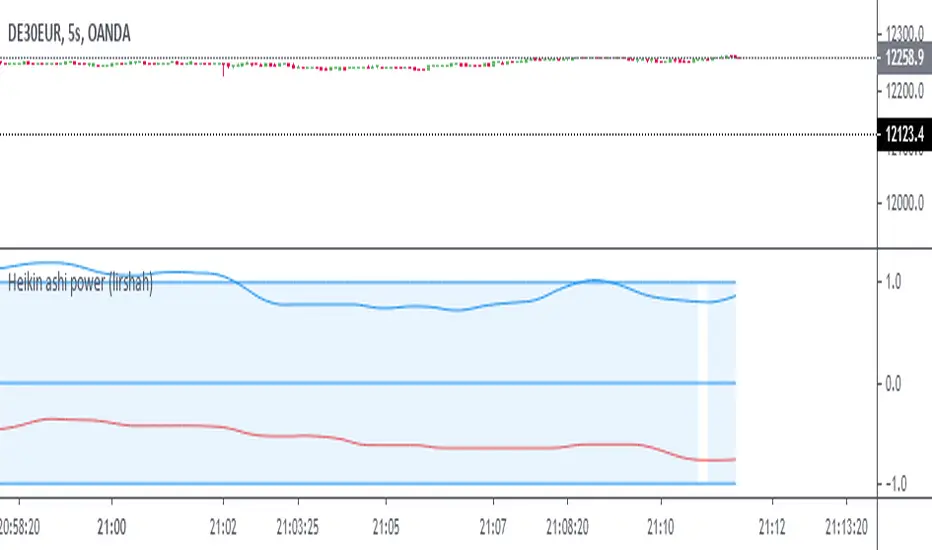
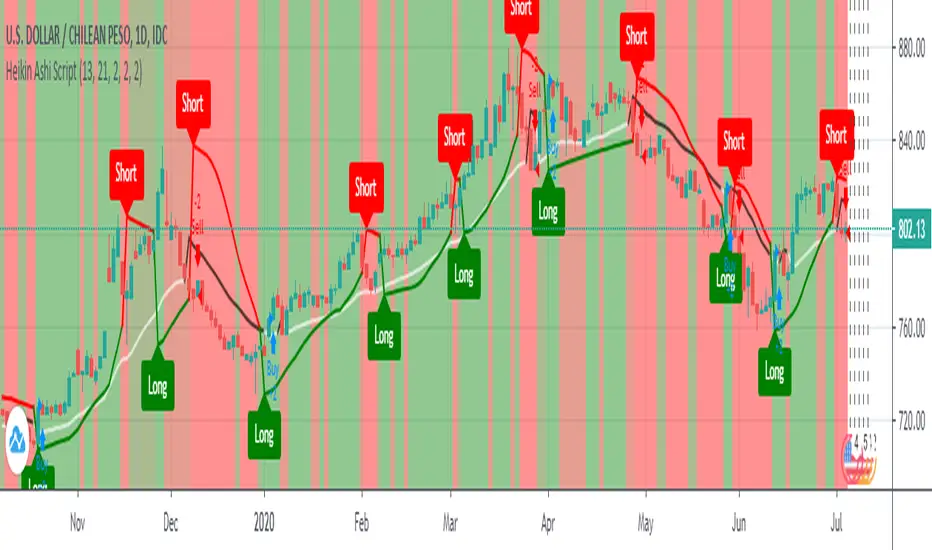
Heikin Ashi ScriptThis is a backtested Heikin-Ashi candles color change strategy.
You have to use this strategy on normal candles and not Heikin-Ashi!!!
Why normal candles? :- Because if you'll apply this strategy on Heikin Ashi candles then your backtesting won't be valid.
Here's how to use it.
Go LONG in case of ALL of the condition matches:-
1) When Buy arrow appeared under the last daily candle.
2) Candle background color should be green.
3) When the MA line changes the color from red to green.
Go SHORT in case of ALL of the condition matches:-
1) When Sell arrow appeared above the last daily candle.
2) Candle background color should be red.
3) When the MA line changes the color from green to red.
This strategy work in all the asset and all the timeframe.
Happy Trading!!!
Quantura - Quantitative AlgorythmIntroduction
“Quantura – Quantitative Algorithm” is an invite-only Pine Script strategy designed for multi-timeframe analysis, combining technical filters with user-adjustable fundamental sentiment. It was primarily developed for cryptocurrency markets but can also be applied across other assets such as Forex, stocks, and indices. The goal is to generate structured trade signals through a confluence of techniques rather than relying on a single indicator.
Originality & Value
Quantura is not a simple mashup of indicators. Its originality comes from how multiple layers of analysis are integrated into a single decision framework . Instead of showing indicators separately, the strategy only issues trades when several conditions align simultaneously:
RSI entry triggers confirm overbought/oversold reversals.
Market structure on a higher timeframe confirms trend direction.
Order block detection highlights zones of concentrated supply and demand.
Premium/Discount zones identify potential over- and undervaluation.
HTF EMA provides trend confirmation.
Optional candlestick patterns strengthen reversal or continuation signals.
An optional correlation filter compares the main asset to a reference instrument.
This design forces agreement between different methodologies (momentum, structure, value, volume, sentiment), which reduces noise compared to using them in isolation.
Functionality & Indicators
Entry trigger: RSI exits from extreme zones.
Filters: Only valid when all selected filters (HTF structure, EMA, order blocks, premium/discount, candlesticks, correlation, volume) confirm the direction.
Fundamental bias: User-defined sentiment and analysis settings (bullish, bearish, neutral) influence whether long or short trades are permitted.
Exits: ATR-based take profit and stop loss, with optional breakeven, opposite-signal exit, and session-end exit.
Visualization: Buy/Sell markers, trend-colored candles, and an optional dashboard summarizing indicator status.
Parameters & Customization
Timeframes: Independent HTF and LTF selection.
Trading direction: Long / Short / Both.
Session and weekday filters.
RSI length and thresholds.
Filters: HTF structure, order blocks, premium/discount, EMA, candlestick, ATR volatility, volume zones, correlation.
Exit rules: ATR multipliers for TP/SL, breakeven logic, session-end exit, opposite-signal exit.
Visuals: Toggle signals, candles, dashboard, custom colors.
Default Properties (Strategy Settings)
Initial Capital: 100,000 USD
Position Size: 15% of equity per trade
Commission: 0.25%
Slippage: enabled
Pyramiding: 0 (one position at a time)
Note: The position sizing of 15% equity per trade is intentionally set for backtesting demonstration. In real trading, risking this much is considered aggressive. Most traders prefer to risk 1-5% of equity, and rarely above 10%.
Backtesting & Performance
Backtests on BTCUSD (2 years) with the above defaults showed:
112 trades
Win rate: 40%
Profit factor: 1.4
Maximum drawdown: 34%
These results illustrate how the confluence model behaves, but they are not predictive of future performance . The trade sample size (72 trades) is below the 100+ usually recommended for statistical robustness. Users should re-test with their own preferred symbols, settings, and timeframes.
Risk Management
ATR-based stops and targets scale with volatility.
Commission and slippage are included by default for realistic modeling.
Opposite-signal exit helps capture trend reversals.
Session-end exit can close intraday positions before illiquid hours.
Breakeven option protects profits when available.
Although the default allocation uses 15% per trade for demonstration, this is not a recommendation. Users are encouraged to adjust risk sizing downwards to sustainable levels (commonly 1-5%).
Limitations & Market Conditions
Performs best in volatile, liquid markets (e.g., crypto).
May struggle in prolonged sideways markets with low volatility.
News events and fundamentals outside user inputs can override signals.
Backtests below 100 trades should be considered exploratory, not statistically conclusive.
Usage Guide
Add “Quantura – Quantitative Algorithm” to your chart in strategy mode.
Select HTF and LTF timeframes, trading direction, and session filters.
Configure confluence filters (structure, EMA, order blocks, premium/discount, candlestick, correlation, volume).
Set sentiment and analysis bias in fundamental settings.
Adjust ATR multipliers and exits.
Review buy/sell signals and analyze performance in the Strategy Tester.
Author & Access
Developed 100% by Quantura . Distributed as an Invite-Only script . Details are provided in the Author’s Instructions field.
Important: This description complies with TradingView’s Script Publishing Rules and House Rules. It does not guarantee profitability, avoids unrealistic claims, and explains how the strategy integrates multiple methods into a coherent decision framework.

Multi Channel GRID & DCA LTF [trade_lexx]Multi Channel GRID & DCA LTF
Usage Guide
Part 1: The concept and general possibilities of the "Multi Channel GRID & DCA LTF" strategy
Introduction
Welcome to the guide to "Multi Channel GRID & DCA LTF", a powerful and versatile automated trading strategy for the TradingView platform. This tool was developed for traders who are looking for flexibility, control and a high degree of adaptability to various market conditions.
The strategy is based on a hybrid approach that combines two popular and time-tested techniques.:
1. GRID (grid trading): The classic method of averaging a position is by placing a grid of limit orders.
2. DCA (Dollar Cost averaging): Smart position averaging based on signals from external indicators.
However, "Multi Channel GRID & DCA LTF" goes far beyond the simple combination of these two techniques. The strategy includes a number of unique and innovative features, such as cascading MultiGRID grids for dealing with extreme volatility, Channel Mode range trading mode for profiting from sideways movement, and Low Time Frame analysis (LTF) to achieve surgical accuracy in backtesting. Deep customization options for risk management, capital, take profits, and stop losses allow you to configure a strategy for almost any trading style, asset, and timeframe.
The basic idea: How does it work?
Let's take a detailed look at each of the key concepts embedded in the logic of the strategy.
1. GRID — Automatic placement of buy and sell orders at certain price intervals.
This is a fundamental mode of operation. Its main goal is to systematically improve the average entry price for a position if the market is going against you.
* The principle of operation: After opening the base (first) order (`BO`), the strategy automatically places a series of pending limit orders (here they are called "safety orders" or "SO") at certain price intervals. For a long position, orders are placed below the entry price, and for a short position, orders are placed higher.
* Target: When the price moves against an open position, it consistently hits and executes safety orders. Each such execution adds additional volume to the position at a more favorable price, thereby shifting the overall average entry price (`position_avg_price') closer to the current market price. This means that a much smaller corrective movement will be required to gain ground.
* Flexibility: You have full control over the geometry of the grid: the number of safety orders, the percentage distance between them (`SO Step`), and you can even set a coefficient that will increase this step for each subsequent order (`SO Multiplier`), creating an expanding grid.
2. DCA (Signal Averaging) — Smart Averaging
This mode adds an additional layer of analysis to the averaging process. Instead of just buying/selling at the set price levels, the strategy waits for a confirmation signal.
* Working principle: You can connect any external indicator (for example, RSI, CCI, or even your own complex signal system) to the strategy, which outputs numerical values. As standard, 1 is used for a long signal, and -1 is used for a short signal. The strategy will place the next averaging order only at the moment when it receives the appropriate signal.
* Goal: To average a position not just during a fall (or a rise for a short), but at the moments that your main trading system considers the most favorable for this. This allows you to avoid "catching falling knives" and enter only if there are good reasons.
3. Hybrid Mode (GRID+DCA) is the best of the previous two modes
This mode is designed for maximum filtering and control. It requires two conditions to be fulfilled simultaneously.
* Working principle: The safety order will be executed only if the price has reached the calculated grid level and a confirmation signal has been received from your external indicator. If a confirmation signal is received from an external indicator, the next calculated grid level activates the limit order.
* Goal: To create the most reliable averaging system that protects against premature entries and requires double confirmation (both by price and indicator) before increasing the position size.
4. MultiGRID — Adaptation to extreme volatility
This is one of the most powerful and unique features of a strategy designed to survive and make a profit in the face of strong, protracted trends or "black swans".
* The problem it solves: The usual grid of orders has a limited depth. If the price goes beyond the last safety order, the strategy loses the opportunity to average and becomes vulnerable.
* The principle of operation: The MultiGRID function allows you to create "cascades" — several grids following one another. When all the orders of the first grid are executed, the strategy does not stop. Instead, she can activate the second, third (and so on) a grid of orders. The new grid can be activated by one of two triggers:
1. Offset: The new grid is activated when the price passes another set percentage deviation from the last executed order.
2. Signal: The new grid is activated when a signal is received from an external indicator.
* Goal: To significantly expand the working range of the strategy. This allows it to adapt to strong market movements that would "break" the usual grid, and continue to effectively average a position at a much greater depth of decline or growth.
5. Channel Mode — Trading in the range
This feature turns a standard averaging strategy into a machine for "farming" profits within a price channel that is formed during a sideways market movement.
* The problem it solves: In the standard grid strategy, after partially closing a take profit position, the volume of this part "leaves" the trade until the deal is fully closed. You are missing the opportunity to reuse this capital.
* Operating principle: When Channel Mode is enabled, the following happens. Suppose the price went against you, executed several safety orders, and then turned around and reached one of the partial take profits. At this point, the strategy is:
1. Fixes the profit, as it should be.
2. Instantly places a new limit order to buy (or sell for a short) at exactly the same price level where the last triggered safety order was executed. The volume of this order is equal to the volume of the part that was just closed for take profit.
3. If the price goes down again and executes this "repeat" order, the strategy immediately sets a corresponding take profit for it at the level where the previous profit was taken.
* Goal: To create a continuous buy-sell cycle within the local range (channel). The lower limit of the channel is the price of the last averaging, and the upper limit is the price of a partial take profit. This allows you to repeatedly profit from sideways price fluctuations, without waiting for the full closure of the main, large transaction.
6. LTF (Lower Timeframe Analysis) — Surgical precision of backtesting
This feature is critically important for obtaining reliable results during historical testing (backtesting) of grid strategies.
* The problem it solves: The standard testing mechanism in TradingView has a serious limitation. Working, for example, on a 4-hour chart, he sees only 4 candle points: Open, High, Low and Close. He does not know in what order the price moved within these 4 hours. He could have touched High first and then Low, or vice versa. For grid strategies, this is fatal — the engine can show that a take profit has been executed, although in reality the price first went down, collected the entire grid of orders and only then turned around.
* How it works: When you turn on the LTF mode, the strategy for each candle on your main chart (for example, 4H) requests and analyzes all candles from the lower timeframe you specified (for example, 1-minute). Then it virtually trades the entire price path for these minute candles, executing orders, take profits and stop losses in the sequence in which they would occur in reality. It works in the single take profit mode of the Grid strategy.
* Goal: To provide the most realistic and reliable backtest that reflects the real dynamics of the market. This allows you to avoid false expectations and accurately assess the potential performance of the strategy.
// ------------------------
Part 2: Detailed description of the strategy settings
This section is your main guide to all the switches and options available in the strategy. Understanding each setting is the key to unlocking the full potential of this powerful tool.
1. 🛡️ Risk Management 🛡️
This group contains fundamental parameters that determine the basic logic of risk management and the geometry of grid orders.
* Strategy type: Determines the direction of transactions.
* Long: The strategy will only open long positions (buy).
* Short: The strategy will only open short positions (sell).
* Both: The strategy will work both ways, opening long or short depending on the incoming signal.
* SO Count: Sets the maximum number of Safety (averaging) Orders (SO) that the strategy will place within the same grid. If you have MultiGRID enabled, this number applies to each individual grid.
* SO Step (%): This is the base percentage deviation from the entry price at which the first safety order will be placed. For example, at a value of 0.5, the first SO in a long trade will be placed 0.5% lower than the opening price of the base order.
* SO Multiplier: A coefficient that exponentially increases the step for each subsequent safety order. This allows you to create an expanding grid where averaging orders are placed further and further apart, which is effective with strong and accelerating price movements.
* *The step formula for the nth order*: Step(N) = (SO Step) * (SO Multiplier ^(N-1)).
* If the value is 1, all steps will be the same.
* With a value of 1.6, the step of the second SO will be 1.6 times larger than the first, the step of the third will be 1.6 times larger than the second, and so on.
* 1️⃣ TP/SL: These are simplified settings for quick configuration. They allow you to turn on/off the main take profit and stop loss and set basic percentage values for them. More detailed settings for these parameters can be found in the relevant sections below.
// ------------------------
2. 💰 Money Management 💰
Everything related to position size, leverage, and capital is configured here.
* Volume BO (Base Order): Determines the size of the trade's opening order.
* Volume BO: A fixed amount in the quote currency (for example, in USDT).
* USDT (check mark): Manages the information in the comments to the orders. If enabled, the volume of orders in USDT will be displayed in the comments. This is convenient for visual analysis and for sending the amount of USDT by the placeholder {{strategy.order.comment}} via webhooks when connecting the strategy to the exchange or trading terminals.
* or % of deposit: The amount calculated as a percentage of the available capital of the strategy. The check mark to the right of this field enables this mode. Important: using a percentage activates the effect of compounding (compound interest), as the amount of each new transaction will be automatically recalculated based on the current capital (initial capital + profit/loss). If enabled, the percentage of orders will be displayed in the comments. This is convenient for visual analysis and for sending percentages on the placeholder {{strategy.order.comment}} via webhooks when connecting the strategy to the stock exchange, trading terminals, or creating Copy trading.
* Martingale: The coefficient applied to the volume of orders. It increases the size of each subsequent insurance order compared to the base one.
* Volume formula for the nth SO: Volume SO (N) = (Volume BO) * (Martingale^N).
* With a value of 1.2, the volume of the first SO will be 1.2 times greater than the base, the second — 1.44 times (`1.2 * 1.2`) and so on.
* Leverage: Specify the size of your leverage. This parameter is used exclusively for calculating and displaying the approximate liquidation price. It does not affect the size of positions, but it helps to visually assess the risks.
* Liquidation: Enables or disables the calculation and display of the liquidation line on the chart.
* Margin type: Allows you to select a method for calculating the liquidation price, simulating the logic of exchanges:
* Isolated: The liquidation price is calculated based on the size and leverage of the current open position only.
* Cross: The calculation simulates using the entire available balance to maintain a position. In the strategy, the liquidation price is calculated as the level at which the loss on the current transaction is equal to the current capital.
* Commission (%): Specify the percentage of your exchange's commission per transaction. The correct value of this parameter is crucial for obtaining realistic backtest results.
// ------------------------
3. 🕸️ Grid Management 🕸️
This group is responsible for the logic of safety orders and advanced mechanics such as Channel Mode and MultiGRID.
* SO Type: Defines the logic of placing averaging orders.
* GRID: Classic grid. All safety orders are placed in advance as limit orders.
* DCA: Signal averaging. The strategy is waiting for a signal from an external indicator to place a market averaging order.
* GRID+DCA: Hybrid. The strategy waits for a signal, and if it arrives, places a limit order at the appropriate price level of the grid or executes a market order if the signal has arrived below the limit order level.
* Signal for SO: A data source (indicator) that will be used for signals in DCA and GRID+DCA modes.
* ↔️ Channel Mode: When this option is enabled, the strategy tries to trade in a sideways range. After partially closing a take profit position, it immediately places a limit order for re-entry at the price of the last triggered safety order. This creates a buy-sell cycle within the local channel.
* Best Price Only: This filter adds an additional condition for averaging in DCA and MultiGRID modes (when it operates on a signal). The next averaging order or a new grid will be activated only if the current price is more favorable (lower for long, higher for short) than the price of the previous entry.
* 🧩 MultiGRID ⮕ Enables cascading grid mode.
* Grid Count: The total number of grids that can be activated sequentially.
* Offset: Percentage deviation from the price of the last order of the previous grid. When this margin is reached, the following grid of orders is activated (this mode does not require a signal).
* Or signal: Allows you to use the signal from an external indicator as a trigger to activate the next grid. The checkmark on the right turns on this mode.
// ------------------------
4. 🎯 Entry and Stop 🎯
This group of settings allows you to fine-tune the conditions for starting a new trade and all aspects related to protective stop orders, including the complex mechanics of trailing and managing SL after partial take profits.
* 🎯 Signal: A data source (indicator) that will be used to determine when to enter a trade. The strategy expects a value of 1 for the start of a long trade and -1 for a short trade.
* Min Bars: Sets the minimum number of candles that must pass from the moment of opening the previous trade to the moment of opening the next one. A value of 0 disables this filter. This is a useful tool to prevent overly frequent entries in a "noisy" market.
* Non-stop: If this option is enabled, the strategy ignores the Entry Signal and opens a new trade immediately after closing the previous one (taking into account the Min Bars filter, if it is set). This turns the strategy into a constantly working mechanism that is always on the market.
* 🛑 SL Type: Defines the base price from which the stop loss percentage will be calculated. The stop loss in the first section must be enabled for this block of settings to work.
* From the entry point: SL is always calculated from the opening price of the very first base order. It remains static throughout the entire transaction unless it is moved by other functions.
* From breakeven line: SL is dynamically recalculated and shifted each time a safety order is executed. It always follows the average price of the position, being at a given percentage distance from it.
* From last executed SO: SL is recalculated from the price of the last executed order, whether it is a base or a safety order.
* From last SO: SL is calculated from the price of the most recent possible safety order in the grid. This is usually the most remote and conservative type of SL.
* Trailing SL Type: Defines the algorithm by which the stop loss will move after its activation.
* Standard: Classic trailing. After activation, SL will follow the price at a fixed distance.
* ATR: SL will follow the price at a distance equal to the value of the ATR indicator multiplied by the specified multiplier.
* External Source: SL will follow any selected line of the third-party indicator.
* Period and Multiplier: Common parameters for all types of trailing.
* Source: The source of the line for the trailing SL of the third-party indicator.
* Trailing SL after entry: The mode of activation of the trailing SL after entering the transaction
* SL management after TP (sections 1️⃣, 2️⃣, 3️⃣): These three blocks allow you to create a complex stop loss management logic as profits are recorded.
For each take profit level (TP1, TP2, TP3), you can configure:
* SL BE / SL TP1 / SL TP2: When the corresponding TP is reached, the stop loss will be moved to the breakeven point (for TP1), to the TP1 price level (for TP2) or to the TP2 price level (for TP3).
* Trailing SL: When the corresponding TP is reached, the trailing stop loss is activated according to the settings above.
* By ↔️ Signal: A very powerful option. If it is enabled, the above action (SL transfer or trailing activation) will occur when the opposite trading signal is received from an external indicator. This allows you to protect profits or reduce losses if the market turns sharply, even before reaching the target.
* SL Delay ⮕ Allows you to delay the activation of the stop loss.
* Number of Bars: The Stop loss will be physically placed on the market only after the specified number of candles has passed since entering the trade. This can help to avoid "taking out" the stop with a random short movement (squiz) immediately after opening a position.
* SL Block: Unique defensive mechanics for trading both ways (`Strategy Type: Both`).
* Number of SL: If the strategy receives the specified number of stop losses in a row in one direction (for example, 2 stops long), it temporarily blocks the opportunity to open new trades in that direction.
* Lock Reset mode:
* By direction: The lock is lifted if a profitable trade is closed in the allowed direction or if a stop loss is triggered in the opposite direction.
* First profit: The lock is lifted after closing any profitable transaction, regardless of its direction.
// ------------------------
5. ✅ Take Profit ✅
This group of settings provides comprehensive control over profit taking, from a simple take profit to a complex system of partial closures and trailing.
* ✅ TP Type: Defines the base price for calculating the percentage deviation of the take profit.
* From entry point: TP is calculated from the base order price.
* From breakeven line: TP dynamically follows the average position price.
* From last executed SO: TP is calculated from the price of the last executed order.
* Filters for closing on signal
* Only ➕: If TP is triggered by a signal, the deal will be closed only if it is in the black relative to the average price.
* Or >TP: If TP is triggered by a signal, the trade will be closed only if the closing price is better than (or equal to) the estimated price of this TP.
* TP type of trailing: Yes, take profit has a trailing too! It works differently than the SL trailing.
* Standard / ATR: After the price touches the "virtual" TP level, the trailing is activated. He does not place a stop order, but begins to move away from the price, dynamically moving the limit order to close further and further in the profitable direction, allowing him to collect the maximum from the impulse movement.
* External Source: TP will follow any selected line of the third-party indicator.
* Period and Multiplier: Parameters for calculating the trailing margin TP.
* Source: The source of the line for the trailing TP of the third-party indicator.
* TP level settings (sections 1️⃣, 2️⃣, 3️⃣, 4️⃣): The strategy supports up to four independent take profit levels, which allows for a flexible system of partial commits.
For each level, you can set:
* TP: Enable the level and set its percentage deviation from the base price.
* Size: What percentage of the current position will be closed when this level is reached. For the last active TP, this parameter is ignored, and 100% of the remaining position is closed.
* Trailing TP: Enable the above-described trailing mechanism for this particular level.
* Signal: Enable closing based on the signal from the external indicator for this level.
* Or take: If both the closing on the signal and the limit order are enabled, then whatever comes first will work.
* After SO: Activate this TP level only after the specified number of safety orders has been executed. This allows you to set closer targets for riskier (deeply averaged) positions.
// ------------------------
6. 🔬 GRID and MultiGrid Analysis on Lower TFs (LTF) 🔬
This group activates one of the most important functions for accurate testing of grid strategies.
* Enable LTF Calculation ⮕ The main switch of the analysis mode on the lower timeframes.
* Timeframe selection: A drop-down list where you can select a timeframe for detailed analysis. For example, if your main schedule is 1 hour, you can select 1 minute here. The strategy will emulate the trading of minute candles within each hour candle.
❗️Important: As mentioned in the first part, the use of this mode is critically necessary to obtain realistic backtest results, especially for strategies with a dense grid of orders. Without it, the results may be overly optimistic and not reflect the real dynamics of the market. It should be remembered that TradingView imposes a limit on the number of intra-bars (minor TF bars) that can be requested. This is usually about 100,000 bars.
// ------------------------
7. 🕘 Backtest Date Range 🕘
This group allows you to focus testing on a specific historical period.
* Limit Date Range: Enables date filtering.
* Start time: The date and time when the strategy will start analyzing and opening deals.
* End time: The date and time after which the strategy will stop opening new deals and complete testing.
// ------------------------
8. 🎨 Visualization 🎨
All the options responsible for the appearance and information content of the chart are collected here.
* Show PnL labels: Enables/disables the display of text labels with the result (profit/loss) after closing each trade.
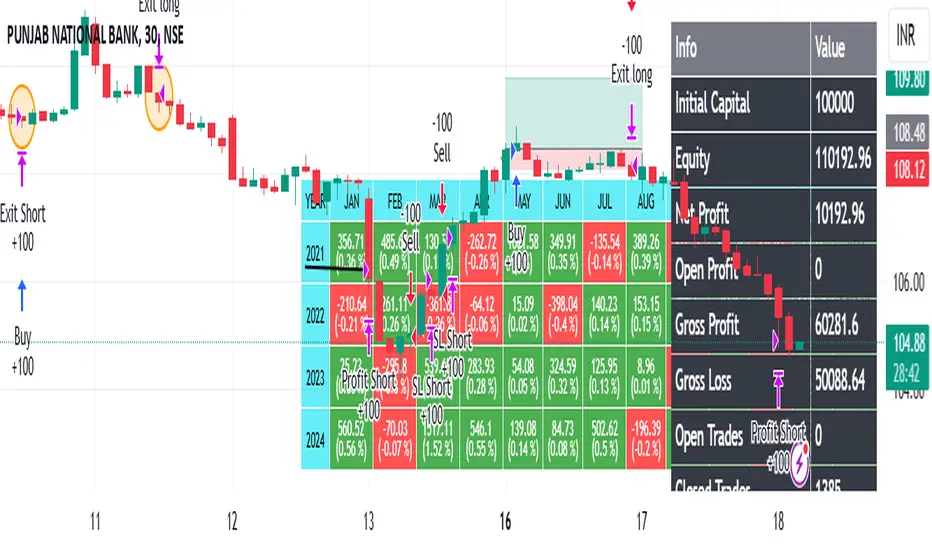
* Statistics Table: Enables/disables the main dashboard with detailed statistics on the results of the backtest.
* Strategy Settings Table: Enables/disables an additional panel that summarizes all the key parameters of the current configuration.
* Monthly Profit Table: Enables/disables a table with a breakdown of percentage returns by month and year.
* Table settings: For each of the three tables, you can individually adjust the Text size and Table Position on the screen to position them as conveniently as possible.
* Decimal places: Defines how many decimal places will be displayed in numeric values in tables and on labels.
// ------------------------
9. ✉️ Webhook Settings ✉️
This group is intended for traders who want to automate trading on strategy signals using third-party services and exchanges (for example, 3Commas, WunderTrading, Cryptorobotics, Cryptohopper, Bitsgap, Binance, ByBit, OKX, Pionex, Bitget or proprietary solutions).
For each key event in the strategy, there is a separate switch and a text field:
* Webhook for Open: Enable and set a message for the webhook that will be sent when the base order is opened.
* Webhook for Averaging: A message sent when executing any insurance order.
* Webhook for Take Profit: A message sent when closing on take profit (including partial ones).
* Webhook for Stop-Loss: A message sent when a stop loss is closed.
You can insert a JSON code or any other message format that your service requires for automation into the text fields. The strategy supports special placeholders (for example, `{{strategy.order.alert_message}}`), which allow you to dynamically insert the necessary data into the message, such as the amount of USDT or the percentage of the deposit for entry, averaging and take profit orders.

Heiken Ashi Supertrend ADX - StrategyHeiken Ashi Supertrend ADX Strategy
Overview
This strategy combines the power of Heiken Ashi candles, Supertrend indicator, and ADX filter to identify strong trend movements across multiple timeframes. Designed primarily for the cryptocurrency market but adaptable to any tradable asset, this system focuses on capturing momentum in established trends while employing a sophisticated triple-layer stop loss mechanism to protect capital and secure profits.
Strategy Mechanics
Entry Signals
The strategy uses a unique blend of technical signals to identify high-probability trade entries:
Heiken Ashi Candles: Looks specifically for Heiken Ashi candles with minimal or no wicks, which signal strong momentum and trend continuation. These "full-bodied" candles represent periods where price moved decisively in one direction with minimal retracement.
Supertrend Filter : Confirms the underlying trend direction using the Supertrend indicator (default factor: 3.0, ATR period: 10). Entries are aligned with the prevailing Supertrend direction.
ADX Filter (Optional) : Can be enabled to focus only on stronger trending conditions, filtering out choppy or ranging markets. When enabled, trades only trigger when ADX is above the specified threshold (default: 25).
Exit Signals
Positions are closed when either:
An opposing signal appears (Heiken Ashi candle with no wick in the opposite direction)
Any of the three stop loss mechanisms are triggered
Triple-Layer Stop Loss System
The strategy employs a sophisticated three-tier stop loss approach:
ATR Trailing Stop: Adapts to market volatility and locks in profits as the trend extends. This stop moves in the direction of the trade, capturing profit without exiting too early during normal price fluctuations.
Swing Point Stop : Uses natural market structure (recent highs/lows over a lookback period) to place stops at logical support/resistance levels, honoring the market's own rhythm.
Insurance Stop: A percentage-based safety net that protects against sudden adverse moves immediately after entry. This is particularly valuable when the swing point stop might be positioned too far from entry, providing immediate capital protection.
Optimization Features
Customizable Filters: All components (Supertrend, ADX) can be enabled/disabled to adapt to different market conditions
Adjustable Parameters: Fine-tune ATR periods, Supertrend factors, and ADX thresholds
Flexible Stop Loss Settings: Each of the three stop loss mechanisms can be individually enabled/disabled with customizable parameters
Best Practices for Implementation
Recommended Timeframes: Works best on 4-hour charts and above, where trends develop more reliably
Market Conditions: Performs well across various market conditions due to the ADX filter's ability to identify meaningful trends
Position Sizing: The strategy uses a percentage of equity approach (default: 3%) for position sizing
Performance Characteristics
When properly optimized, this strategy has demonstrated profit factors exceeding 3 in backtesting. The approach typically produces generous winners while limiting losses through its multi-layered stop loss system. The ATR trailing stop is particularly effective at capturing extended trends, while the insurance stop provides immediate protection against adverse moves.
The visual components on the chart make it easy to follow the strategy's logic, with position status, entry prices, and current stop levels clearly displayed.
This strategy represents a complete trading system with clearly defined entry and exit rules, adaptive stop loss mechanisms, and built-in risk management through position sizing.

ThePawnAlgoPROThe Pawn algo PRO is an automated strategy that is useful to trade retracements and expansions using any higher timeframe reference.
Why is useful?
This algorithm is helpful to trade with the higher timeframe Bias and to see the HTF manipulations of the highs or lows once the candle open, usually in a normal buy candle will be a manipulation lower to end up higher. In a normal sell candle will be a manipulation higher to close lower. Once the potential direction of the Higher time frame candle is clear the algo will just enter on a trade on the lower timeframe aligned with the higher timeframe trend.
You can select any HTF you want from 1-365Days, 1-12Months or 1-52W ranges. Making this algorithm very flexible to adapt to any trader specialized timeframe.
How it works and how it does it?
It works with a simple but powerful pattern a close above previous candle high means higher prices and a close below previous candle low means lower prices, Close inside previous candle range means price is going to consolidate do some kind of retracement or reversal. The algo plots the candles with different colors to identify each of these states. And it does this in the HTF range plot.
This algo is similar to the previously released Pawn algo with the additional features that is an automated strategy that can take trade using desired risk reward and different entry types and trade management options. When the simple pattern is detected.
Also this version allows to plot the current developing HTF levels meaning the high, low and the 50%, plus the first created FVG(fair value gap introduced by ICT) in the range allowing to easily track any change in the potential direction of the HTF candle.
How to use it?
First select a higher timeframe reference and then select a lower timeframe, to visualize it better is recommended that the LTF is at least 10 times lower. Default HTF is 1 Week and LTF is 60min for trading the weekly expansions intraday.
Then we configure the HTF visualization it can be configure to show different HTF levels the premium/discount, wicks midpoints, previous levels, actual developing range or both. The Shade of the HTF range can be the body or the whole HTF range.
After that we configure the automated entries we can chose between buys only ,sell only entries or both and minimum risk reward to take a trade. Default value is 1.8RR and both entries selected. We can choose the maximum Risk Reward to avoid unrealistic targets default is 10RR. The maximum trades per HTF candle is also possible to select around this section.
Then we got the option to select which type of trade you want to take a trade around the open, the 50% or 75-80% or around the previous High for shorts or Low for longs. And off course the breakout entry that is for taking expansions outside previous HTF range. The picture below showcase an option using only entries on previous candles High or lows and 1Day as a HTF. You can also see the actual and previous HTF levels plotted.
Is important to take into account that these default settings are optimized for the MNQ! the 1W and 1H timeframes, but traders can adjust these settings to their desire timeframes or market and find a profitable configuration adjusting the parameters as they prefer. Initial balance, order size and commissions might be needed to be configured properly depending of the market. The algo provides a dashboard that make it easy to find a profitable configuration. It specifies the total trades, ARR that is an approximate value of the accumulative risk reward assuming all loses are 1R. The profit factor(PF) and percent profitable trades(PP) values are also available plus consecutives take profits and consecutives loses experimented in the simulation.
Finally there is an option to allow the algo to just trade following the direction of the trend if you just want to use it for sentiment or potential trend detection, this will place a trade in the most probable direction using the HTF reference levels, first FVG and LTF price action.
In the picture below you can see it in action in the 1min chart using 1H as HTF. When its trending works pretty well but when is consolidating is better to avoid using this option. Configuration below uses a time filter with the macro times specified by ICT that is also an available filter for taking trades. And the risk reward is set to minimum 2RR.
The cyan dotted line is the stop loss and the blue one above is the take profit level. The algo allows for different ways to exit in this case is using exit on a reversal, but can also be when the take profit is hit, or in a retracement. For the stop loss we can chose to exit on a close, reversal or when price hit the level.
Strategy Results
The results are obtained using 2000usd in the MNQ! 1 contract per trade. Commission are set to 2USD,slippage to 1tick,
The backtesting range is from April 19 2021 to the present date that is march 2025 for a total of 180 trades, this Strategy default settings are designed to take trades on retracements only, in any of the available options meaning around 50% to the extreme HTF high or low following the HTF trend, but can only take 2 trades per HTF candle and the risk reward must be minimum 1.8RR and maximum 8RR. Break even is set when price reaches 2RR and the exit on profit is on a reversal, and for loses when the stop is hit. The HTF range is 1 Week and LTF is 1H. The strategy give decent results, makes around 2 times the money is lost with around 30% profitable. It experiments drawdown when the market makes quick market structure shifts or consolidates for long periods of time. So should be used with caution, remember entries constitute only a small component of a complete winning strategy. Other factors like risk management, position-sizing, trading frequency, trading fees, and many others must also be properly managed to achieve profitability. Past performance doesn’t guarantee future results.
Summary of features
-Take advantage of market fractality select HTF from 1-365Days, 1-12Months or 1-52W ranges
-Easily identify manipulations in the LTF using any HTF key levels, from previous or actual HTF range
-LTF Candles and shaded HTF boxes change color depending of previous candle close and price action
-Plot the first presented FVG of the selected HTF range plus 50% developing range of the HTF
-Configurable automated trades for retracements into the previous close, around 50%,75-80% or using the HTF high or low
-Option to enable automated breakout entries for expansions of the HTF range
-Trend follower algo that automatically place a trade where is likely to expand.
-Time filter to allow only entries around the times you trade or the macro times.
-Risk Reward filter to take the automated trades with visible stop and take profit levels
- Customizable trade management take profit, stop, breakeven level with standard deviations
-Option to exit on a close, retracement or reversal after hitting the take profit level
-Option to exit on a close or reversal after hitting stop loss
-Dashboard with instant statistics about the strategy current settings

ROBO STB GainCraft strategyPure Price Action Candlestick Strategy by ROBO STB
Overview
This strategy is built entirely on the principles of price action and candlestick analysis, designed for traders who prefer raw market data over traditional indicators. By focusing solely on candlestick patterns and their context within recent price movements, the strategy identifies high-probability entry and exit points in liquid markets.
Entry signals are generated based on these patterns appearing at significant market locations, such as after consolidations, pullbacks, or at key support/resistance levels.
Price Action Integration:
Instead of relying on oscillators or moving averages, the script leverages the inherent market structure provided by candlesticks to interpret potential trend reversals or continuations.
This approach provides a clearer view of market sentiment.
No External Indicators:
This script avoids the use of traditional indicators like RSI, MACD, or Bollinger Bands, offering a clean, uncluttered chart.
Risk Management (Optional):
Fixed-percentage risk management options can also be enabled, ensuring trades remain within acceptable risk parameters.
How the Strategy Works
Entry Conditions:
Buy Entry: A bullish candlestick pattern (e.g., bullish engulfing) forms after a period of consolidation or pullback, indicating potential upward momentum.
Sell Entry: A bearish candlestick pattern (e.g., bearish engulfing) suggests a downturn is likely.
Exit Conditions:
Exits are triggered by the appearance of reversal candlestick patterns or through predefined SL/TP levels.
The strategy adapts to varying market conditions by analyzing candlestick structures dynamically.
Ideal Use Cases
Short-Term Trading: Designed for day traders and scalpers targeting quick moves on shorter timeframes.
Highly Liquid Markets: Performs best in markets with high liquidity, such as Nifty, Bank Nifty, or major forex pairs, where candlestick patterns provide reliable signals.
30-Minute Timeframe: For optimal results, the strategy is recommended for use on a 30-minute timeframe.
Transparency and Realism
Backtesting Parameters:
The default backtesting settings simulate realistic trading conditions, including commissions and slippage, ensuring that results are not misleading.
Trade sizes are calibrated to risk sustainable amounts (.05% maximum equity per trade).
Dataset Selection:
This strategy has been tested on diverse datasets to produce a statistically significant number of trades, ensuring robust performance evaluation.
Why This Strategy is Unique
This script stands apart by offering a refined approach to price action trading. Unlike generic indicator mashups, it provides traders with an actionable, candlestick-focused methodology tailored for volatile, high-liquidity markets.
The strategy is both simple to understand and powerful in execution, making it an excellent tool for traders who want to develop their skills in raw price action analysis while maintaining strict risk management.
Key Features
Candlestick-Based Entry and Exit Signals:
1. Risk Management:
- Risk-to-Reward Ratio (RTR):
Set a customizable risk-to-reward ratio to calculate target prices based on stop-loss levels.
Default: 3:1
order size added -100
2. Opening Range Identification
- Opening Range High and Low:
The script detects the high and low of the first trading session using Pine Script's session functions.
These levels are plotted as visual guides on the chart:
- High: Lime-colored circles.
- Low: Red-colored circles.
3. Trade Entry Logic
- Long Entry:
A long trade is triggered when the price closes above the opening range high.
- Entry condition: Crossover of the price above the opening range high.
-Short Entry:
A short trade is triggered when the price closes below the opening range low.
- Entry condition: Crossunder of the price below the opening range low.
Both entries are conditional on the absence of an existing position.
4. Stop Loss and Take Profit
- Long Position:
- Stop Loss: Previous candle's low.
- Take Profit: Calculated based on the RTR.
- **Short Position:**
- **Stop Loss:** Previous candle's high.
- **Take Profit:** Calculated based on the RTR.
The strategy plots these levels for visual reference:
- Stop Loss: Red dashed lines.
- Take Profit: Green dashed lines.
5. Visual Enhancements
-Trade Level Highlighting:
The script dynamically shades the areas between the entry price and SL/TP levels:
- Red shading for the stop-loss region.
- Green shading for the take-profit region.
How to Use:
1.Input Configuration:
Adjust the Risk-to-Reward ratio, max trades per day, and session end time to suit your trading preferences.
2.Visual Cues:
Use the opening range high/low lines and shading to identify potential breakout opportunities.
3.Execution:
The strategy will automatically enter and exit trades based on the conditions. Review the plotted SL and TP levels to monitor the risk-reward setup.
Important Notes:
- This strategy is designed for intraday trading and works best in markets with high volatility during the opening session.
- Backtest the strategy on your preferred market and timeframe to ensure compatibility.
- Proper risk management and position sizing are essential when using this strategy in live markets.
Please let me know if you have any doubts.
NUTJP CDC ActionZone 20241. Core Components of the Strategy
• Fast EMA and Slow EMA:
• The Fast EMA (shorter period) is more reactive to recent price changes.
• The Slow EMA (longer period) reacts slower and provides a smoother view of the overall trend.
• Relationship Between Fast EMA and Slow EMA:
• When the Fast EMA is above the Slow EMA, the market is considered Bullish.
• When the Fast EMA is below the Slow EMA, the market is considered Bearish.
2. Zones Based on Price and EMAs
The strategy defines six zones based on the position of the price, Fast EMA, and Slow EMA:
1. Green Zone (Buy):
• Bullish trend (Fast EMA > Slow EMA)
• Price is above the Fast EMA.
• Indicates a strong uptrend and suggests buying.
2. Blue and Light Blue Zones (Pre-Buy):
• Price is above the Fast EMA but below or near the Slow EMA.
• Represents potential bullish signals but not strong enough to trigger a buy.
3. Red Zone (Sell):
• Bearish trend (Fast EMA < Slow EMA)
• Price is below the Fast EMA.
• Indicates a strong downtrend and suggests selling or avoiding long trades.
4. Orange and Yellow Zones (Pre-Sell):
• Price is below the Fast EMA but above or near the Slow EMA.
• Represents potential bearish signals but not strong enough to trigger a sell.
These zones help traders visualize the market conditions and determine whether to buy, hold, or sell.
3. Buy and Sell Conditions
• Buy Condition:
A buy signal is triggered when:
• The price enters the Green Zone (Bullish trend and price > Fast EMA).
• It’s the first green candle after a non-green candle.
• Sell Condition:
A sell signal is triggered when:
• The price enters the Red Zone (Bearish trend and price < Fast EMA).
• It’s the first red candle after a non-red candle.
4. Trade Execution Logic
• Buy:
The strategy enters a long position (buy) when the above buy condition is met.
• Sell:
The strategy exits the long position when the sell condition is met.
Note: It doesn’t support short trades, meaning it doesn’t enter sell positions.
5. Momentum-Based Signals (Optional)
The indicator also includes momentum signals using Stochastic RSI to provide additional buy/sell signals:
• These are based on oversold and overbought levels of the Stochastic RSI.
• It filters signals depending on whether the trend is Bullish or Bearish.
6. Visual Features
The indicator is designed to make the trading zones and signals visually intuitive:
• Bar Colors:
Candlesticks are colored based on the current zone (e.g., Green for Buy, Red for Sell).
• EMA Lines:
The Fast EMA and Slow EMA are plotted, making it easy to see crossover points.
• Buy/Sell Signals:
Marked with shapes (e.g., circles) below/above bars for clarity.
7. Strategy Assumptions
• Trend-Following Nature:
This strategy assumes that trends persist. It works best in trending markets but might give false signals in ranging markets.
• Lagging Nature of EMAs:
As EMAs are lagging indicators, buy and sell signals may occur after significant moves have already begun or ended.
• Momentum Confirmation (Optional):
Adding momentum signals can help filter false signals, though it’s not part of the core logic.
8. Usage Recommendations
• Timeframes:
Works on various timeframes but may perform better on higher timeframes (e.g., 1H, Daily) to reduce noise.
• Markets:
Can be applied to stocks, forex, and cryptocurrencies.
• Backtesting and Optimization:
Before live trading, backtest the strategy with different EMA periods and other parameters to find optimal settings for your market and timeframe.

Trade Entry Detector, Wick to Body Ratio Trade Entry Detector: Wick-to-Body Ratio Strategy with Bollinger Bands
Overview
The Trade Entry Detector is a custom strategy for TradingView that leverages the Bollinger Bands and a unique wick-to-body ratio approach to capture precise entry opportunities. This indicator is designed for traders who want to pinpoint high-probability reversal points when price interacts with Bollinger Bands, all while offering flexible entry fill options.
The strategy performs primary analysis on the daily time frame, regardless of your current chart setting, allowing you to view daily Bollinger Band levels and entry signals even on lower time frames. This approach is suitable for swing traders and short-term traders looking to align intraday moves with higher time frame signals.
How the Strategy Works
1. Bollinger Band Analysis on the Daily Time Frame
Bollinger Bands are calculated using a 20-period simple moving average (SMA) and a standard deviation multiplier (default is 2). These bands dynamically expand and contract based on market volatility, making them ideal for identifying overbought and oversold conditions:
* Upper Band: Indicates potential overbought levels.
* Lower Band: Indicates potential oversold levels.
2. Wick-to-Body Ratio Condition
This strategy places significant emphasis on candle wicks relative to the candle body. Here’s why:
* A large upper wick relative to the body signals potential selling pressure after testing the upper Bollinger Band.
* A large lower wick relative to the body indicates buying support after testing the lower Bollinger Band.
* Ratio Threshold: You can set a minimum wick-to-body ratio (default is 1.0), meaning that the wick must be at least equal in size to the body. This ensures only candles with significant reversals are considered for entry.
3. Flexible Entry Timing
To adapt to various trading styles, the indicator allows you to choose the entry fill timing:
* Daily Close: Enter at the close of the daily candle.
* Daily Open: Enter at the open of the following daily candle.
* HOD (High of Day): Set entry at the daily high, for those who want confirmation of upward momentum.
* LOD (Low of Day): Set entry at the daily low, ideal for confirming downward movement.
4. Position Sizing and Risk Management
The strategy calculates position size based on a fixed risk percentage of your account balance (default is 1%). This approach dynamically adjusts position sizes based on stop-loss distance:
* Stop Loss: Placed at the nearest swing high (for shorts) or swing low (for longs).
* Take Profit: Exits are triggered when the price reaches the opposite Bollinger Band.
5. Order Expiration
Each pending order (long or short) expires after two days if unfilled, allowing for new setups on subsequent candles if conditions are met again.
Using the Trade Entry Detector
Step-by-Step Guide
1. Set the Primary Time Frame
The core calculations run on the daily time frame, but the strategy can be applied to intraday charts (e.g., 65-minute or 15-minute) for deeper insights.
2. Adjust Bollinger Band Settings
* Length: Default is 20, which determines the period for calculating the moving average.
* Standard Deviation Multiplier: Default is 2.0, which sets the width of the bands. Adjusting this can help you capture broader or tighter volatility ranges.
3. Define the Wick-to-Body Ratio
Set the minimum ratio between wick and body (default 1.0). Higher values filter out candles with less wick-to-body contrast, focusing on stronger rejection moves.
4. Choose Entry Fill Timing
Select your preferred fill condition:
* Daily Close: Confirms the trade at the end of the daily session.
* Daily Open: Executes the entry at the open of the next day.
* HOD/LOD: Uses the daily high or low as an additional confirmation for upward or downward moves.
5. Position Sizing and Risk Management
* Set your account balance and risk percentage. The strategy automatically calculates position sizes based on the stop distance to manage risk efficiently.
* Stop Loss and Take Profit points are automatically set based on swing highs/lows and opposing Bollinger Bands, respectively.
Practical Example
Let’s say SPY (S&P 500 ETF) tests the lower Bollinger Band on the daily time frame, with a lower wick that is twice the size of the body (meeting the 1.0 ratio threshold). Here’s how the strategy might proceed:
1. Signal: The lower wick on SPY suggests buying interest at the lower Bollinger Band.
2. Entry Fill Timing: If you’ve selected "Daily Open," the entry order will be placed at the next day's open price.
3. Stop Loss: Positioned at the nearest daily swing low to minimize risk.
4. Take Profit: If SPY price moves up and reaches the upper Bollinger Band, the position is automatically closed.
Indicator Features and Benefits
* Multi-Time Frame Compatibility: Perform daily analysis while tracking signals on any intraday chart.
* Automatic Position Sizing: Tailor risk per trade based on account balance and desired risk percentage.
* Flexible Entry Options: Choose from close, open, HOD, or LOD for optimal timing.
* Effective Trend Reversal Identification: Uses wick-to-body ratio and Bollinger Band interaction to pinpoint potential reversals.
* Dynamic Visualization: Bollinger Bands are displayed on your chosen time frame, allowing seamless intraday tracking.
Summary
The Trade Entry Detector provides a unique, data-driven way to spot reversal points with customizable entry options. By combining Bollinger Bands with wick-to-body ratio conditions, it identifies potential trade setups where price has tested extremes and shown reversal signals. With its flexible entry timing, risk management features, and multi-time frame compatibility, this indicator is ideal for traders looking to blend daily market context with shorter-term execution.
Tips for Usage:
* For swing trading, consider the Daily Open or Close entry options.
* For momentum entries, HOD or LOD may offer better alignment with the direction of the wick.
* Backtest on different assets to find optimal Bollinger Band and wick-to-body settings for your market.
Use this indicator to enhance your understanding of price behavior at key levels and improve the precision of your entry points. Happy trading!

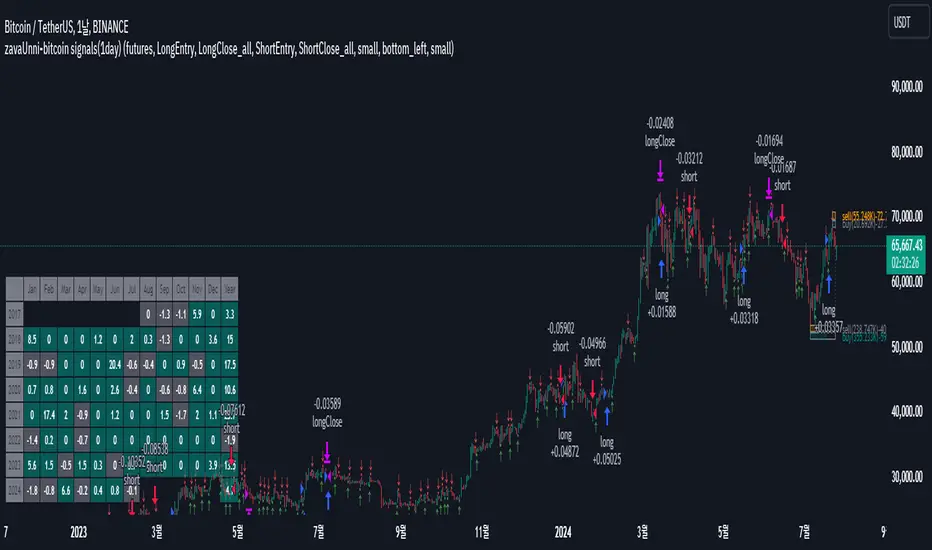
zavaUnni-bitcoin signals(1day)
📌 This strategy predicts price movements based on trading volume and enters positions accordingly. It calculates the expected price increase based on bullish volume and the expected price decrease based on bearish volume to determine the direction of the position.
Top predicted price based on declining bullish volume: top_ifpricebull
Bottom predicted price based on declining bearish volume: top_ifpricebear
Top predicted price based on increasing bullish volume: bot_ifpricebull
Bottom predicted price based on increasing bearish volume: bot_ifpricebear
Using these four values, the strategy calculates the final maxprice and minprice based on volume. If the price settles above the max value, it indicates an upward trend; if it settles below the min value, it indicates a downward trend.
📌 The indicator does not solely rely on the maxprice and minprice conditions. It incorporates complex and sophisticated analysis by considering average volume and candle size.
During a decline, if the average volume and spread of bullish candles exceed those of bearish candles and the price settles above the max value, a long position is entered.
During a rise, if the average volume and spread of bearish candles exceed those of bullish candles and the price settles below the min value, a short position is entered.
Even if the above conditions are met, if the buying pressure significantly outweighs the selling pressure, the position will be closed, but a reverse position will not be entered.
Reviewing historical data shows that while there are instances where the position switches from long to short immediately, there are also cases where the position is closed and re-entered after a few candles.
📌 Trading volume is one of the most traditional yet essential indicators, accurately reflecting price direction. This strategy, which simultaneously predicts fundamental trading volume and price changes, consistently achieves a profit factor above 3.
Characteristics and Historical Data of the Strategy
🔴 Short position entry: April 11, 2022
🟢 Long position entry after closing short: January 11, 2023
⚫ Short position holding period: 270 days
🟢 Long position entry: October 9, 2020
🔵 Long position exit: November 30, 2019
⚫ Long position holding period: 52 days
🟢 Long position entry: November 30, 2019
🔵 Long position exit: February 22, 2021
⚫ Long position holding period: 84 days
Settings Explanation
🛠️ In the input, you can choose between spot and futures. Buy and sell signals are generated in spot trading, while long and short signals are generated in futures trading.
🌈 You can configure the screen view.
Fibonacci Trend
Falling Fibonacci levels from the top: 382 and 618 levels (Red lines)
Rising Fibonacci levels from the bottom: 382 and 618 levels (Green lines)
When the price stays within the 382 and 618 levels of the falling Fibonacci, the background turns red; when it stays within the 382 and 618 levels of the rising Fibonacci, the background turns green.
Real-time Volume Strength of Bullish and Bearish Candles
Red arrow: Appears when the strength of bearish candles increases
Green arrow: Appears when the strength of bullish candles increases
Cumulative Volume of Bullish and Bearish Candles during the Trend
Cumulative data of falling bullish and bearish candles from the top
Cumulative data of rising bullish and bearish candles from the bottom
Profit Table
Provides annual and monthly profit tables.
Setting Options
You can change the options in the attributes to test different configurations.
📌 Trading Data
Although Binance data starts from 2017, limiting the number of trades to 60 as of July 2024, this does not undermine the validity of the strategy. Binance provides reliable volume data, which is crucial for evaluating the strategy's performance. In contrast, exchanges like Bitstamp may have longer trading histories but insufficient volume to properly assess the strategy's actual performance. A volume-based strategy cannot be reliably tested on an exchange with low trading volume. Therefore, despite the limited number of trades on Binance, its reliable volume data justifies its use for this strategy.
► Backtesting Details:
Timeframe: 1D / Bitcoin / TetherUS
Initial Balance: $50,000 (Enter the initial capital you will invest)
Order Size: 10% (Enter the percentage of your account balance you will trade)
Commission: 0.04% (Enter the trading commission)
Slippage: 10 ticks (Enter the slippage you want to test)
When using the strategy:
📢 Timeframe: While the strategy performs well on timeframes lower than daily, it is particularly profitable on the daily timeframe.
📢 Exchange: It is recommended to use Binance due to its reliable volume data.
📢 This strategy is suitable for traders who have the patience to hold positions for extended periods, as it calculates the size of bullish and bearish candles carefully and does not change positions easily.
📢 Spot trading is recommended over futures, and if using futures, leverage should be limited to a maximum of 2x.
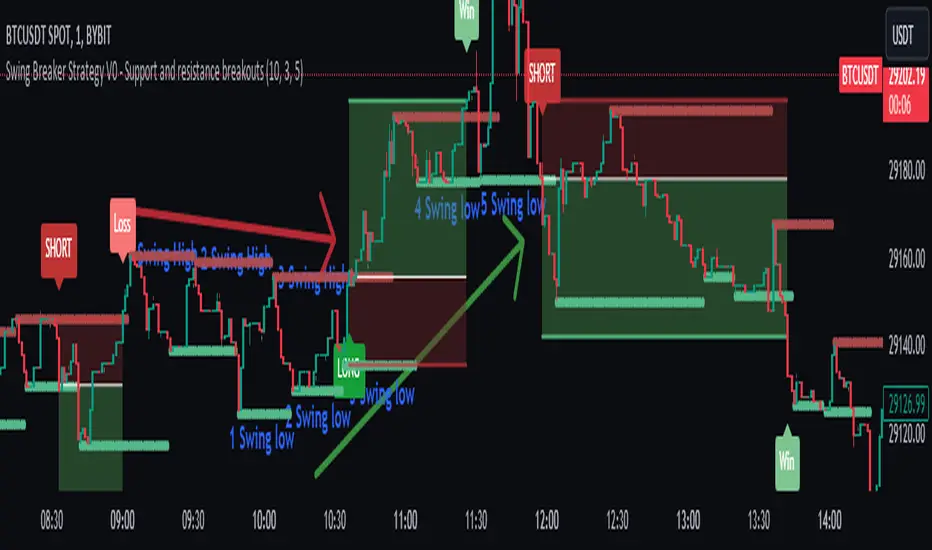
Swing Breaker Strategy [v0.1] - Support and resistance breakoutSwing Breaker Strategy - Support and Resistance Breakouts
This strategy has no repainting.
Default settings:
Swing Barsback: 10
Number of Swings: 3
Stoploss Candles Lookback: 5
Why these default settings?
This strategy has been backtested with over 100 trades, and on a larger scale of 1000 trades, it has reported a 1.33 profit factor with a maximum 5% cumulative drawdown, using no leverage. In this backtest, the settings (10,3,5) were used, becoming the default settings as they are more adaptable to different market conditions.
How does this strategy work?
Defining swing lows (support) and swing highs (resistance): We can locate these candles by looking at a symmetrical candle unit around them. For example, the default settings present a 10 swing bars back, which means there is no superior level within a 10-candle radius in the case of a swing high, and the opposite for a swing low. Swings are located a few candles after, just the number of swing bars back (width), because it is needed to ensure it is a swing.
Locating trends: We locate trends by looking at consecutive swings. For example, in the default settings, to determine a bullish trend, we need 3 consecutive ascending swing lows; for a bearish trend, 3 consecutive descending swing highs. You can find this parameter in settings as "Number of swings."
When a trend is formed, a stop entry is placed at the last swing until it is broken.
Just after the entry, the stop is placed at the lowest (in the case of a long) or the highest (in the case of a short) of the last candles. You can define that number in the settings as "Stoploss candles lookback," which default is 5. The take profit is placed at 2 times the stop value, resulting in a 2 risk-reward ratio.
Why is this strategy protected?
No other strategy combines the way of locating swings and turning it into a strategy, including customizable parameters such as stop loss, swing width and introducing the number of swings. That's why we decided to protect it.
Premium Smart Exit HMA [ByteBoost]The Premium Smart Exit HMA strategy is designed for fast-paced trend detection and is well-suited for small trades in highly volatile markets. It utilizes the Hull Moving Average (HMA) as a signal to execute trades and offers customizable inputs for price calculation, period settings, and stop loss/take profit levels. The strategy aims to reduce lag associated with traditional moving averages, allowing it to catch trends quickly.
Development Notes
This Strategy was developed with the PineScript language, version 5. The aim of the strategy is to provide a trading system that catches fast trend reversals and uses a modified version of the Hull Moving Average. The HMA adeptly adapts to swift variations in price movements while offering better smoothing and utilizes a user selected moving averages, mitigating the smoothing effect and is controlled with a custom weight design.
Features
Customizable trading periods.
Customizable stop loss and take profit levels.
Adjustable date range for backtesting.
Allows setting of initial capital, commission type and value.
Provides visual aids for better understanding of the market trends.
Customize the visuals of the strategy.
Strategy Description
The Smart Exit HMA strategy offers the flexibility to use various types of moving averages, allowing customization of inputs for price calculation, period settings, and stop loss/take profit levels. The strategy relies on the Hull Moving Average (HMA) as a signal to execute trades. However, you have control over the signal frequency by selecting your preferred period value, which determines the number of candles used in the average calculation. This allows you to adapt the strategy to market tendencies and increase its effectiveness during clear trends.
The Smart Exit HMA strategy is designed to minimize lag associated with traditional moving averages, enabling it to respond more quickly to recent price movements based on your chosen period. It's worth noting that the strategy plots two lines on the graph: the average line and the square root line. Buy and sell signals are generated when both lines intersect, indicating favorable trading opportunities.
Inputs/Settings
Capital - If using any leverage multiply the amount of money to invest by the leverage, else input the amount to be invested in every trade.
Start date - The date from which the strategy should begin its analysis. Leave unchanged to start from the earliest available date based on your account's plan.
End date - The date until which the strategy should conduct its analysis. Leave unchanged to continue until the current date.
Period - The lookback period for the moving average calculation, a longer period will translate into fewer trades that last longer.
Stop loss - Allows the use of a stop loss for all trades.
Take profit - Activates the use of a take profit for all trades.
Stop loss value - The distance from the entry price at which the strategy should exit to prevent further losses.
Take profit value - The distance from the entry price at which the strategy should exit to secure profits.
Take profit % - The percentage of the capital to take as profit.
Stop loss % - The percentage of the capital to set as the maximum loss.
Candles exit - The minimum number of candles before the strategy is allowed to close a trade.
Candles change - The minimum number of candles before the strategy is allowed to change the current trend.
Moving average type - Determines the preprocessing method applied prior to utilizing the HMA.
Custom weight - Enables the utilization of a personalized weighting system for the HMA. If chosen, ensure that the sum of all weights equals 1.
Open weight - Determines the weight assigned to the candle's open value.
Close weight - Specifies the weight assigned to the candle's close value.
High weight - Sets the weight attributed to the candle's high value.
Low weight - Determines the weight assigned to the candle's low value.
Highlighter - Light coloring between the trend and average price of each bar.
Signal labels - View the labels indicating a new long or short position.
Exit labels - Displays the labels indicating exit points.
Color long - Sets the color scheme for a new long position.
Color short - Sets the color scheme for a new short position.
Color exit - Decides the color scheme for the exit tag and cross shown.
Indicator Visuals
The strategy plots the two trendlines on the chart and changes its color based on its direction. It also plots shapes on the chart to denote potential buy (Long) and sell (Short) points where the signals of short and long will appear, as well as crosses for the exit points.
Strategy Alerts
The strategy does not include built-in alerts. However, alerts can be added using the TradingView interface based on the strategy's buy, sell and exit conditions. This way you will be able to receive notifications on your computer or phone when a new signal goes out.
Details
Repainting: It is important to mention that the strategy can mark an uptrend signal during a candle and disappear at the end of it, so please just put long or short when the buy/sell conditions are followed and marked by the strategy at the end of each candle.
Conclusion
The Premium Smart Exit HMA is a versatile strategy that combines the benefits of the Hull Moving Average with adjustable parameters to suit individual trading styles. It offers a combination of speed and smoothness, which can be beneficial in volatile markets.
Disclaimer
This strategy is provided as-is, with no guarantee of profits or responsibility for losses. Trading involves risk, and you should only trade with money you can afford to lose. Always conduct your own research and consider your financial situation before engaging in trading.

ARCHENS SHARESThis script marks the high and low of 9.45 to 10.15 price. When the price breaks high, then gives Buy signal. When the price breaks low, then it gives Sell Signal. These buy and sell signals are given with labels "ARCHENS BUY" or "ARCHENS SELL". With my observation in stock market, I have made this strategy.
This strategy works in normal candle pattern but i observed that it works well in heikenashi candle. For this strategy to work well, we have to select 5 mins heikenashi candles.
If this strategy gives "ARCHENS buy", then buy it. Target should be as per individuals mind. But Stop loss should be hitted when there are two continue opposite {red} heikenashi candle.
If this strategy gives "ARCHENS sell", then sell it. Target should be as per individuals mind. But Stop loss should be hitted when there are two continue opposite {green} heikenashi candle.
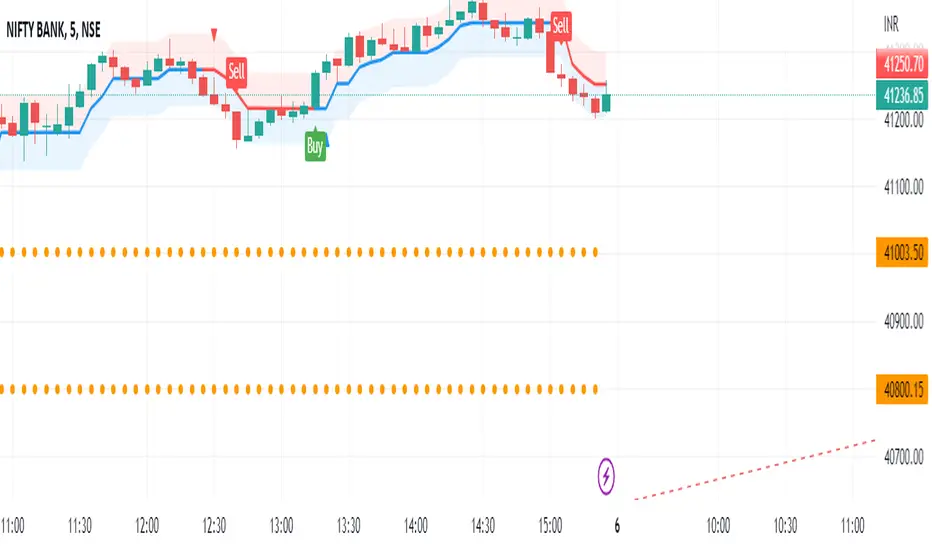
GAVAD - Selling after a Strong MovimentThis strategy search for a moment whe the market make two candles are consistently strong, and open a Sell, searching the imediactly correction, on the new candle. It`s easy to see the bars on the histogram graph. Purple Bars represent the candle variation. when on candle cross ove the Signal line the graph plot an Yellow ci, if the second bar crossover the signal a green circle is ploted and the operation start on start of the next candle.
This strategy can be used in a lot of Stocks and other graphs. many times we need a small time of graph, maybe 1 or 5 minutes because the gain shoud be planned to a midle of the second candle. You need look the stocks you will use.
Stocks > 100 dolars isnt great, markets extremly volatly not too. but, Stocks that have a consistently development are very interisting. Look to markets searching maybe 0.5% or 1%.
For this moment, I make the development of a Brasilian Real x American Dollar. In 15 Minutes.
if you use in small timeframe the results can be better.
On this time we make more than 500 trades with a small lot of contracts, without a big percent profitable, but a small profit in each operation, maybe you search more than. To present a real trading system I insert a spreed to present a correct view of the results.
Each stock, Index, or crypto there is a specific configuration?
my suggestion for new stocks
You need choice a stock and using the setup search set over than 70% gain (percent profitable), using a 1% of gain and loss between 1-2%
as the exemple (WDO)
default I prepare a Brazilian Index
6-signal (6% is variation of a candle of the last candle)
10000- multiplicator (its important to configure diferences betwen a stock and an Indice)
gain 3 (this proportion will be set looking you target, how I say, 1% can be good)
loss 8 (this proportion will be set with you bankroll management, how I say, maybe 2%, you need evaluate)
for maximize operations I use in the 1 or 5 minute graph. Timeframes more large make slowlly results,
(but not unable that you use in a 1 hour or a 1 day.)
I make this script by zero. Maybe the code doesnt so organized, but is very easy to understand. If you have any doubts . leave a comment.
I hope help you.

TTP Kent Strat PROKent Strat PRO trades breakouts using Bollinger Bands together with SuperTrend.
PRO features:
- 3commas bot alerts for long/short bots
- Custom JSON bots alerts
Features:
- Risk/reward ratio parameter
- Longs, shorts and combined positions.
- Breakout settings
- Trailing SL, trailing TP
- Use of latest candles to place the SL using a lookback parameter (how many candles to look back for a low/high price)
- Select your SL between the ATR trendline and the latest candle: the closest or furthest away value
- Show the trendline
- Backtest mode for accurate backtests
- Signal mode for live price accurate signals
- Date range backtesting
Filters:
- EMA 200 filter and timeframe selector. This filter can be used to trade with the trend: open longs on an uptrend and shorts on a downtrend.
- ADX filter using threshold. This filter can be used to filter entries where the trend is not very strong.
- ADX pointing up. ADX values pointing up and above certain threshold can improve entries.
- Relative volume filter based on the volume being X% above the MA of the Volume. Trading with volume can help filtering out bad trades.
Example setup:
1) pick BINANCE:ETHUSDT chart, 15 min chart
2) trade longs + shorts
3) pick ratio 3
4) trailing SL checked
5) trailing TP unchecked
7) stop loss "furthest"
8) candle loopback 30
9) BB period 21, dev 1, ATR filter on, atr period 5
10) EMA filter on, 15 min
11) ADX off
12) Volume filter on set to 60%

TTP Kent StratKent Strat trades breakouts using Bollinger Bands together with SuperTrend.
Features:
- Risk/reward ratio parameter
- Longs, shorts and combined positions.
- Breakout settings
- Trailing SL, trailing TP
- Use of latest candles to place the SL using a lookback parameter (how many candles to look back for a low/high price)
- Select your SL between the ATR trendline and the latest candle: the closest or furthest away value
- Show the trendline
- Backtest mode for accurate backtests
- Signal mode for live price accurate signals
- Date range backtesting
Filters:
- EMA 200 filter and timeframe selector. This filter can be used to trade with the trend: open longs on an uptrend and shorts on a downtrend.
- ADX filter using threshold. This filter can be used to filter entries where the trend is not very strong.
- ADX pointing up. ADX values pointing up and above certain threshold can improve entries.
- Relative volume filter based on the volume being X% above the MA of the Volume. Trading with volume can help filtering out bad trades.
Example setup:
1) pick BINANCE:ETHUSDT chart, 15 min chart
2) trade longs + shorts
3) pick ratio 3
4) trailing SL checked
5) trailing TP unchecked
7) stop loss "furthest"
8) candle loopback 30
9) BB period 21, dev 1, ATR filter on, atr period 5
10) EMA filter on, 15 min
11) ADX off
12) Volume filter on set to 60%

[MT Trader] Backtest template w/ Supertrend Strategy---EN: In this strategy template you will find some functions already pre-programmed to be used in your strategies to speed up the programming process, among them we can highlight the default stop loss and take profit functions, which will help to set easily and quickly, defining the price range in which we want to prevent large losses or protect our profits from unexpected market movements.
🔴 Stop Loss: Among the functions of the stop loss are the 4 most known, first we have the fixed percentage range (%) and price ($), when the price reaches this fixed price will limit the losses of the operation avoiding larger losses, then we have the average true range (ATR), a moving average of true range and X period that can give us good reference points to place our stop loss, finally the last point higher or lower is the most used by traders to place their stop loss.
In addition, the price range between the entry and stop loss can be converted into a trailing stop loss.
🟢 Take Profit: We have 3 options for take profit, just like stop loss, the fixed range of percentage(%) and price($), are available, in addition to this we have the 1:# ratio option, which multiplies by X number the range between the entry and stop loss to use it as take profit, perfect for strategies that use ATR or last high/low point for their strategy.
📈 Heikin Ashi Entrys: The heikin ashi entries are trades that are calculated based on heikin ashi candles but their price is executed in Japanese candles, thus avoiding the false results that occur in heikin candlestick charts, making that in certain cases better results are obtained in the strategies that are executed with this option compared to Japanese candlesticks.
📊 Dashboard: A more visual and organized way to see the results and data needed for our strategy.
Feel free to use this template to program your own strategies, if you find bugs or want to request a new feature let me know in the comments or through my telegram @hvert_mt
__________________________________________________________________________________________________________________________________________________
---ES: En esta plantilla de estrategia podrás encontrar algunas funciones ya pre-programadas para ser usadas en tus estrategias para acelerar procesos de programación, entre ellas podemos destacar las funciones por defecto de stop loss y take profit, que ayudaran a establecer de manera fácil y rápida, definiendo los rango de precio en los que queremos prevenirnos de perdidas grandes o proteger nuestras ganancias de movimientos inesperados del mercado.
🔴 Stop Loss: Entre las funciones del stop loss están las 4 más conocidas, en primer lugar tenemos el rango de porcentaje fijo(%) y el precio($), cuando el precio alcance este precio fijo se limitaran las perdidas de la operación evitando perdidas mas grandes, después tenemos el promedio de rango verdadero(ATR), una media móvil del rango verdadero y X periodo que nos puede dar buenos puntos de referencia para colocar nuestro stop loss, por ultimo el ultimo punto mas alto o mas bajo es de los mas usados por los traders para colocar su stop loss.
Adicional a esto, el rango de precio entre la entrada y el stop loss se puede convertir en un trailing stop loss.
🟢 Take Profit: Tenemos 3 opciones para take profit, al igual que en el stop loss, el rango fijo de porcentaje(%) y precio($) se encuentran disponibles, adicional a esto tenemos la opción de ratio 1:#, que multiplica por X numero el rango entre la entrada y el stop loss para usarlo como take profit, perfecto para estrategias que usen ATR o ultimo punto alto/bajo.
📈 Entradas Heikin Ashi: Las entradas Heikin Ashi son trades que son calculados en base a las velas Aeikin Ashi pero su precio esta ejecutado a velas japonesas, evitando así los falsos resultados que se producen en graficas de velas Heikin, esto haciendo que en ciertos casos se obtengan mejores resultados en las estrategias que son ejecutadas con esta opción en comparación con las velas japonesas.
📊 Panel de Control: Una manera mas visual y organizada de ver los resultados y datos necesarios de nuestra estrategia.
Siéntete libre de usar esta plantilla para programar tus propias estrategias, si encuentras errores o quieres solicitar una nueva función házmelo saber en los comentarios o a través de mi Telegram: @hvert_mt

Double SupertrendThis strategy is based on a custom indicator that was created based on the Supertrend indicator. At its core, there are always 2 super trend indicators with different factors to reduce market noise (false signals).
The strategy/indicator has some parameters to improve the signals and filters.
TECHNICAL ANALYSIS
☑ Show Indicators
This option will enable/disable the Supertrend indicators on the chart.
☑ Length
The length will be used on the Supertrend Indicator to calculate its values.
☑ Dev Fast
The fast deviation or factor from one of the super trend indicators. This will be the leading indicator for entry signals, as well as for the exit signals.
☑ Dev Slow
The slow deviation or factor from one of the super trend indicators. This will be the confirmation indicator for entry and exit signals.
☑ Exit Type
It's possible to select from 4 options for the exit signals. Exit signals always take profit target.
☑ ⥹ Reversals
This option will make the strategy/indicator calculate the exit signals based on the difference between the given period's highest and lowest candle value (see Period on this list). It's displayed on the chart with the cross. As it's possible to verify in the image below, there are multiple exit spots for every entry.
☑ ⥹ ATR
Using ATR as a base indicator for exit signals will make the strategy/indicator place limit/stop orders. Candle High + ATR for longs, Candle Low - ATR for shorts. The strategy will show the ATR level for take profit and stick with it until the next signal. This way, the take profit value remains based on the candle of the entry signal.
☑ ⥹ Fast Supertrend
With this option selected, the exit signals will be based on the Fast Supertsignal value, mirrored to make a profit.
☑ ⥹ Slow Supertrend
With this option selected, the exit signals will be based on the Slow Supertsignal value, which is mirrored to take profit.
☑ Period
This will represent the number of candles used on the exit signals when Reversals is selected as Exit Type. It's also used to calculate the gradient used on the Fills and Supertrend signals.
☑ Multiplier
It's used on the take profit when the ATR option is selected on the Exit Type.
STRATEGY
☑ Use The Strategy
This will enable/disable the strategy to show the trades calculations.
☑ Show Use Long/Short Entries
Option to make the strategy show/use Long or Short signals. Available only if Use The Strategy is enabled
☑ Show Use Exit Long/Short
Option to make the strategy show/use Exit Long or Short signals (valid when Reversals option is selected on the Exit Type). Available only if Use The Strategy is enabled
☑ Show Use Add Long/Short
Option to make the strategy show/use Add Long or Short signals. With this option enabled, the strategy will place multiple trades in the same direction, almost the same concept as a pyramiding parameter. It's based on the Fast Supersignal when the candle fails to cross and reverses. Available only if Use The Strategy is enabled
☑ Trades Date Start/End
The date range that the strategy will check the market data and make the trades
HOW TO USE
It's very straightforward. A long signal will appear as a green arrow with a text Long below it. A short signal will appear as a red arrow with a text Short above it. It's ideal to wait for the candle to finish to validate the signal.
The exit signals are optional but give a good idea of the configuration used when backtesting. Each market and timeframe will have its own configuration for the best results. On average, sticking to ATR as an exit signal will have less risk than the other options.
☑ Entry Signals
Follow the arrows with Long/Short texts on them. Wait for the signal candle to close to validate the entry.
☑ Exit Signals
Use them to close your position or to trail stop your orders and maximize profits. Select the exit type suitable for each timeframe and market
☑ Add Entries
It's possible to increase the position following the add margin/contracts based on the Add signals. Not mandatory, but may work as reentries or late entries using the same signal.
☑ What about Stop Loss?
The stop-loss levels were not included as a separated signal because it's already in the chart. There are some possible ideas for the stop loss:
☑⥹ Candle High/Low (2nd recommend option)
When it's a Long signal from the entry signal candle, the stop loss can be the Low value of the same candle. Very tight stop loss in some cases, depending on the candle range
☑⥹ Local Top/Bottom
Selecting the local top/bottom as stop loss will give the strategy more room for false breakouts or reversals, keeping the trade open and minimizing noises. Increases the risk
☑⥹ Fast Supertrend (1st recommend option)
The fast supertrend can be used as stop-loss as well. making it a moving level and working close to trail stop management
☑⥹ Fixed Percentage
It's possible to use a fixed risk percentage for the trades, making the risk easier to control and project. Since the market volatility is not fixed, this may affect the accuracy of the trades
☑⥹ Based on the ATR (3rd recommend option)
When the exit type option ATR is selected, it will display the take profit level for that entry. Just mirror that value and put it as stop-loss, or multiply that amount by 1.5 to have more room for market noise.
EXAMPLE CONFIGURATIONS
Here are some configuration ideas for some markets (all of them are from crypto, especially futures markets)
BTCUSDT 15min - Default configuration
BTCUSDT 1h - Length 10 | Dev Fast 3 | Dev Slow 4 | Exit Type ATR | Period 50 | Multiplier 1
BTCUSDT 4h - Length 10 | Dev Fast 2 | Dev Slow 4 | Exit Type ATR | Period 50 | Multiplier 1
ETHUSDT 15min - Length 20 | Dev Fast 1 | Dev Slow 3 | Exit Type Fast Supertrend | Period 50 | Multiplier 1
IOTAUSDT 15min - Length 10 | Dev Fast 1 | Dev Slow 2 | Exit Type Slow Supertrend | Period 50 | Multiplier 1
OMGUSDT 15min - Length 10 | Dev Fast 1 | Dev Slow 4 | Exit Type Slow Supertrend | Period 50 | Multiplier 1
VETUSDT 15min - Length 10 | Dev Fast 3 | Dev Slow 4 | Exit Type Slow Supertrend | Period 50 | Multiplier 1
HOW TO FIND OTHER CONFIGURATIONS
Here are some steps to find suitable configurations
select a market and time frame
enable the Use This Strategy option on the strategy
open the strategy tester panel and select the performance summary
open the strategy configuration and go to properties
change the balance to the same price of the symbol (example: BTCUSDT 60.000, use 60.000 as balance)
go back to the inputs tab and keep changing the parameters until you see the net profit be positive and bigger than the absolute value of the drawdown
in case you can't find a suitable configuration, try other timeframes
Since the tester reflects what happened in the past candles, it's not guaranteed to give the same results. However, this indicator/Strategy can be used with other indicators as a leading signal or confirmation signal.

[USDCHF-USDCAD] H1 Predict signal DinhChienFX's [2 orders]Identify trend:
4 EMAS 50-100-150-200:
- Uptrend: ema: 50 > 100 > 150 > 200
- Downtrend: ema: 50 < 100 < 150 < 200
Pivot:
- Left: 15 candles
- Right: 15 candles.
- Uptrend: Higher low - Higher High
- Downtrend: Lower Low - Lower High.
Keltner Channel:
- Uptrend: Candle crosses Upper 2.
- Downtrend: Candlestick crosses the Lower 2 line.
Strong trend according to ADX indicator:
- DI: 9
- Smooth: 9
- ADX: 38
Order entry point:
- Buy: Upper Keltner
- Sell Lower Keltner
Take Profit/Stop Loss: atr (20) x2 = Height of Keltner channel from Lower to Upper line.

CHOP Zone Entry Strategy + DMI/PSAR ExitThis is a Strategy with associated visual indicators and Long/Short and Reverse/Close Position Alerts for the Choppiness Index (CHOP) . It is used to determine if the market is choppy (trading sideways) or not choppy (trading within a trend in either direction). CHOP is not directional, so a DMI script was ported into this strategy to allow for trend confirmation and direction determination; it consists of an Average Directional Index (ADX) , Plus Directional Indicator (+DI) and Minus Directional Indicator (-DI) . In addition, a Parabolic SAR is also included to act as a trailing stop during any strong trends.
Development Notes
---------------------------
This indicator, and most of the descriptions below, were derived largely from the TradingView reference manual. Feedback and suggestions for improvement are more than welcome, as well are recommended Input settings and best practices for use.
www.tradingview.com
www.tradingview.com
www.tradingview.com
Recommend using the below DMI and PSAR indicators in conjunction with this script to fully visualize and understand how entry and exit conditions are chosen. Variable inputs should correlate between the scripts for uniformity and visual compatibility.
THANKS to LazyBear and his Momentum Squeeze script for helping me quickly develop a momentum state model for coloring the Chop line by trend.
Strategy Description
---------------------------
CHOP produces values that determine whether the market is choppy or trending . The closer the value is to 100 , the higher the choppiness levels , while the closer it is to 0 , the stronger the market is trending . Territories for both levels, and their associated upper and lower thresholds, are popularly defined using the Fibonacci Retracements, 61.8 and 38.2.
Basic Use
---------------------------
CHOP is often used to confirm the market condition to help you stay out of sideways markets and only enter when there is movement or imminent explosions. When readings are above the upper threshold, continued sideways movement may be expected, while readings below the lower threshold are typically indicative of a continuing trend. It is also used to anticipate upcoming trendiness changes, with the general belief that extended periods of consolidation (sideways movement) are followed by extended periods of strong, trending, directional movement, and vice versa.
One limitation in this index is that you must be cautious in deciding whether the range or trend will likely continue, or if it will reverse.
Confidence in price action and trend is higher when two or more indicators are in agreement -- while this strategy combines CHOP with both DMI and PSAR, we would still recommend pairing with other indicators to determine entry or exit trade opportunities.
Recommend also choosing 'Once Per Bar Close' when creating alerts.
Inputs
---------------------------
Strategy Direction - an option to only trade Short, Long, Both, or only in the direction of the Trend (Follow Trend is the Default).
Sensitivity - an incremental variable to test whether the past n candles are in the same trend state before triggering a delayed long or short alert (1 is the Default). Can help filter out noise and reduces active alerts.
Show Chop Index - two visual styles are provided for user preference, a visible Chop line with a background overlay, or a compact column and label only view.
Chop Lookback Period - the time period to be used in calculating CHOP (14 is the Default).
Chop Offset - changing this number will move the CHOP either forwards or backwards relative to the current market (0 is the Default).
Smooth Chop Line and Length - if enabled, the entered time period will be used in calculating a smooth average of the index (Enabled and 4 are the Defaults).
Color Line to Trend Direction - toggles whether the index line is colored to visually depict the current trend direction (Enabled is the Default).
Color Background - toggles the visibility of a background color based on the index state (Enabled is the Default).
Enable DMI Option - if enabled, then entry will be confirmed by and dependent on the ADX Key Level, with any close or reversal confirmed by both ADX and +/-DI to determine whether there is a strong trend present or not (Enabled is the Default).
ADX Smoothing - the time period to be used in calculating the ADX which has a smoothing component (14 is the Default).
DI Length - the time period to be used in calculating the DI (14 is the Default).
ADX Key Level - any trade with the ADX above the key level is a strong indicator that it is trending (23 to 25 is the suggested setting).
Enable PSAR Option - enables trailing stop loss orders (Enabled is the Default).
PSAR Start - the starting value for the Acceleration Force (0.015 is our chosen Default, 0.02 is more common).
PSAR Increment - the increment in which the Acceleration Force will move (0.001 is our chosen Default, 0.02 is more common).
PSAR Max Value - the maximum value of the Acceleration Factor (0.2 is the Default).
Color Candles Option - an option to transpose the CHOP condition levels to the main candle bars. Note that the outer red and green border will still be distinguished by whether each individual candle is bearish or bullish during the specified timeframe.
Note too that if both DMI and PSAR are deselected, then close determinations will default to a CHOP reversal strategy (e.g., close long when below 38.2 and close short when above 61.8). Though if either DMI or PSAR are enabled, then the CHOP reversal for close determination will automatically be disabled.
Indicator Visuals
---------------------------
For the candle colors, black indicates tight chop (45 to 55), yellow is loose chop (38.2 to 45 and 55 to 61.8), dark purple is trending down (< 38.2), and dark blue is trending up (> 61.8).
The background color has additional shades to differentiate a wider range of more levels…
• < 30 is dark purple
• 30 to 38.2 is purple
• 38.2 to 45 is light purple
• 45 to 55 is black
• 55 to 61.8 is light blue
• 61.8 to 70 is blue
• > 70 is dark blue
Long, Short, Close, and Reverse labels are plotted on the Chop line, which itself can be colored based on the trend. The chop line can also be hidden for a clean and compact, columnar view, which is my preferred option (see example image below).
Visual cues are intended to improve analysis and decrease interpretation time during trading, as well as to aid in understanding the purpose of this strategy and how its inclusion can benefit a comprehensive trading plan.
DMI and Trend Strength
---------------------------
To analyze trend strength, the focus should be on the ADX line and not the +DI or -DI lines. An ADX reading above 25 indicates a strong trend , while a reading below 20 indicates a weak or non-existent trend . A reading between those two values would be considered indeterminable. Though what is truly a strong trend or a weak trend depends on the financial instrument being examined; historical analysis can assist in determining appropriate values.
DMI exits trade when ADX is below the user selected key level (e.g., default is 25) and when the +/- DI lines cross (e.g., -DI > +DI exits long position and +DI > -DI exits short position).
PSAR and Trailing Stop
---------------------------
PSAR is a time and price based indicator that excels at measuring direction and duration, though not the actual strength of a trend, which is why we use this in conjunction with DMI. It is also included in this script as a trailing stop option to maximize gains during strong trends and to mitigate any false ADX strengthening signals.
This creates a parabola that is located below the candle during a Bullish trend and above during a Bearish trend. A buy or reversal is signaled when the price crosses above or below the Parabolic SAR.
Long/Short Entry
---------------------------
1. CHOP must be over 61.8 (long) or under 38.2 (short).
2. If DMI is enabled, then the ADX signal line must be above the user selected Key Level (default is 25).
3. If Sensitivity is selected, then that past candle must meet the criteria in step 1, as well as all the intermediate candles in between.
4. If "Follow Trend" is selected and PSAR is enabled, then a long position can only open when the momentum and PSAR are in an uptrend, or short when both are in a downtrend, to include all intermediate candles if the Sensitivity option is set on a past candle.
Close/Reverse
---------------------------
1. If DMI is enabled, then a close flag will be raised when the ADX signal drops below the Key Level (of 25), and -DI crosses over +DI (if long), or +DI crosses over -DI (if short).
2. If PSAR is enabled, then a close flag will be raised when the current trend state is opposite the last state.
3. If both DMI and PSAR are disabled, then a close flag will be raised if the Chop line drops under 38.2 (if long) or goes over 61.8 (if short).
4. If a Long or Short Entry is triggered on the same candle as any of the above close flags, then the position will be reversed, else the position will be closed.
Strategy Alerts
---------------------------
1. Long Entry
2. Short Entry
3. Reverse
4. Close
The provided backtest result is based on a position sizing of 10% equity with 100k initial capital. When testing SPX, disabling the DMI performed the best, but EURUSD performed poorly without it enabled, and TSLA had a small reduction in net profit. Timeframe likewise differed between commodities with TSLA performing best at 30M, SPX at 15M, and EURUSD at 4H. I do not plan on using this as a standalone strategy, but I also was expecting better results with the inclusion of EMI and PSAR to compliment the CHOP. Key elements of this script will likely be included in future, more holistic strategies.
Disclaimer
---------------------------
Past performance may not be indicative of future results. Due to various factors, including changing market conditions, the strategy may no longer perform as well as in historical backtesting. This post and the script are not intended to provide any financial advice. Trade at your own risk.
No known repainting, though there may be if an offset is introduced in the Inputs. I did my best not to code any other variables that repaint, but cannot fully attest to this fact.

Money Flow Club Bot Strategy 1-15 min ALLENG:
Friends, in this script, there is a function that calls the closing of the candle by Heikin ASHI candles.
You can disable it in the indicator settings.
There is no redrawing of the indicator on regular candlesticks.
The indicator is easy to set up for any trading pairs and any exchanges.
It has an entry point and provides 2 take profit.
It also contains consolidation zones when the price moves for a short time in the range that is visible on the indicator.
In order to try the indicator write in your personal messages.
The strategy does not specify a condition for exiting the position when the first take is taken, the stop is moved to breakeven, so the chart in the strategy turned out to be torn.
RUS:
Друзья, в этом скрипте присутствует функция вызывающая закрытие свечи по свечам Хейкин Аши.
Её можно отключить в настройках индикатора. На обычных свечах перерисовка индикатора отсутствует.
Индикатор легко настроить на любые торговые пары и любые биржи. А нем есть точка входа и предусмотрены 2 тейк профита.
Так же в нем присутствуют зоны консолидации когда цена короткое время движется в диапазоне который виден на индикаторе.
Для того что бы попробовать индикатор напишите в личные сообщения.
В стратегии не прописано условие выхода из позиции когда первый тейк взят, то стоп переносится в безубыток, поэтому график в стратегии получился рваный.
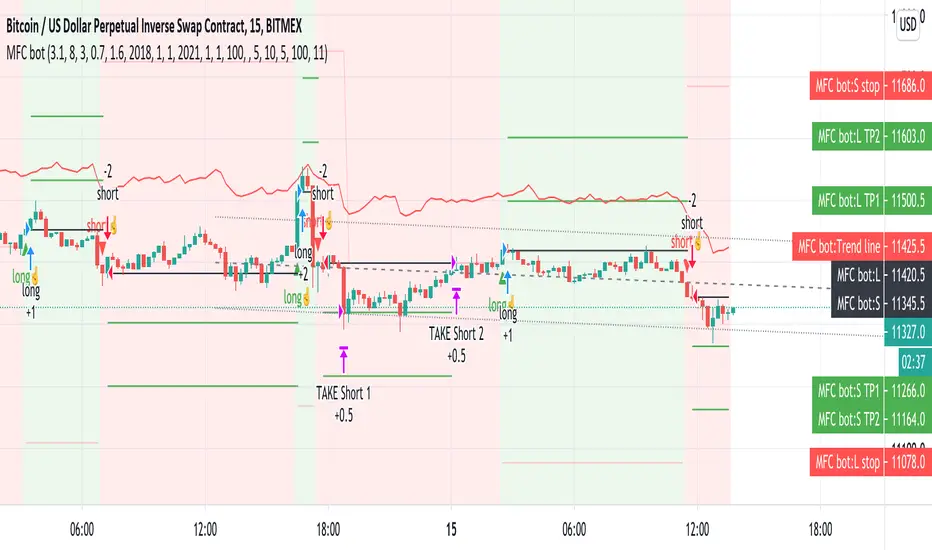
Heikin ashi power (lirshah)Heikin Ashi power strategy has been written based on the heikin ashi candles movement.
the strategy is composed from two different line, bullish candle line and bearish candle line.
the bullish line is a representative of bull power which is directly related to number of positive candles and also power of candles.
so the more positive candles and the more upward trends causes the powerful bullish line and conducted to an extreme level.
the strategy trigger buy signals when bullish line passes the extreme and similar scenario for selling signals.
this strategy has very good results on 5 Sec , 5 min and 15 min time frames.
also it can be applied to variety of markets, crypto, indices , cfd and futures.
the standard parameters are as below:
period:200
internal smooth: 5
external smooth: 10
extreme level: 1
take profit
stop-loss
below overview is results of XBTUSD on 5 min chart, with 1 contract trade and 0.075% commission per trade.
in order to access scripts contact me directly.