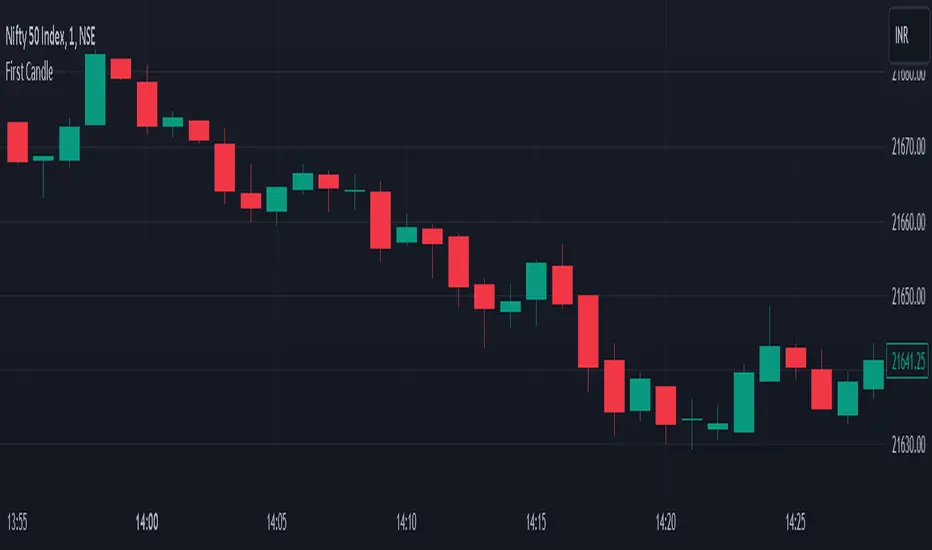
Volume Density CandleA candle chart that indicates congestion or resistance by the color of each candle.
The transparency of each candle is based on volume density.
Volume density is calculated as follows.
Volume density = Volume / Price range
Price range uses true range "max(high - low, abs(high - close ), abs(low - close ))".
Since volume density varies drastically by stock or time, the transparency is calculated based on the deviation rate from the average volume density.
If the candle is shorter and the color is brighter (less transparency), there is more transactions in the narrow price range than usual, and it could mean the candle's price range is congestion or resistance.
If the price breaks through that price range or rebounds from it, the price could move further in that direction.
Search in scripts for "candle"
Smarter Pullback + Candlestick Pattern (Steven Hart)Built with love "Smarter Pullback + Candlestick Pattern"
This indiator will help you to find a Pullback + Candlestick Pattern, inspirated by Steven Hart
You can combine with your own strategy, or use this purely
DISCLAIMER :
Measure the risk first before use it in real market
Backtest The Strategy was very important, so you know the probability
Fundamentally Logical :
Pullback (Some Previous candle is Red for Bull Pullback vice versa)
the Entry candle must be a Candlestick Pattern
Features :
1. Engulfing
2. Hammer & Shooting Star
3. Doji
How to use it :
1. Adjust the Pullback Period
2. Check and Uncheck the Pattern you want to see
3. Adjust the style to your favourite
Regards,
Hanabil
15m Candle ToolShows historical 15min candles for the 1m, 3m , and 5m time frames.
Counts down the time until the current 5m, 15m, and 1H candles close.
Recommended use on the 1m, 3m , and 5m TimeFrames!!!
Legend:
Vertical Lines (Left to Right)
-15m Candle wick (solid line) *
-Close of current 5m candle (red dotted)
-Close of current 15m candle (blue dashed)
- Close of current 1H candle (green solid)
Horizontal Lines (Top to Bottom)
- Previous 15m high (top of wick) *
- Subdivisions of the low to high of the previous 15m candle (.25, .50, .75) (WHITE LINES, .50 is extended)
- inter candle average of the highs within the previous 15m candle (solid green)
- average of the inter candle highs and lows (grey dashed)
- inter candle average of the lows within the previous 15m candle (solid red)
- Previous 15m low (bottom of wick) *
Previous Candle Body *
* = Changes color based on the bar color.
Candle CurtainWHAT
This indicator hides the colour of the currently printing candle to avoid poor decisions being made.
WHY
Many trading strategies rely upon assessing the state of closed candles. Making trading decisions based on the currently printing candle's state can lead to poor trading outcomes (emotional decisions, FOMO, lack of restraint, etc) as it can be bullish one moment and bearish the next. This indicator acts to remind the trader to disregard the currently printing candle and wait for it to close.
IMPORTANT: Please click the three dots beside the indicator's name and select 'Visual Order' -> 'Bring to Front'
Candle Percent Volatility by AllenlkThis indicator gives you the percentage movement of each candle. Measurements are taken between the candle High point and Low point, and also between the Open and Close and calculated in percent %. From there it smooths out the data with a moving average. This gives you an idea of how much volatility is within each candle given the time resolution of the chart.
I like to use this information as a way to turn off a strategy, or select a proper time resolution for a strategy. If each candle has less than 2.5% Volatility most strategies will typically buy and sell rapidly at prices that are too close together, potentially losing money. During those times it seems best to either temporarily turn off the strategy, change the time resolution or switch to another strategy.
NSDT MA Colored CandlesA simple script that will change the color of the candle if it closes over/under the designated Moving Average. This makes it very easy to identify trends based on your selected Moving Average line length. You can choose EMA, SMA, or WMA and of course the length is adjustable as well. To see these candles, be sure to go into the Chart Settings and uncheck the candle Borders, Colors, and Wicks.
Multi Time Frame CandlesHello Traders,
This script can show (upto) 3 candles of another time frames without changing chart time frame realtime . You can choose the time frame and number of candles in the options. You have option to change body and wick colors as well.
in this example number of candles is 2:
You can set body and wick colors:
In this example, weekly candles are shown on 1h chart:
Enjoy!
HTF Candle CloseThis draws a label to alert user when a higher timeframe candle closes on a intraday chart.
Purpose of it is so that people who mainly use lower timeframe charts do not forget to look at higher timeframe candle closes.
8020 Momentum and Pin CandleWe know the 80-20 Rule works very well in real life. It works well in technical analysis and price action as well.
This script identifies strong or momentum candles applying the rule body should be 80% or more of the range This is 80% body and 20% shadow.
Then there are pin candles where there is a 80% shadow and open and close is in one extreme and body is 20% or less.
If we can trade these 8020 candles effectively our trading will improve dramatically.
Use Momentum Candles for entry, stop loss, watching follow through etc
Use Pin Candles to look for reversals.
Works best in direction of trend.
In bullish market, green momentum candles are more powerful and pin candles after retracement is more powerful and vice versa.
Compare CandlesShows the candles of a specified EXCHANGE:PAIR in an indicator without overlay.
Has the following advantages over the standard comparison in TradingView:
- The compared pair is below your main chart.
- You can see the price of the compared pair.
- You can add multiple compared pairs and all of them will be shown in their own space with their own price.
Current Candle DateTimeThis is a simple script that users can easily see that datetime of the current candle. This is useful when backtesting and you want to be able to quickly glance and see where we are up to. Useful for when you are backtesting a strategy and trying to stay within a particular trading session.
The indicator will display in the top right hand corner, so it wont get in the way of any other analysis.
HTF Candle Boxes (Body Focused)- GH improved v 0.9the candle body doesn't bleed into the next candle. To me a major improvement.
I will next work on making the "wick"on the higher time frame look like a "wick"
Please read the diss-haiku in the code.
No offence!
Dual Candle PathThis indicator displays the Master Trendline. This line is composed of two other lines: the Candle Born Trendline and the Candle End Trendline. Visualizing its progress allows you to track the significant influence of the closing price on price movements and the various ways in which it determines them. Its use is enhanced when the candlestick color is removed.
The Strat Candle Labels & Color Inc F2D F2UThis script uses TheStrat candle numbers 1, 2D, 2U, 3 and places the text below or above. I have also now added the Failed 2D/2U labels. You can also change the text size. This also allows you to change the colors of the candles with two options for the 1 & 3 so you can color them in the direction they are going. For example a 1 that is green can be green and a 1 that is red can be red.
The Strat Candle Types (1 / 2U / 2D / 3)This script uses TheStrat candle numbers 1, 2D, 2U, 3 and places the text below or above. You can also change the text size. This also allows you to change the colors of the candles with two options for the 1 & 3 so you can color them in the direction they are going. For example a 1 that is green can be green and a 1 that is red can be red.
FOR CRT SMT – 4 CANDLEFOR CRT SMT – 4 CANDLE Indicator
This indicator detects SMT (Smart Money Technique) divergence by comparing the last 4 candle highs and lows of two different assets.
Originally designed for BTC–ETH comparison, but it works on any market, including Forex pairs.
You can open EURUSD on the chart and select GBPUSD from the settings, and the indicator will detect SMT divergence between EUR and GBP the same way it does between BTC and ETH. This makes it useful for analyzing correlated markets across crypto, forex, and more.
🔴 Upper SMT (Bearish Divergence – Red)
Occurs when:
The main chart asset makes a higher high,
The comparison asset makes a lower high.
This may signal a liquidity grab and potential reversal.
🟢 Lower SMT (Bullish Divergence – Green)
Occurs when:
The main chart asset makes a lower low,
The comparison asset makes a higher low.
This may indicate the market is sweeping liquidity before reversing upward.
📌 Features
Uses the last 4 candles of both assets.
Automatically draws divergence lines.
Shows clear “SMT ↑” or “SMT ↓” labels.
Works on Crypto, Forex, and all correlated assets.
Heikin Ashi Background Color for candles highlights the back ground candle with the corresponding heiken ashi candle colour
while still showing the exact japanese candle stick price action
Highlight Running 30m CandleThis script highlight 30 minute running candle.
mostly used for crypto trading
15m Open Segments + Live 15m Candle I created this script for so you can add a 15m candle overlay on your lower timeframes, to better view the price action of the 15m candle.
TOBYGBADE1: Dynamic Big Candle Pip RangeDisplays candle ranges in pips as a histogram in a separate pane, highlights big candles exceeding a dynamic threshold, and colors bars and labels green/red based on bullish or bearish direction.”
PDB 4 MA + Candle Strength/Weakness Detector
4MA Strength & Reversal Detector
Unlock the power of momentum with this advanced 4 Moving Average system (20, 50, 100, 200) designed to pinpoint market strength and early reversal zones with precision.
How It Works:
- Bearish Reversal: Triggered when all moving averages align (20 < 50 < 100 < 200) and bearish reversal candles appear — highlighting potential tops.
- Bullish Reversal: Triggered when all moving averages align (200 < 100 < 50 < 20) and bullish reversal candles form — marking potential bottoms
:Best For:
⚡ Scalpers and day traders using 1–5 minute timeframes
📈 Identifying momentum shifts and trend exhaustion early
Tip: Combine this with volume or RSI for stronger confirmation and fewer false signals.


