Cyatophilum Levels [BACKTEST]Cyatophilum Levels - Version 1.0 - Backtest
This indicator allows you to build your own strategy based on Fibonacci levels, and see the backtest results in the Strategy Tester.
The Fibonacci levels are printed automatically in real time and without repainting on the chart.
You configure your own strategy in the indicator parameters. You can choose to go long or to go short, or both, on which Fib levels to enter Long/Short, and on which Fib levels to exit (up to 2 entry levels and exit levels).
Detailed Guide:
This is a guide that can be useful if you do not understand the strategy or an indicator parameter. Instructions on how to get access are at the bottom.
To configure your strategy, you need to open the indicator settings. You can either right-click on the indicator and click "settings", or click the settings button near the indicator's name.
You should know that the Fibonnaci levels are calculated from the support and resistance levels, which are calculated using the last swing high and swing low. This behavior can be tweaked in the settings with the first 2 parameters:
· Noise reduction
Dropdown menu. Options are "NONE", "SMALL", "MEDIUM", "HUGE". Used to get a smoother level behavior. The higher it is, the less often the support and resistance levels will move. Can be useful to cut off fakeouts.
· Swings lookback
This is the number of historical bars used to calculate the last swing high and swing low.
In TradingView, we usually wait bar close to validate a signal (trade entry or exit), in order to avoid repainting. But since this indicator is purely based on price action, there is an option called Alert Type if you want to receive intra-bar alerts or not.
· Entry Alert Type
2 options : "Once Per Bar Close", "Once Per Bar". These correspond to the alerts options. You must use the same alert type in the indicator settings and in the alert options. When using "Once Per Bar", the candle high and low are used for the cross conditions, otherwise, candle close is used.
· Exit Alert Type
Same but for exit alerts.
The long trades setup can be configured independantly from the short trade setup, but the parameters are the same.
■ Go Long/Short
Check this box to enable/disable long/short trades.
· Long/Short Entry Condition
Dropdown menu from which you can pick the condition for your entry. Options available are "Cross Over","Cross Under" and "Just Cross".
· Long/Short Entry 1
Dropdown menu from which you can pick the level for your entry n°1. Options available are "Support","FIB 23", "FIB 38", "FIB 50","FIB 61","FIB 78" and "Resistance".
· Long/Short Entry 2
Additional FIB level entry.
· Long/Short Exit 1
Dropdown menu from which you can pick the level for your exit. Options available are "Support","FIB 23", "FIB 38", "FIB 50","FIB 61","FIB 78" and "Resistance".
· Long/Short Exit 2
Additional FIB level exit.
■ Trend Filter
Optionnal Tilson T3 TrendLine to make the strategy go long only when price is above T3 (green) and short only when price is below (red). The length in bars is configurable.
· Backtest period
The day of the start and end period of the backtest can be configured, as long as it is included in the available chart data which is around 20 000 candles. For example a 3 minutes chart data is around 41 days. (20000x3/60/24 = 41.3)
· Limit orders
By default the strategy tester uses market orders. With this option you can simulate limit orders with a limit price.
· Configuration Panel
It should appear on the left of the chart. This panel displays the whole indicator settings in a compact and easy-to-read way. You can replicate a strategy from just this info panel. Can be turned off if needed.
· Graphic options
A red/green background corresponding to the strategy position (short/long) can be turned off.
The Fib levels labels can be turned off all at once.
Backtesting Guide:
To open the backtest parameters, open the indicator settings and go to the "properties" tab.
The commission is set by to 0.1 % by default. You can change it to suit your exchange's fees.
Futures, Forex:
- The Order Size must be set to "contracts", or else you will get "no data".
Stocks, CFD, Cryptocurrency, Index:
- Both "% equity" and "contracts" can be used as Order Size.
Note: the net profit percentage is related to the initial capital set in the backtest properties.
Risk management
Place your secondary exit one or two levels above/below your entry to act as a stop loss.
Backtest Settings:
· Initial Capital: 10 000 $
· Order Size: 5 000 contracts
· Commission : 0.1€ per order (total commission paid: 20.00 €)
Oldest trade: 2019-10-01
Backtest Period: From 2019-10-01 to 2020-07-14
Default settings set for 15m.
Use the link below to obtain access to this indicator
Search in scripts for "candle"

positive percent(Lirshah)positive percent strategy is written based on percentage of positive candles.
so the buy signals trigger when the percentage reach an extreme and the similar scenario for sell signals.
the strategy has best results on 5 sec and 30 sec time frame and specially on indices SPX500, US30, DE30 and ...
the parameters are as below:
numbers of candles
take profit pips
stop loss pips.
the below overview is results of 1 contract on US30 index with 2$ commissions per order.
in order to access scripts contact me directly.

Twin Range Filter Algo@Colinmck used two different ranges to generate signals. Read his release notes to find out what the original script does.
I added one condition which seems to increase performance on 15m BTCUSD as well as 1h BTCUSD and that is ATR with 32 periods being smaller than ATR with 64 periods. I used my script Volatility Optimiser to discover this tendency.
Both buying and selling conditions are same as in @Colinmck's script plus one condition of my own. You can disable my condition.
Target and stop-loss are manually set values in ticks.
Time stop-loss is manually set value in a number of candles. After this number of candles, a position always exits (or should 😇). You can disable it by inserting a very long period. I do not recommend it, because a value of indicator should not be measured in luck and if market starts moving in the direction after 40 periods, the predictive capability of an indicator is questionable.
I used 300/150/17 for 15m BTCUSD chart and 900/30/17 for 1h BTCUSD. I didn't try to optimize any other parameters for these periods.
Since this script relies mostly on volatility for its prediction, I wouldn't recommend using it on its own. Individual approach to the market is recommended. Also, it didn't work on EURUSD when using the same default values and different order management (tp, sl, time sl), so it is probably not as versatile.
Let me know what do you think of this strategy. If you have some ideas about how to make it more reliable, share it in the comments, I might put it to the test. Good luck 🍀

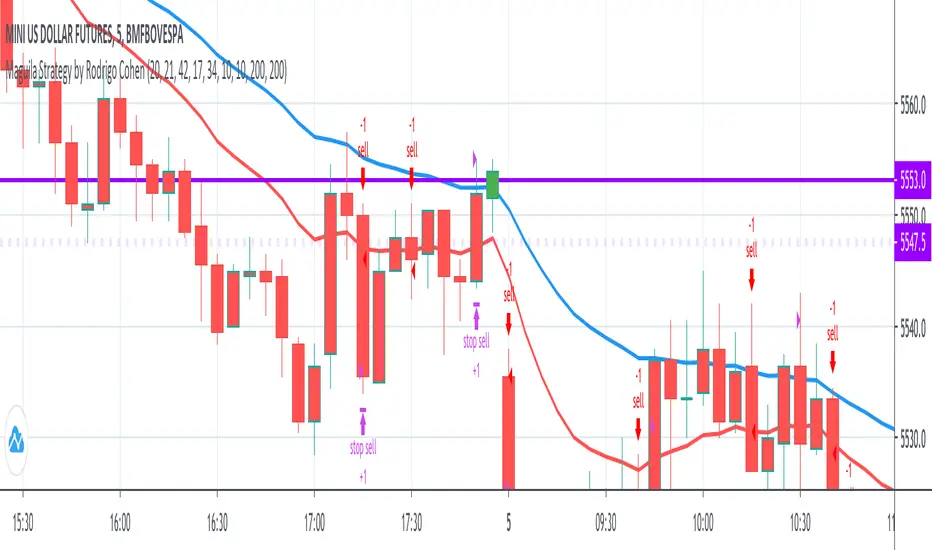
Maguila Strategy by Rodrigo CohenREAD BEFORE USE!!!
!!!ALERT!!!! THIS CODE ONLY WORKS WITH WDO AND WIN , BOTH WITH TIMEFRAMES 1 MINUTE AND 5 MINUTE.
This is a test to the Maguila strategy created by Rodrigo Cohen.
This code MUST be validaded by Rodrigo Cohen, use ONLY for tests.
Some results are different from Cohen's videos, so the McGuinley indicator needs some ajustments.
FUTURES: WIN , WDO
TIME FRAME: 1 Minute (also works in 5 minutes)
INDICATORS: McGinley Dynamic accompanied by the Exponential Moving Average coloring rule of 21 and 42 periods
MARKET TYPE: In trend (up or down)
INPUT:
1. When buying (long) = Market in an upward trend, the average of 21 crosses that of 42 upwards. When the price returns to the average of 21, wait for a positive candle in the Maguila's color and buy a break from the maximum of this signal candle.
2. On sale (short) = Downtrend market, the average of 21 crosses that of 42 downwards. When the price returns to the average of 21, wait for a negative candle in the Maguila's color and sell when the minimum of this signal candle breaks.
GAIN and LOSS are technical.
DEFAULT VALUES:
Averages:
- 1 minute - EMA 21 and EMA 42
- 5 minute - EMA 17 and EMA 34
Gains and Loss:
- WDO - 10 points
- WIN - 200 points
Cyato Grid Basic Buy & Sell [BACKTEST]Private indicator
This Grid bot strategy creates buy orders when the price goes down one level or more, and sell order when the price goes up one level or more.
To avoid useless trades, the lastest traded level is disabled until another level is crossed.
To create the grid, one upper level and one lower level is calculated. Those 2 levels are either given by the user using "MANUAL" mode or automatically calculated by an AI. The space between these two levels are then divided equally into several steps, creating the grid. The number of steps is chosen by the user, from 3 to 20.
HOW IT WORKS
This is the Backtest version meaning this is the one you should use with the Strategy Tester (more below).
Select either "MANUAL" or "AI" mode.
When using "MANUAL", you have to configure an upper level and a lower level.
When using "AI", the upper and lower level are automatically calculated from last 7 days high/low plus a 3% deviation. You can configure the timeframe and the deviation.
Select the grid quantity, from 3 to 20.
Example with 3:
Example with 10:
Example with 20:
You can choose between "Once Per Bar Close" or "Once Per Bar" alert type.
"Once Per Bar Close" will wait candle close to confirm a trade.
"Once Per Bar" will trigger a trade if the price crossed a step anytime inside a candle. Note that the backtest will still use bar close price in its calculation.
BACKTESTING
The strategy will buy 1 contract when a BUY signal appears and sell 1 contract when a SELL signal appears.
Here 1 contract = 1 BTC
The strategy can buy up to 20 contracts. Pyramiding is enabled.
The Backtest info panel is here to show how many trades are open in the backtest.
I know very well that a backtest has no value if several trades are left open. That is why I coded a feature to close all open trades at once on the last candle. This feature can be turned on and off.
To get this indicator, use the link in my signature below, thanks!

Scalping with Bill Williams AlligatorScalping strategy based on Bill Williams Alligator technique but calculated with heikin ashi candles.
This strategy has to be applied to standard candles and low time frames (1min to 5min)
Thanks to all pinescripters mentined in the code for their snippets.
It could be improved with stop loss based on ATR etc.
I have also a study with alerts.
Please use comment section for any feedback or contact me if you need support.

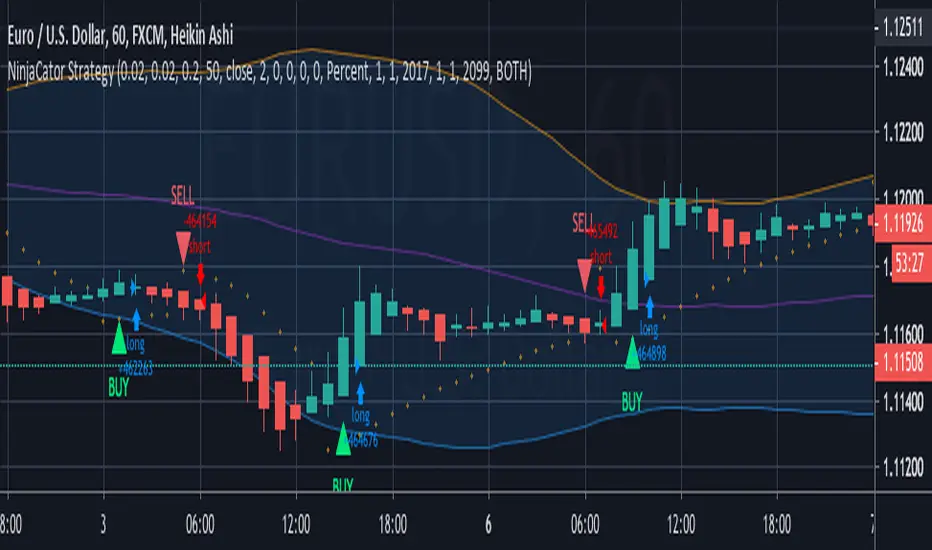
NinjaCator StrategyThis strategy is based on Heiken Ashi Price bars that have flipped on the Parabolic SAR. It is intended for backtesting purposes only and not offered as a trading system. The entry points are based on standard candle price entry values and not those offered by the HA candles.
It will show a BUY/SELL Alert for the First Flat Bottom/Top HK candle that has flipped on the PSAR.
Bollinger Bands have been added to enhance the potential Alerts when the price reaches extremes.
It is designed to provide a visual demonstration that selected indicators have met certain criteria and is NOT meant to be a trading system or offer trading advice. The indicator offers alert possibilities when the above criteria are met.
Noro's CrossLimitStrategy for altcoin/bitcoin currency pairs. Do not use for pairs of type coin/USD with this strategy. You need the taker fee to be zero, or ribate. Because this strategy has very frequent trades.
A simple moving average (SMA) is used to determine the trend.
If not enable Anti-Saw filter
- If candle closing price is higher than SMA - uptrend started
- If candle closing price is lower than SMA - downtrend started
If enable Anti-Saw Filter
- If low candles are higher than SMA - uptrend started
- If high candles are lower than SMA - downtrend started
Only limit orders are created at SMA price and towards the trend.

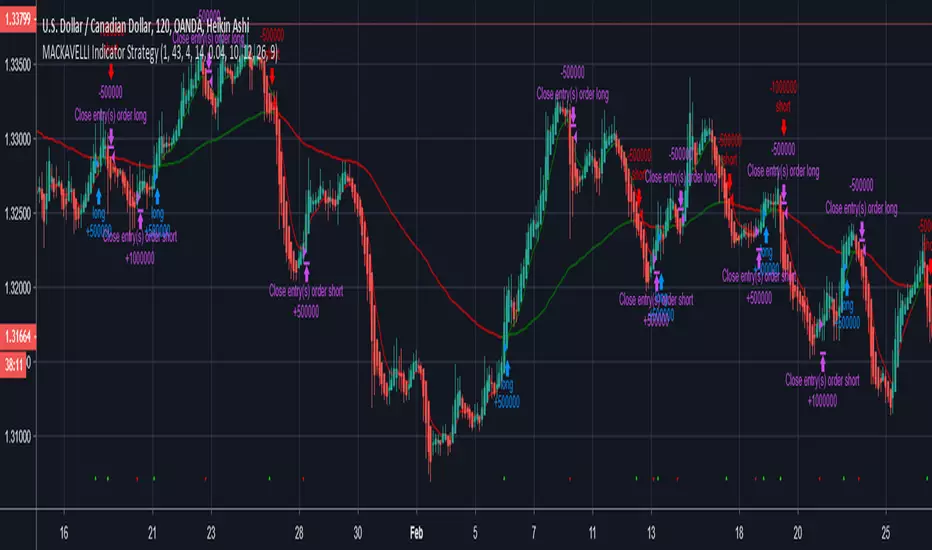
MACKAVELLI Algorithmic StrategyI had a hard time finding a strategy that would work in different time-frames and multiple different currency pairs. This is what I ended up with after countless hours of research and testing. I designed this strategy for auto-algorithmic trading and it uses three different indicators for Long/Short positions and a 4th indicator for exiting positions.
1) A green-light indicator that tells you whether or not you can go long/short.
2) A confirmation indicator that executes the long/short positions.
3) A chop indicator that measures the distance between the two MA's. When they're too close a trade will not be executed, as this usually indicates a chop zone.
4) A third MA is used as an exit indicator.
5) Finally, a loop function is designed to prevent repeat signals. Once a signal is produced on bar close it cannot happen again until that trade is closed or a new position is opened.
Be advised, you need to adjust the settings for each currency pair and time-frame. Once you do that, back-test it and count the last 100 trades to determine accurately your wins/losses. Long entries are the top of the previous bar, shorts are the bottom of the previous bar. This is a more accurate way of counting wins/losses. Tradingview back-test's are not accurate because of where they estimate your long/short entries are, it's very misleading.
Right now I have it setup for 2hr USDCAD with a back-test of 58% win rate on the last 100 trades.
The chop indicator is set to 0.04, I suggest starting there. 0.03 is the lowest I would go. You can go all the way up to 0.1 and higher if needed. You'll start missing big trades though.
The EMA for green-light signal is set to 10, a lower number will give you more entries but less accurate results, bigger number will give less entries with more accuracy but with missed opportunities. 10 is a good starting point.
This strategy is also designed so you can use tight stop losses to prevent large losses. This is because the strategy typically catches trends on the way up/down, minimizing risk for reversal.
I use Heikin Ashi candles for a smoother chart to work with. I have not tested this strategy with normal candles.
DEMO this strategy before using it live and make sure you back-test and tune it before you start. This is written in PINE V3 SO IT WILL NOT REPAINT.
MA cross strategyThis strategy uses simple moving average cross for entry signals, but it can be customized with 3 cases:
1- exit at take profit and stop loss;
2- exit when distance between close and moving average is above a user defined minimum;
3- use Renko candles to calculate the moving average without changing the graph candles.
The third case is the one with better results, but for non-pro users can be used only with daily time frame.
Look at profit factor and percent of winning trades.
You can test also on your favorite pair, but most important is setting correct brick size.
At request, I could share also a screener with alarms for finding which symbol statisfy entry rules.
Please use comment section for any feedback.
********************************** IMPORTANT*******************************
I have developed an expert advisor for metatrader4 (MT4): results of expert advisor form 2015-01-01 to today are very good with low drawdown and good profit.
********************************************************************************

Noro's Fishnet Strategy20 lines are JMA. Green color - a uptrend. Red color - a downtrend.
Color filter
If this checkbox is chosen, then long positions will be open only if a red candle. Short positions will open if a green candle.
If this checkbox is not chosen, then positions will open at change of a trend. Color of a candle will not matter.

Oscillator Based Scalping (Forex Majors)This is a scalping strategy based on oscillator divergences.
Tested on ForexICE market data.
Signal might appear and disappear during candle making since it is based on Moving Average and therefore acts on close, but since candle closed signal is final and does not repaint.
1M timeframes is recommended for bot trading. 5M-15M is more suitable for manual trading.
Full list of tested intraday timeframes below:
EUR-USD - 1M-5M-15M
USD-JPY - 1M-5M
GBP-USD - 1M
AUD-USD - 1M-5M-15M
USD-CHF - 1M-15M
NZD-USD - 1M-5M-15M
USD-CAD - 1M-5M
There is 2 more similar trading strategies that im finishing now, 1 for BITMEX ETHUSD and XBTUSD contracts, and 1 for bitmex alts. Should be ready in a day or two.
Additional notes on executing trades:
-Trade should be entered as close to sell signal as possible. You can enter at market at red circle candle or at limit at top of sell signal candle. In both cases your target is red Moving Average and entering at market just makes overall R/R for a trade is lower yet limit order might not always get filled.
-This strategy doesnt have a defined stop loss by itself, but your target is a moving average and 1-1 risk reward should be enough. Although the win rate is much higher than 50% so you can be less greedy if you feel like playing it safer.
-Strategy itself uses pyramiding, so i would recommend averaging up if you get 2-3 consecutive sell signals above moving average.
-It is assumed that you have OANDA spread rates or better.
-- Free trial for 24 hours. Contact me here or at twitter.com --

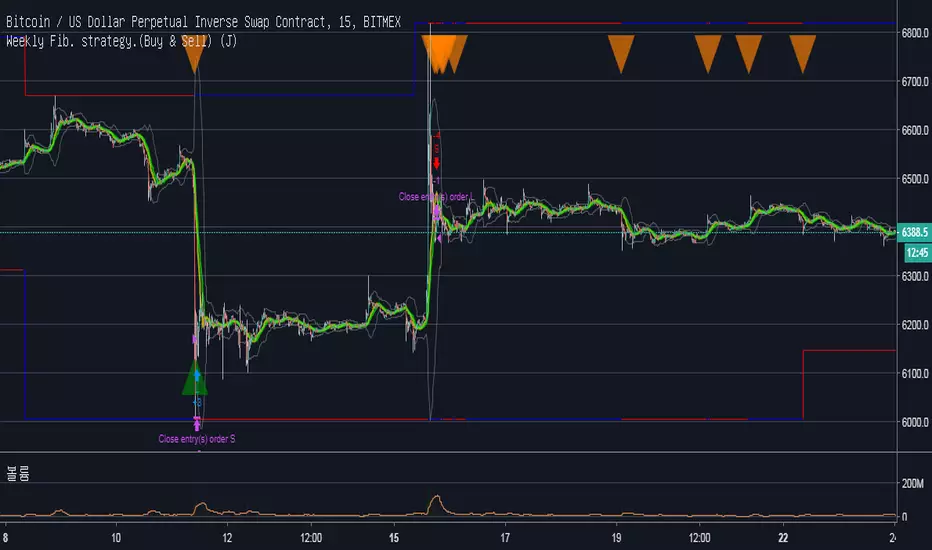
Weekly Fib. strategy.(Buy & Sell) (J)Description :
Fibonacci Retracements are used to estimate likely reversal points during an up- or down-trend. Percentage retracement levels, based on significant Fibonacci numbers, are plotted as horizontal lines against the latest trend move.
1. Blue and Red Line : The highest and lowest peak of candles.
Blue line and Red line changes colors according to the position of candles above or below the 0.5 Fibonacci Retracements line.
2. Yellow Line : 0.5 Fibonacci Retracements line.
3. Green Line : BB Basis line.
Reference of Fibonacci Retracements :
www.incrediblecharts.com
LevelTradeV2.0. Trend indikator with supp. and res. levelsThis indicator is designed to work on short-term and long-term periods. It provides levels of resistance and support for the two options.
1) purple levels - minimum and maximum price for the shadows of candles.
2) red and green levels - over the body of a candle.
added a moving average and a profit calculator fully customizable.

EMA50Diff & MACD StrategyOne of my attempts to create a strategy for BTC.
Its a combination of EMA50Diff (the difference between spot and EMA50) and MACD.
Buy signal if (EMA50Diff) < -(EMADiffThreshold),
(MACD bearish crossunder),
(MACD) < -(MACDThreshold),
(EMA50Diff) > (EMA50Diff 1 candle ago),
(EMA50Diff 1 candle ago) < (EMA50Diff 2 candles ago)
Sell signal if (EMA50Diff) > (EMADiffThreshold),
(MACD bullish crossover),
(MACD) > (MACDThreshold),
(EMA50Diff) < (EMA50Diff 1 candle ago),
(EMA50Diff 1 candle ago) > (EMA50Diff 2 candles ago)
Exit either when target or stoploss get reached.
Initial capital is set to 100k and its currently going all-in on every trade but im looking for a better way to handle position sizes already..
Also i included slippage of 30 ticks and exchange commission of 0.15% (e.g. 2x BitMEX market taker fee)
Works best on 15m on bitfinex, bitstamp and gdax and i'm still trying to optimize it for bitmex too, will update when i got there..
profit_trailer_basktesting_v3I rewrite the code of v2.
There are some differences between v2:
1. PT 2.0 support multi-strategy up to 5. => the script have A...E buy inputs.
Not support new strategies now, I'm not sure how they work in PT 2.0, I will add them if the wiki complete.
you may find the options in setting, but they are placeholders.
I will not add the indicators for RSI, MACD, and STOCH RSI, please use the built-in indicator in Tradingview. There is no way to change overlay state of a script in pine script as I know or you can pm me if you know about it.
2. Trailing is disabled now.
I have no idea how it works in multi-strategy, I will enable it if the PT 2.0 release.
3. Now you can set indicator period in the setting, the unit of it is minute different from PT itself.
the entry price of orders still depending on your chart resolution, so I recommend you set the chart resolution same as the main strategy you want.
Like SOM trigger in V2, there is data range limit depend on the resolution you choose.
4. DCA is rewriting now.
And I will release an Anderson only version if I have time to complete it.
5. Add rebuy timer and stop loss timer. the value of it is candles. it will look back N candles on the chart.
Feel free to donate if you think my scripts are useful.
BTC:17eguEeVVnLmYK9iDKQNxBQmKWNENH4bGj
ETH:0xb172BBc4CDAB7F334243A312A46FB8492674A914
BCH:qpy0zulq9s4pcqu3hd2m8h8h7tfm83jz7qle0690c4
Noro's Hundred Strategy v1.0Strategy uses:
1) Fast RSI (period = 7 bars)
2) Color of bars
Strategy
If RSI less than 30 is also 4 red candles in a row - to open long-position
If RSI more than 70 is also 4 green candles in a row - to open short-position
If long-position is open and there is 1 green candle - to close a position
If short-position is open and there is 1 red candle - to close a position
Only profit
Very dangerous thing! Strategy will close a position only if a position profitable. Most likely you will lose all money if you use this function.

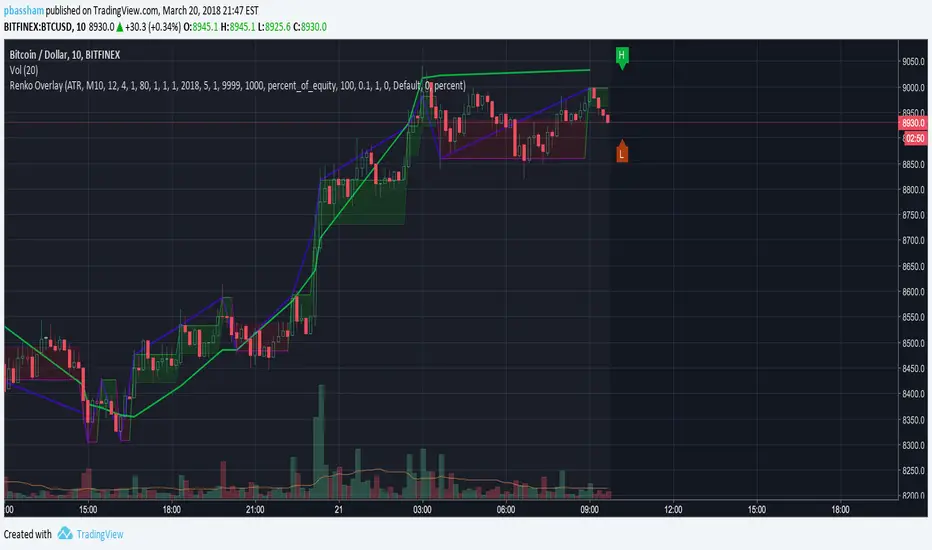
Renko Strategy Overlay for moving averages back testingThis puts a Renko overlay on the main chart, and then plots moving average lines on the overlaid Renko Candles instead of the regular candles. This allows for accurate backtesting of Renko strategies.
ICM_editionThe Bot is best suited to be used with 30m charts and Heikin Ashi Candlesticks, although if you aren’t proficient in trading, I suggest the use of 4H candles stick to filter out weak signals. Use of other indicators to further validate the calls is always recommended.

Noro's Locomotive Strategy v1.0Very simple strategy
For:
- crypto
- timeframes: 1m, 5m, 15m, 30m, 1hour
It is recommended:
- piramiding
- 0% commission
- "bitcoin"
Strategy
If there are 4 red candles in a row - to open long
If there is 1 green candle and Long is open - to close long
If there are 4 green candles in a row - to open short
If there is 1 red candle and is open shorts - to close short

Noro's Primitive Strategy v1.0It is calculated what long a candle body
Average length of a body of a candle, for the last 30 candles is calculated
If the candle red and a body of a candle is more average / 2 - to open long (and to close short)
If long is open, a body of a candle is more average / 2, the candle green and a position is profitable - to close long
If the candle green and a body of a candle is more average / 2 - to open short (and to close long)
If it is open short, a body of a candle is more average / 2, the candle red and a position is profitable - to close short

Noro's ColorBar Strategy v1.0It is calculated what long a candle body
Average length of a body of a candle, for the last 30 candles is calculated
If the candle red and a body of a candle is more average - to open long (and to close short)
If long is open, the candle green and a position is profitable - to close long
If the candle green and a body of a candle is more average - to open short (and to close long)
If it is open short, the candle red and a position is profitable - to close short

MFI HAThis strategy is based on a combination of MFI and HA Candles.
Instructions:
1. To use this indicator, simply add it to your favorites.
2. Use on regular candles for trading with real data.
3. Adjust timeframes for both MFI and HA to see different results.
4. It should not repaint (it is version 3) as long as you use lower timeframes in the inputs than you're looking at on the chart (for example, if you're on the 15 minute chart, only use 15 min or smaller time frame in inputs to avoid repaint).
5. Enjoy
6. Let me know what you think in the comments.
