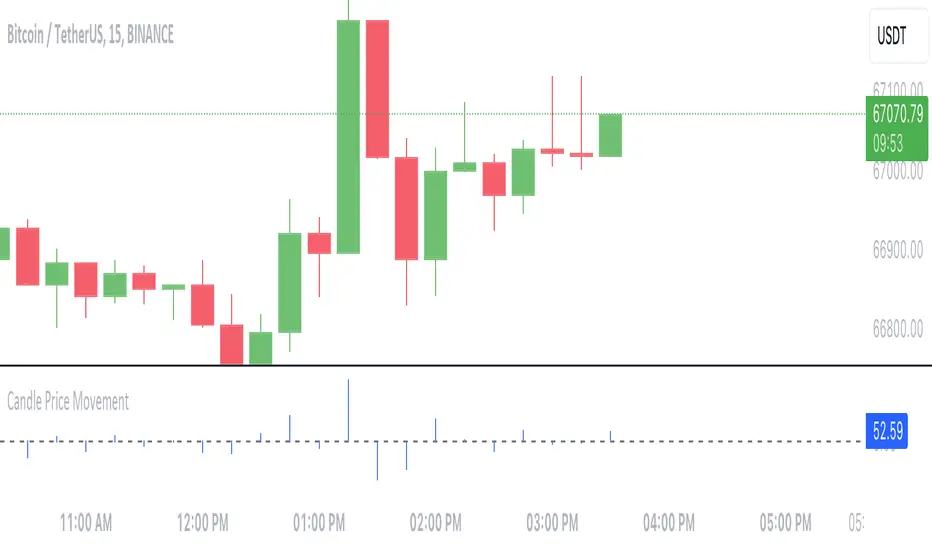
Candles HTF on Heikin Ashi ChartThis script enables calling and/or plotting of traditional Candles sources while loaded on Heikin Ashi charts.
Thanks to @PineCoders for rounding method: www.pinecoders.com
Thanks to @BeeHolder for method to regex normalize syminfo.tickerid.
NOTICE: While this script is meant to be utilized on Heikin Ashi charts it does NOT enable ability to backtest!
NOTICE: For more info on why non standard charts cannot be reliably backtested please see:
NOTICE: This is an example script and not meant to be used as an actual strategy. By using this script or any portion thereof, you acknowledge that you have read and understood that this is for research purposes only and I am not responsible for any financial losses you may incur by using this script!
Search in scripts for "candle"
Candlestick Patterns + windows Mod by BoernererMy modifications for the candlestick pattern script by Robert Waddell.
Changelog
- Added window (= gaps) detection
- Added Bear/Bull Sash
- Modified candlestick ID code
- Candlesticks will only be displayed if above or below TLine
Originally created by Robert Waddell with special thanks to repo32 for his candlestick ID code, DavidR for EMA code and Chris Moody for barcolor code.
Enjoy and would love if you improve it further!
Candle Range CompareThis one compares the total candle height (Low to High), body size, also top and bottom wick sizes. I really don't know when it would be best to use this, but it gives a 0 baseline to compare candles side-by-side also to compare body size to wick size.
*Notes*
- The tallest of course is high minus low
- whether or not the close is above the open, the body size is the column in front of the total size of course
- wicks are from 0 up for the top wick and 0 down for the bottom wick.
Candlestick MathThis is an updated version of my previous post, with the option to specify which symbol you want it to show up on.
This is a script I made to do what is called candlestick math (if you're not sure, Google it). It will take the first open, the last close, and the highest high and lowest low from a range of candlesticks, and plot it on top of the chart.
Unfortunately, there is no way to make it so you can move it with your mouse, and the bar numbering is not the same as the regular drawing tools, so to figure out what the line number is, create a new script with the text:
study("Plot N")
plot(n)
This will create another chart that will show you the bar numbers that correspond to the script's bar numbers. From there, figure out where you want to start the candlestick math, and enter that number in the "Start" field in the inputs for this script.
Candlestick Math(Re-post with better graph)
This is a script I made to do what is called candlestick math (if you're not sure, Google it). It will take the first open, the last close, and the highest high and lowest low from a range of candlesticks, and plot it on top of the chart.
Unfortunately, there is no way to make it so you can move it with your mouse, and the bar numbering is not the same as the regular drawing tools, so to figure out what the line number is, create a new script with the text:
study("Plot N")
plot(n)
This will create another chart that will show you the bar numbers that correspond to the script's bar numbers. From there, figure out where you want to start the candlestick math, and enter that number in the "Start" field in the inputs for this script.
Candlestick MathThis is a script I made to do what is called candlestick math (if you're not sure, Google it). It will take the first open, the last close, and the highest high and lowest low from a range of candlesticks, and plot it on top of the chart.
Unfortunately, there is no way to make it so you can move it with your mouse, and the bar numbering is not the same as the regular drawing tools, so to figure out what the line number is, create a new script with the text:
study("Plot N")
plot(n)
This will create another chart that will show you the bar numbers that correspond to the script's bar numbers. From there, figure out where you want to start the candlestick math, and enter that number in the "Start" field in the inputs for this script.
Candle 2 Closure📌 Indicator Presentation – Candle 2 Closure
" Candle 2 Closure "s is an indicator designed to identify three types of price–action-based signals in real time: Long, Short, and Generic.
The goal is to visually highlight moments when the market breaks a key level of the previous candle but rejects that break, closing on the opposite side.
The idea was inspired by the study of pure price action and specifically by the following video:
👉 www.youtube.com
🎯 How the Indicator Works
The indicator generates signals on bar close (barstate.isconfirmed), making them reliable and free from repainting.
🔵 LONG Signal
A long signal is triggered when:
The current candle breaks the low of the previous candle
But then closes back above that low
→ This is often a sign of a bear trap or a liquidity rejection to the downside.
🔴 SHORT Signal
A short signal is triggered when:
The current candle breaks the high of the previous candle
But then closes back below that high
→ This may indicate a bull trap or a liquidity rejection to the upside.
⚪ GENERIC Signal
A generic signal is triggered when:
A high or low is broken,
But neither the long nor short conditions are met,
Resulting in a simple unconfirmed break.
📍 Operational Advantages
Highlights liquidity absorption zones
Works on all timeframes (1m → 1D)
Useful for scalping, intraday, or swing trading
Clear and immediate visual signals on the chart
Zero repainting
✨ Visual Style
LONG displayed below the candle, white color
SHORT displayed above the candle, white color
Generic signal shown with a neutral label
Candle PA Scanner (Engulfing / Inside / Pin) by BK SahniHere’s how to read the “Candle PA Scanner (Engulfing / Inside / Pin)” and what each input means.
What the signals look like on your chart
B-ENG (label above/below bar)
Bullish Engulfing → “B-ENG” below the bar (green/teal).
Bearish Engulfing → “B-ENG” above the bar (red).
IB (small orange dot at the top)
Inside Bar (compression). Use the mother bar’s high/low for the break.
PIN (triangle)
Bullish Pin → triangle below the bar (long lower wick; rejection of support).
Bearish Pin → triangle above the bar (long upper wick; rejection of resistance).
Treat these as price-action alerts, not automatic buy/sell signals. Act only when they occur at your levels (VWAP band, Fib 38.2–61.8, PDH/PDL, OB/FVG, etc.).
How to trade the prints (quick rules)
A) Bullish Engulfing at support
Context: at VWAP/VAL/0.5–0.618 Fib.
Entry: next candle above the engulfing high (or market order on close if volume/momentum confirm).
Stop: a tick below the engulfing low (or below the level).
Targets: mid/range, VWAP, prior swing; trail with Chandelier/ATR if trend extends.
B) Bearish Engulfing at resistance
Mirror the above: trigger below the engulfing low; stop above its high.
C) Inside Bar
It’s compression. Mark the mother bar’s high/low.
Trade the breakout in the direction of bias (above VWAP for longs, below for shorts).
If the break fails (closes back inside), often sets up a reversal—manage fast.
D) Pin Bar (rejection)
Enter on break of the pin’s body in the direction away from the wick.
Stop beyond the wick tip (invalidated if wick gets closed through).
Scale at VWAP/mid or the opposite range edge.
What the Inputs do (the panel you showed)
Inside Bar lookback (default 1)
How many bars back can be the mother bar.
Keep 1 for strict IB; raise to 2–3 to catch nested/compression patterns (more signals, a bit noisier).
Pin wick:body min ratio (default 2)
How long the rejection wick must be compared to the body.
Higher (2.5–3.0) = pickier, great in chop.
Lower (1.5–1.8) = more pins, useful in strong trends where wicks are shorter.
Min body % of range (0–1) (default 0.25)
Filters out dojis. The body must be at least 25% of the bar’s high-low range.
If you want to allow slimmer bodies (more pins/dojis), drop to 0.15–0.20.
If you want only decisive bodies, raise to 0.30–0.35.
Suggested tuning by market state
Trending / high momentum:
IB lookback 1, Pin ratio 1.8–2.2, Min body 0.20–0.25 (to catch more continuation entries).
Ranging / choppy:
IB lookback 2, Pin ratio 2.5–3.0, Min body 0.30 (fewer, higher-quality reversals).
A simple confluence checklist (use before clicking)
Signal printed at a level (VWAP band, Fib, PDH/PDL, OB/FVG)?
Bias aligned (above VWAP for longs, below for shorts) or you’re intentionally fading a range edge?
For engulfing: did it close through nearby minor structure?
For IB: are you trading the mother bar break, not just the small inside candle?
Risk defined: stop beyond wick/zone, target mapped (mid/VWAP/swing/extension).
Common pitfalls
Taking signals mid-range (low R:R).
Treating an IB as a reversal without a break/shift.
Buying a bullish pin that closed below your level (no acceptance).
Ignoring volatility—during news spikes, patterns fail more often.
Candle Emotion Oscillator [CEO]Candle Emotion Oscillator (CEO) - Revolutionary User Guide
🧠 World's First Market Psychology Oscillator
The Candle Emotion Oscillator (CEO) is a groundbreaking indicator that measures market emotions through pure candle price action analysis. This is the first oscillator ever created that translates candle patterns into psychological states, giving you unprecedented insight into market sentiment.
🚀 Revolutionary Concept
What Makes CEO Unique
100% Pure Price Action: No volume, no external data - just candle analysis
Market Psychology: Measures actual emotions: Fear, Greed, Panic, Euphoria
Never Been Done Before: First oscillator to analyze market emotions
Exhaustion Prediction: Detects emotional fatigue before reversals
Fast Response: Perfect for your 2-5 minute scalping setup
The Four Core Emotions
🟢 GREED (Positive Values)
What it measures: Market conviction and decisiveness
Candle Pattern: Large bodies, small wicks
Psychology: Traders are confident and decisive
Oscillator: Positive values (0 to +100)
Trading Implication: Trend continuation likely
🔴 FEAR (Negative Values)
What it measures: Market uncertainty and indecision
Candle Pattern: Small bodies, large wicks
Psychology: Traders are uncertain and hesitant
Oscillator: Negative values (0 to -100)
Trading Implication: Consolidation or reversal likely
🚀 EUPHORIA (Extreme Positive)
What it measures: Excessive optimism and buying pressure
Candle Pattern: Large green bodies with upper wicks
Psychology: Extreme bullish sentiment
Oscillator: Values above +60
Trading Implication: Overbought, reversal warning
💥 PANIC (Extreme Negative)
What it measures: Capitulation and selling pressure
Candle Pattern: Large red bodies with lower wicks
Psychology: Extreme bearish sentiment
Oscillator: Values below -60
Trading Implication: Oversold, reversal opportunity
📊 Visual Elements Explained
Main Components
Thick Colored Line: Primary emotion oscillator
Green: Greed (positive emotions)
Red: Fear (negative emotions)
Bright Green: Euphoria (extreme positive)
Dark Red: Panic (extreme negative)
Thin Blue Line: Emotion trend (longer-term context)
Background Gradient: Emotional intensity
Darker = stronger emotions
Lighter = weaker emotions
Diamond Signals: 🔶 Emotional exhaustion detected
Rocket Signals: 🚀 Extreme euphoria warning
Explosion Signals: 💥 Extreme panic warning
Information Table (Top Right)
Candle Rating (1–5)This “Candle Rating (1–5)” indicator measures where each bar’s close sits within its own high-low range and assigns a simple strength score:
Range Calculation
It computes the candle’s total range (high − low) and finds the close’s position as a percentage of that range (0 = close at low, 1 = close at high).
Five-Point Rating
1 (Strong Buy): Close in the top 20% of the range
2 (Moderate Buy): 60–80%
3 (Neutral): 40–60%
4 (Moderate Sell): 20–40%
5 (Strong Sell): Bottom 20%
Visual Feedback
It plots the numeric rating above each bar (colored green → red), giving you an at-a-glance read of candle momentum and potential reversal strength across any timeframe.
Candle VolumeThis indicator gives gives candle volume represented in X.Y format for simplicity.
100% = 1.0
20% = 0.2
Anything 10X is represented by an arrow up or down based on candle price delta open to close.
By default, a 500 candle lookback of volume is used excluding exteem outliers of 50.
You can adjust these in settings.
Candle Flip System - CFSCandle Flip System - CFS
The Candle Flip System checklist table is a tool designed for traders seeking a structured approach to decision-making. This indicator provides a visual checklist to validate critical conditions before entering a trade. It includes:
1. Previous D1 Candle Analysis:
Displays whether the previous daily candle closed bullish or bearish, indicated by intuitive markers.
2. 4-Hour Alignment Check:
Confirms if the bias of the previous 4-hour candle aligns with the previous daily candle's bias.
Outputs "YES" in green for alignment or "NO" in red for misalignment.
This indicator simplifies multi-timeframe analysis and ensures a systematic evaluation of key trading conditions, enabling traders to make more confident and disciplined decisions.
How to Use:
1. Apply the indicator to your chart.
2. Observe the table displayed in the top-right corner.
3. Use the information to validate your trading strategy before entering a trade.
Candle Closing Strength Indicator (CCS)This indicator measures and displays the closing strength of each candle relative to its range.
It assigns a value from 0 to 100, where
- 0 indicates a close at the candle's low,
- 100 indicates a close at the high, and
- 50 represents a close at the midpoint.
The strength is shown as a number on each candle, color-coded green for values 50 and above (bullish) and red for values below 50 (bearish). This visual representation helps traders quickly assess the strength and direction of price movements across different timeframes.
This is only the price action strength. Further strength can be verified with volume.
Candles Pattens (v. 1.14)This script sows you candlestick patterns in real-time.
At that moment script knows Bearish/Bullish Engulf and Doji Points.
You can recommend me which pattens you want to see in next version at comment section below
Candlestick Patterns Identified (updated 3/11/15)I decided to republish this one without the trend filter and with all the major symbols active. This will allow for all the patterns to show up.
Due to 15 different candlestick formations in this one script, it will be difficult to turn off the last few due to screen size. You can turn off individual patterns on the settings screen.
I have everything spelled out except the hammer and inverted hammer. They are "H" and "IH" respectively on the charts. They show up so often that they cluttered the charts.
The default script has: Doji, Evening Star, Morning Star, Shooting Star, Hammer, Inverted Hammer, Bearish Harami, Bullish Harami, Bearish Engulfing, Bullish Engulfing, Piercing Line, Bullish Belt, Bullish Kicker, Bearish Kicker, Hanging man, and Dark Cloud Cover. You can turn off what you don't like. The Piercing Line, Bullish Belt, and the Kickers will usually show up better in the daily charts.
I recommend watching videos with Stephen Bigalow to get a feel for how to trade these. You will want to add an 8 EMA to your chart with his setups. Enjoy.
If you want the old version: Take a look at the related ideas below.
Candle Body RatioThis indicator is designed to calculate the percentage of the upper wick, the body, and the lower wick of the candle over which your cursor is positioned.
Candle Eraser (New York Time, Dropdown)If you want to focus on first 3 hours of Asia, London> and New York, inspired by Stacey Burke Trading 12 Candle Window Concept
- Set your time to UTC-4 New York
Candle Patterns StrategyThe script allows you to test popular candlestick patterns on various instruments and timeframes. In addition, you can configure risk management (if the value is zero, it means the function is disabled), and you can also specify the time of the trading session (for example, so that the positions are not transferred to the next day).
The author is grateful to JayRogers and Phi35, their code examples helped a lot in writing the strategy.
Candlestick Patterns by Boernerer v2New version 2 of my modifications of the original candlestick pattern script by Robert Waddell.
- Added window (= gaps) detection
- Added Bear/Bull Sash
- Added Bear/Bull Counter Attack
- Added Bear/Bull Seperating Line
- Modified candlestick ID code
- Added Lookback period instead of SMA (TLine) for trend detection


