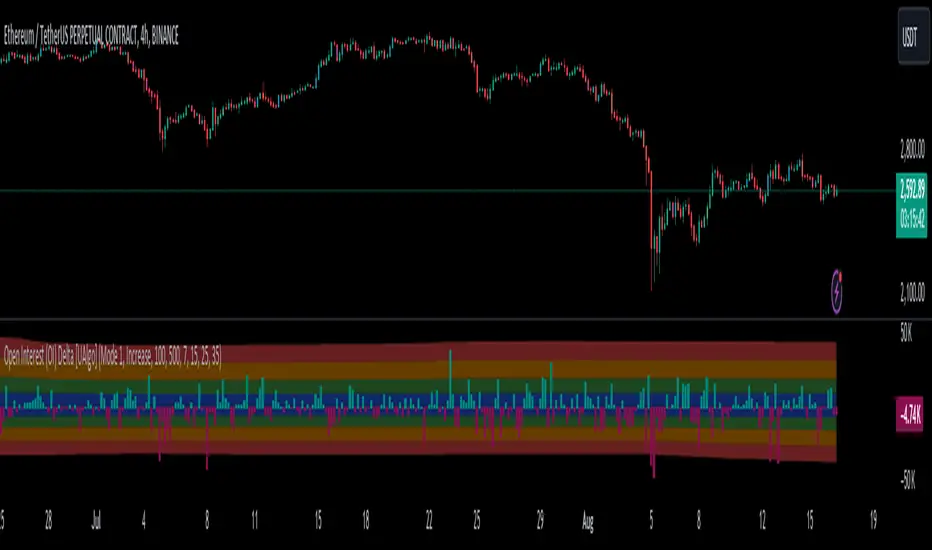
Open Interest (OI) Delta [UAlgo]The Open Interest (OI) Delta indicator is a tool designed to provide insights into the dynamics of Open Interest changes within the futures market. Open Interest (OI) refers to the total number of outstanding derivative contracts, such as options or futures, that have not been settled. The OI Delta measures the change in Open Interest over a specified period, allowing traders to assess whether new money is entering the market or existing positions are being closed.
This indicator offers two distinct display modes to visualize OI Delta, along with customizable levels that help in categorizing the magnitude of OI changes. Additionally, it provides the option to color-code the bars on the price chart based on the intensity and direction of OI Delta, making it easier for traders to interpret market sentiment and potential future price movements.
🔶 Key Features
Two Display Modes: Choose between two different modes for visualizing OI Delta, depending on your analysis preferences:
Mode 1: Displays the OI Delta directly as positive or negative values.
Mode 2: Separates positive and negative OI Delta values, displaying them as absolute values for easier comparison.
Customizable Levels: Set up to four levels of OI Delta magnitude, each with customizable thresholds and colors. These levels help categorize the OI changes into Normal, Medium, Large, and Extreme ranges, allowing for a more nuanced interpretation of market activity.
MA Length and Standard Deviation Period: Adjust the moving average length and standard deviation period for OI Delta, which smooths out the data and helps in identifying significant deviations from the norm.
Color-Coded Bar Chart: Optionally color the price bars on your chart based on the OI Delta levels, helping to visually correlate price action with changes in Open Interest.
Heatmap Display: Toggle the display of OI Delta levels on the chart, with the option to fill the areas between these levels for a more visually intuitive understanding of the data.
🔶 Interpreting Indicator
Positive vs. Negative OI Delta:
A positive OI Delta indicates that the Open Interest is increasing, suggesting that new contracts are being created, which could imply fresh capital entering the market.
A negative OI Delta suggests that Open Interest is decreasing, indicating that contracts are being closed out or settled, which might reflect profit-taking or a reduction in market interest.
Magnitude Levels:
Level 1 (Normal OI Δ): Represents typical, less significant changes in OI. If the OI Delta stays within this range, it may indicate routine market activity without any substantial shift in sentiment.
Level 2 (Medium OI Δ): Reflects a more significant change in OI, suggesting increased market interest and possibly the beginning of a new trend or phase of market participation.
Level 3 (Large OI Δ): Indicates a strong change in OI, often associated with a decisive move in the market. This could signify strong conviction among market participants, either bullish or bearish.
Level 4 (Extreme OI Δ): The highest level of OI change, often preceding major market moves. Extreme OI Δ can be a signal of potential market reversals or the final phase of a strong trend.
Color-Coded Bars:
When enabled, the color of the price bars will reflect the magnitude and direction of the OI Delta. This visual aid helps in quickly assessing the correlation between price movements and changes in market sentiment as indicated by OI.
This indicator is particularly useful for futures traders looking to gauge the strength and direction of market sentiment by analyzing changes in Open Interest. By combining this with price action, traders can gain a deeper understanding of market dynamics and make more informed trading decisions
🔶 Disclaimer
Use with Caution: This indicator is provided for educational and informational purposes only and should not be considered as financial advice. Users should exercise caution and perform their own analysis before making trading decisions based on the indicator's signals.
Not Financial Advice: The information provided by this indicator does not constitute financial advice, and the creator (UAlgo) shall not be held responsible for any trading losses incurred as a result of using this indicator.
Backtesting Recommended: Traders are encouraged to backtest the indicator thoroughly on historical data before using it in live trading to assess its performance and suitability for their trading strategies.
Risk Management: Trading involves inherent risks, and users should implement proper risk management strategies, including but not limited to stop-loss orders and position sizing, to mitigate potential losses.
No Guarantees: The accuracy and reliability of the indicator's signals cannot be guaranteed, as they are based on historical price data and past performance may not be indicative of future results.
Search in scripts for "change"
Internal/External Market Structure [UAlgo]The "Internal/External Market Structure " indicator is a tool designed to identify and visualize internal and external market structure based on swing highs and lows. It helps traders understand short-term (internal) and long-term (external) price behavior.
🔶 What are ChoCH and BoS?
Change of Character (ChoCH)
Change of character refers to the reversal of market trend either from bullish to bearish or bearish to bullish. ChoCH is also a break of market structure but in opposite direction.
If market is in bullish trend but it breaks it previous (higher) low and makes a lower low, it will be termed a “bearish change of character” as price changed its trend from bullish to bearish.
Like wise if price is in bearish trend and it breaks its previous (lower) high making a higher high it will be marked as “bullish change of character” as price changed its trend from bearish to bullish.
Break of Structure (BoS)
When price breaks its structure in direction of previous trend its called break of structure (BoS). So its a trend continuation pattern.
As you know in bullish trend price makes higher highs. Each time when price break a previous high and marks a new high its known as bullish break of structure.
But in bearish trend price makes lower lows so every time when price breaks previous low and makes a new low it is called as bearish break of structure.
🔶 Key Features
Internal Swing Length: Allowing for fine-tuning of sensitivity to smaller, more frequent market movements.
External Swing Length: Focusing on capturing broader market trends.
The indicator differentiates between internal and external market structures, using different styles and colors to represent each. Internal structures are shown with solid lines, while external structures use dashed lines, providing clear visual cues.
Internal Market Structure:
The internal market structure focuses on shorter-term swings and is useful for identifying minor trend changes and short-term price movements. Breaks of internal swing highs or lows can indicate potential changes in the market's direction or momentum. The labels "CHoCH" and "BoS" help distinguish between changes in character and break of structure events, respectively.
External Market Structure:
The external market structure captures larger, more significant market moves. It is particularly useful for identifying major trend changes and key support and resistance levels. The dashed lines and corresponding labels "CHoCH+" and "BoS+" indicate more substantial shifts in market sentiment.
For BoS (Break of Structure):
For ChoCH (Change of Character):
🔶 Disclaimer
Use with Caution: This indicator is provided for educational and informational purposes only and should not be considered as financial advice. Users should exercise caution and perform their own analysis before making trading decisions based on the indicator's signals.
Not Financial Advice: The information provided by this indicator does not constitute financial advice, and the creator (UAlgo) shall not be held responsible for any trading losses incurred as a result of using this indicator.
Backtesting Recommended: Traders are encouraged to backtest the indicator thoroughly on historical data before using it in live trading to assess its performance and suitability for their trading strategies.
Risk Management: Trading involves inherent risks, and users should implement proper risk management strategies, including but not limited to stop-loss orders and position sizing, to mitigate potential losses.
No Guarantees: The accuracy and reliability of the indicator's signals cannot be guaranteed, as they are based on historical price data and past performance may not be indicative of future results.

Consistent ATR Trailing Stop (ATR, 1m based) [nn1]This indicator implements a Consistent ATR (Average True Range) Trailing Stop that maintains uniform behavior across various chart timeframes. It's designed to provide traders with a reliable tool for setting dynamic stop-loss levels that adapt to market volatility while remaining consistent regardless of the chosen chart interval.
Key Features:
1. Consistent ATR Calculation: The indicator calculates the ATR based on 1-minute data, regardless of the current chart timeframe. This ensures that the ATR value remains consistent across different intervals (e.g., 10s, 15s, 30s, 60s), providing a stable base for the trailing stop.
2. Dynamic Trailing Stop: The trailing stop adjusts based on the ATR, moving up in uptrends and down in downtrends to protect profits while allowing room for price fluctuations.
3. Trend Detection: The indicator determines the trend based on the price's relationship to the trailing stop, switching between long and short modes as the trend changes.
4. Visual Cues: The trailing stop line changes color to indicate the current trend (green for uptrends, red for downtrends) and briefly turns yellow during trend changes. Small circles below or above the price action further highlight the current trend direction.
5. Information Display: A label shows the current ATR value and trend direction, providing at-a-glance information to the trader.
6. Trend Change Highlights: The background briefly changes color when a trend change occurs, drawing attention to potential trading opportunities or exit points.
Usage:
- ATR Length: Set the number of periods for the ATR calculation. This is based on 1-minute data, so a value of 14 represents 14 minutes of data.
- ATR Multiplier: Adjust how far the trailing stop is placed from the price. Higher values create a wider stop, allowing for more price movement before triggering.
This indicator is particularly useful for traders who:
- Use multiple timeframes in their analysis and want consistent signals across charts.
- Seek a dynamic stop-loss method that adapts to market volatility.
- Want clear visual cues for trend direction and changes.
By providing a consistent ATR-based trailing stop across different timeframes, this indicator helps traders maintain a unified approach to their trading strategy, regardless of the chart interval they are viewing.

Qu_Trend+
composition
- Consists of a thick trend line and a thin yellow line.
- The largest (green/red) lines indicate rising and falling markets.
- This line represents the 13-candle moving average of Tilson T3.
- The reason for 13 candles is because it best matches the recent market price based on Bitcoin.
- This value cannot be changed, so if you need it, please modify the public code and use it.
- The yellow line is the MA20 line, the ‘Bollinger Band center line’
(UI will show whether this line has been breakout)
- The same algorithm as 20 of the basic moving average (close standard) is applied.
- The algorithm for breakthrough is calculated based on real-time prices, not based on closing prices.
An additional short-term SMA is created, and whether it crosses the SMA is classified as a breakout/resistance.
How to use it
- If the trend line becomes gentle, it may indicate a change in trend when + MA20 is broken.
- While the slope of the trend line is steep, it indicates that the trend is difficult to change.
(If the trend changes at this time, it is likely to move sideways)
- If the trend changes continuously, it is a sideways market.
At this time, watch out for the movement of the end point where the sideways trend ends.

Volume Delta Trailing Stop [LuxAlgo]The ' Volume Delta Trailing Stop ' indicator uses Lower Time Frame (LTF) volume delta data which can provide potential entries together with a Volume-Delta based Trailing Stop-line .
🔶 USAGE
Our 'Volume Delta Trailing Stop' script can show potential entries/Stop Loss lines
A trigger line needs to be broken before a position is taken, after which a Volume Delta-controlled Trailing Stop-line is created:
🔶 DETAILS
🔹 Volume rises when bought or sold
🔹 When the opening price appears on the chart, a buy/sell order has been executed.
If that order is less than the available supply of that particular price, volume will rise, without moving the price.
🔹 When the opening price is the same as the closing price, the volume of that bar can be seen as "neutral volume" (nV); nor "up", nor "down" volume.
Example
A buy order doesn't fill the first available supply in the order book. This price will be the opening price with a certain volume.
When at closing time, price still hasn't moved (the first available supply in the order book isn't filled, or no movement downwards),
the closing price will be equal to the opening price, but with volume. This can be seen as "neutral volume (nV)".
🔹 Delta Volume (ΔV): this is "up volume" minus "down volume"
🔹 Standard volume is colored red when closing price is lower than opening price ( = "down volume").
🔹 Standard volume is colored green when closing price is higher OR equal (nV) than opening price ( = "up volume").
🔹 Neutral Volume
The "Neutral-Volume" is considered "Up-Volume" - setting will dictate whether nV is considered as green 'buy' volume or not.
🔶 EXAMPLE
29 July 10:00 -> 10:05, chart timeframe 5 minutes, open 29311.28, close 29313.89
close > open, so the volume (39.55) is colored green ("up volume").
(The Volume script used in the following examples is the open-source publication Volume Columns w. Alerts (V) from LucF )
Let's zoom to the 1-minute TF:
The same period is now divided into more bars, volume direction (color) is dependable on the difference between open and close.
Counting up and down volume gives a more detailed result, it remains in an upward direction though):
(ΔV = +15.51)
Let's further zoom in to the 1-second TF:
The same period is now divided into even more bars (more possibility for changing direction on each bar)
Here we see several bars that haven't moved in price, but they have volume ("neutral" volume).
(neutral volume is coloured light green here, while up volume is coloured darker green)
When we count all green and red volume bars, the result is quite different:
(ΔV = -0.35)
In total more volume is found when price went downwards, yet price went up in these 5 minutes.
-> This is the heart of our publication, when this divergence occurs, you can see a barcolor changement:
• orange: when price went up, but LTF Volume was mainly in a downward direction.
• blue: when price went down, but LTF Volume was mainly in an upwards direction.
When we split the green "up volume" into "up" and "neutral", the difference is even higher
(here "neutral volume" is colored grey):
(ΔV = -12.76; "up" - "down")
🔶 CONCEPTS
bullishBear = current bar is red but LTF volume is in upward direction -> blue bar
bearishBull = current bar is green but LTF volume is in downward direction -> orange bar
🔹 Potential positioning - forming of Trigger-line
When not in position, the script will wait for a divergence between price and volume direction. When found, a Trigger-line will appear:
• at high when a blue bar appears ( bullishBear ).
• at low when an orange bar appears ( bearishBull ).
Next step is when the Trigger-line is broken by close or high/low (settings: Trigger )
Here, the closing price went under the grey Trigger-line -> bearish position:
🔹 Trailing Stop-line
When the Trigger-line is broken, the Trailing Stop-line (TS-line) will start:
• low when bullish position
• high when bearish position
You can choose (settings -> Trigger -> Close or H/L ) whether close price or high/low should break the Trigger-line
When alerts are enabled ("Any alert() function call"), you'll get the following message:
• ' signal up ' when bullish position
• ' signal down' when bearish position
After that, the TS-line will be adjusted when:
• a blue bullishBear bar appears when in bullish position -> lowest of {low , previous blue bar's high or orange bar's low}
• an orange bearishBull bar appears when in bearish position -> highest of {high, previous blue bar's high or orange bar's low}
When alerts are enabled ("Any alert() function call"), and the TS-line is broken, you'll get the following message:
• ' TS-line broken down ' when out bullish position
• ' TS-line broken up ' when out bearish position
🔹 Reference Point
Default the direction of price will be evaluated by comparing closing price with opening price.
When open and close are the same, you'll get "neutral volume".
You can use "previous close" instead (as in built-in volume indicator) to include gaps.
If close equals open , but close is lower than previous close , it will be regarded as " down volume ",
similar, when close is higher than previous close , it will be regarded as " up volume "
Note, the setting applies for the current timeframe AND Lower timeframe:
Based on: " open " (close - open)
Based on: " previous close " (close - previous close)
🔹 Adjustment
When the TS-line changes, this can be adjusted with a percentage of price , or a multiple of " True Range "
Default (Δ line -> Adjustment - 0)
Δ line -> Adjustment 0.03% (of price)
Δ line -> Mult of TR (10)
🔶 SETTINGS
🔹 LTF: choose your Lower TimeFrame: 1S (seconds), 5S, 10S, 15S, 30S, 1 minute)
🔹 Trigger: Choose the trigger for breaking the Trigger-line ; close or H/L (high when bullish position, low when bearish position)
🔹 Δ line ( Trailing Stop-line ): add/subtract an adjustment when the TS-line changes ( default: Adjustment ):
• Adjustment ( default: 0 ): add/subtract an extra % of price
• Mult of TR : add/subtract a multiple of True Range
🔹 Based on: compare closing price against:
• open
• previous close
🔹 "Neutral-Volume" is considered "Up-Volume" : this setting will dictate whether nV is considered as green 'buy' volume or not.
🔶 CONSIDERATIONS
🔹 The lowest LTF (1S) will give you more detail and will get data close to tick data.
However, a maximum of 100,000 intrabars can be used in calculations .
This means on the daily chart you won't see anything since 1 day ~ 86400 seconds. (just over 1 bar)
-> choose a lower chart timeframe, or choose a higher LTF (5S, 10S, ... 1 minute)
🔹 Always choose a LTF lower than the current chart timeframe.
🔹 Pine Script™ code using this request.security_lower_tf() may calculate differently on historical and real-time bars, leading to repainting .

MOST + Moving Average ScreenerScreener version of Anıl Özekşi's Moving Stop Loss (MOST) Indicator:
USERS MAY SCREEN MOST WITH 11 DIFFERENT TYPES OF MOVING AVERAGES + THEY CAN ALSO SCREEN SIGNALS WITH THAT 11 MOVING AVERAGES INSTEAD OF USING MOST LINE.
Adjustable Moving Average Types:
SMA : Simple Moving Average
EMA : Exponential Moving Average
WMA : Weighted Moving Average
DEMA : Double Exponential Moving Average
TMA : Triangular Moving Average
VAR : Variable Index Dynamic Moving Average aka VIDYA
WWMA : Welles Wilder's Moving Average
ZLEMA : Zero Lag Exponential Moving Average
TSF : True Strength Force
HULL : Hull Moving Average
TILL : Tillson T3 Moving Average
About Screener Panel:
Users can explore 20 different and user-defined tickers, which can be changed from the SETTINGS (shares, crypto, commodities...) on this screener version.
The screener panel shows up right after the bars on the right side of the chart.
-In this screener version of MOST, users can define the number of demanded tickers (symbols) from 1 to 20 by checking the relevant boxes on the settings tab.
-All selected tickers can be screened in different timeframes.
-Also, different timeframes of the same Ticker can be screened.
IMPORTANT NOTICE:
Screener shows the results in 3 different logic:
1st LOGIC (Default Settings):
BUY AND SELL SIGNALS of MOST and MOVING AVERAGE LINE
Most Buy Signal: Moving Average Crosses ABOVE the MOST LINE
Most Sel Signal: Moving Average Crosses BELOW the MOST LINE
Tickers seen in green are the ones that are in an uptrend, according to MOST.
The ones that appear in red are those in the SELL signal, in a downtrend.
The numbers before each Ticker indicate how many bars passed after MOST's last BUY or SELL signal.
For example, according to the indicator, when BTCUSDT appears (3) in GREEN, Bitcoin switched to a BUY signal 3 bars ago.
2nd LOGIC (Moving Average & Price Flips Screener Mode):
This mode can only be activated by checking the 'Activate Moving Average Screening Mode' box on the settings menu.
MOST line will be disappeared after checking the box.
Buy Signal: When the Selected Price crosses ABOVE the selected Moving Average.
Sell Signal: When the Selected Price crosses BELOW the selected Moving Average.
Tickers seen in green are the ones that are in an uptrend, according to Moving Average & Price Flips.
The ones that appear in red are those in the SELL signal, in a downtrend.
The numbers before each Ticker indicate how many bars passed after the last BUY or SELL signal of Moving Average & Price Flips.
For example, according to the indicator, when BTCUSDT appears (3) in GREEN, Bitcoin switched to a BUY signal 3 bars ago.
3rd LOGIC (Moving Average Color Change Screener Mode):
Both 'Activate Moving Average Screening Mode' and 'Activate Moving Average Color Change Screening Mode' boxes must be checked in the settings tab.
Moving Average Line will turn out into two colors.
Green color means the moving average value is greater than the previous bar's value.
Red color means the moving average value is smaller than the previous bar's value.
Buy Signal: After the Selected Moving Average turns GREEN from red.
Sell Signal: After the Selected Moving Average turns RED from green.
-Screener shows the information about the color changes of the selected Moving Average with default settings.
If this option is preferred, users are advised to enlarge the length to have better signals.
Tickers seen in green are the ones that are in an uptrend, according to Moving Average Color.
The ones that appear in red are those in the SELL signal, in a downtrend.
The numbers before each Ticker indicate how many bars passed after the last BUY or SELL signal of Moving Average Color Change.
For example, according to the indicator, when BTCUSDT appears (3) in GREEN, Bitcoin switched to a BUY signal 3 bars ago.

Stochastic Zone Strength Trend [wbburgin](This script was originally invite-only, but I'd vastly prefer contributing to the TradingView community more than anything else, so I am making it public :) I'd much rather share my ideas with you all.)
The Stochastic Zone Strength Trend indicator is a very powerful momentum and trend indicator that 1) identifies trend direction and strength, 2) determines pullbacks and reversals (including oversold and overbought conditions), 3) identifies divergences, and 4) can filter out ranges. I have some examples below on how to use it to its full effectiveness. It is composed of two components: Stochastic Zone Strength and Stochastic Trend Strength.
Stochastic Zone Strength
At its most basic level, the stochastic Zone Strength plots the momentum of the price action of the instrument, and identifies bearish and bullish changes with a high degree of accuracy. Think of the stochastic Zone Strength as a much more robust equivalent of the RSI. Momentum-change thresholds are demonstrated by the "20" and "80" levels on the indicator (see below image).
Stochastic Trend Strength
The stochastic Trend Strength component of the script uses resistance in each candlestick to calculate the trend strength of the instrument. I'll go more into detail about the settings after my description of how to use the indicator, but there are two forms of the stochastic Trend Strength:
Anchored at 50 (directional stochastic Trend Strength):
The directional stochastic Trend Strength can be used similarly to the MACD difference or other histogram-like indicators : a rising plot indicates an upward trend, while a falling plot indicates a downward trend.
Anchored at 0 (nondirectional stochastic Trend Strength):
The nondirectional stochastic Trend Strength can be used similarly to the ADX or other non-directional indicators : a rising plot indicates increasing trend strength, and look at the stochastic Zone Strength component and your instrument to determine if this indicates increasing bullish strength or increasing bearish strength (see photo below):
(In the above photo, a bearish divergence indicated that the high Trend Strength predicted a strong downwards move, which was confirmed shortly after. Later, a bullish move upward by the Zone Strength while the Trend Strength was elevated predicated a strong upwards move, which was also confirmed. Note the period where the Trend Strength never reached above 80, which indicated a ranging period (and thus unprofitable to enter or exit)).
How to Use the Indicator
The above image is a good example on how to use the indicator to determine divergences and possible pivot points (lines and circles, respectively). I recommend using both the stochastic Zone Strength and the stochastic Trend Strength at the same time, as it can give you a robust picture of where momentum is in relation to the price action and its trajectory. Every color is changeable in the settings.
Settings
The Amplitude of the indicator is essentially the high-low lookback for both components.
The Wavelength of the indicator is how stretched-out you want the indicator to be: how many amplitudes do you want the indicator to process in one given bar.
A useful analogy that I use (and that I derived the names from) is from traditional physics. In wave motion, the Amplitude is the up-down sensitivity of the wave, and the Wavelength is the side-side stretch of the wave.
The Smoothing Factor of the settings is simply how smoothed you want the stochastic to be. It's not that important in most circumstances.
Trend Anchor was covered above (see my description of Trend Strength). The "Trend Transform MA Length" is the EMA length of the Trend Strength that you use to transform it into the directional oscillator. Think of the EMA being transformed onto the 50 line and then the Trend Strength being dragged relative to that.
Trend Transform MA Length is the EMA length you want to use for transforming the nondirectional Trend Strength (anchored at 0) into the directional Trend Strength (anchored at 50). I suggest this be the same as the wavelength.
Trend Plot Type can transform the Nondirectional Trend Strength into a line plot so that it doesn't murk up the background.
Finally, the colors are changeable on the bottom.
Explanation of Zone Strength
If you're knowledgeable in Pine Script, I encourage you to look at the code to try to understand the concept, as it's a little complicated. The theory behind my Zone Strength concept is that the wicks in every bar can be used create an index of bullish and bearish resistance, as a wick signifies that the price crossed above a threshold before returning to its origin. This distance metric is unique because most indicators/formulas for calculating relative strength use a displacement metric (such as close - open) instead of measuring how far the price actually moved (up and down) within a candlestick. This is what the Zone Strength concept represents - the hesitation within the bar that is not typically represented in typical momentum indicators.
In the script's code I have step by step explanations of how the formula is calculated and why it is calculated as such. I encourage you to play around with the amplitude and wavelength inputs as they can make the zone strength look very different and perform differently depending on your interests.
Enjoy!
Walker

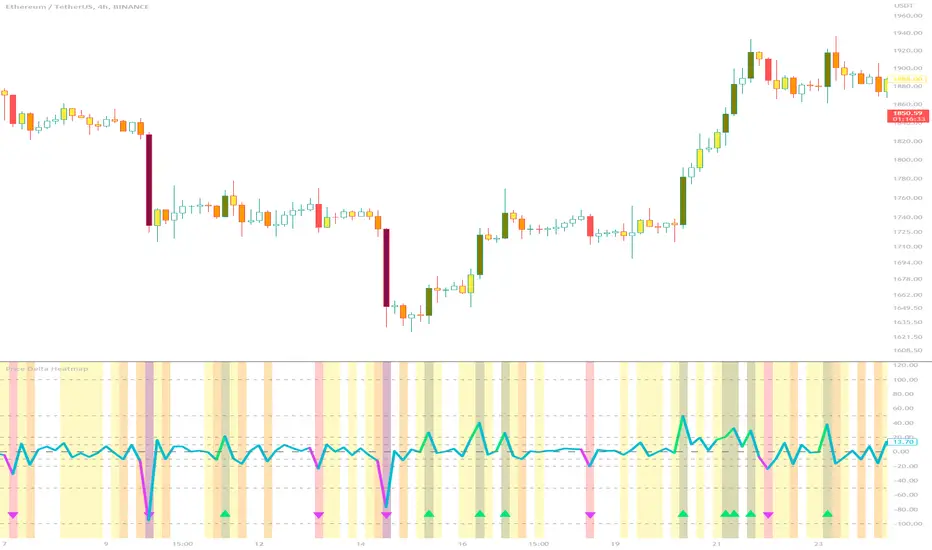
Price Delta HeatmapThe Price Delta Heatmap is an indicator designed to visualize the price changes of an asset over time. It helps traders identify and analyze significant price movements and potential volatility. The indicator calculates the price delta, which is the difference between the current close price and the previous close price. It then categorizes the price deltas into different color ranges to create a heatmap-like display on the chart.
The indicator uses user-defined thresholds to determine the color ranges. These thresholds represent the minimum price change required for a specific color to be assigned. The thresholds are adjustable to accommodate different asset classes and trading strategies. Positive price deltas are associated with bullish movements, while negative price deltas represent bearish movements.
The indicator plots bars color-coded according to the price delta range it falls into. The color ranges can be customized to match personal preferences or specific trading strategies. Additionally, the indicator includes signal shapes below the bars to highlight significant positive or negative price deltas. Traders can adjust the threshold values based on their preferred sensitivity to price changes. Higher threshold values may filter out minor price movements and focus on more significant shifts, while lower threshold values will capture even minor fluctuations.
****The default settings have the thresholds set to levels of 100, 50, 20, 10, 0, -10, -20, -50, and -100. These numbers are well-suited for assets such as Ethereum or Bitcoin which are larger in price than an asset that has a price of $1.50, for example. To compensate, adjust the thresholds in the settings to reflect the price delta on the desired asset. All coloration and horizontal line plots will adjust to reflect these changes.****
Traders can interpret the Price Delta Heatmap as follows:
-- Bright green bars indicate the highest positive price deltas, suggesting strong bullish price movements.
-- Green bars represent positive price deltas above the third threshold, indicating significant bullish price changes.
-- Olive bars indicate positive price deltas above the second threshold, suggesting moderate bullish price movements.
-- Yellow bars represent positive price deltas above the lowest threshold, indicating minor bullish price changes. This color is reflected on the negative side as well. Yellow bars below zero indicate negative price deltas below the lowest threshold, suggesting minor bearish price changes.
-- White bars represent zero price deltas, indicating no significant price movement.
-- Orange bars represent negative price deltas below the second threshold, indicating moderate bearish price movements.
-- Red bars indicate negative price deltas below the third threshold, suggesting significant bearish price changes.
-- Maroon bars represent the lowest negative price deltas, indicating strong bearish price movements.
The coloration of the Price Delta line itself is determined by the line's relation to the second positive and second negative thresholds (default +/- 20) - if the line is above the second positive threshold, the line is colored lime (and is reflected in a lime arrow at the bottom of the indicator); if the line is below the second negative threshold, the line is colored fuchsia (also reflected as an arrow); if the line is between thresholds, it is colored aqua.
The Price Delta Heatmap can be used in various trading strategies and applications. Some potential use cases include:
-- Trend identification : The indicator helps traders identify periods of high volatility and potential trend reversals.
-- Volatility analysis : By observing the color changes in the heatmap, traders can gauge the volatility of an asset and adjust their risk management strategies accordingly.
-- Confirmation tool : The indicator can be used as a confirmation tool alongside other technical indicators, such as trend-following indicators or oscillators.
-- Breakout trading : Traders can look for price delta bars of a specific color range to identify potential breakout opportunities.
However, it's important to note that the Price Delta Heatmap has certain limitations. These include:
-- Lagging nature : The indicator relies on historical price data, which means it may not provide real-time insights into price movements.
-- Sensitivity to thresholds : The choice of threshold values affects the indicator's sensitivity and may vary depending on the asset being traded. It requires experimentation and adjustment to find optimal values.
-- Market conditions : The indicator's effectiveness may vary depending on market conditions, such as low liquidity or sudden news events.
Traders should consider using the Price Delta Heatmap in conjunction with other technical analysis tools and incorporate risk management strategies to enhance their trading decisions.
Logarithmic VolatilityIntroducing the Logarithmic Volatility Indicator , an innovative trading indicator designed especially for trading in low volatility markets. This powerful indicator is aimed at traders of all levels, from beginners to experts, and is based on fundamental concepts of mathematics and statistics applied to the financial market. Its main objective is to provide you with a better understanding of price movements and help you make more accurate investment decisions, especially in low volatility environments.
The purpose of this indicator is to find a volatility estimator that depends on the difference between High and Low, taking into account that this measure is directly proportional to volatility. A first result was obtained by Parkinson (1980) which was later improved by Garman and Klass (1980), who improved the estimator by obtaining one of minimum variance. It is the simplified version (and recommended by them) of the Garman and Klass estimator that is used to calculate the daily volatility of the asset.
The Logarithmic Volatility Indicator is a unique smoothing indicator that uses logarithms and volatility calculation of the opening, high, low and closing prices. It combines these elements to obtain an accurate representation of market volatility in situations where volatility is low.
Features
This indicator has several outstanding features designed to enhance your trading analysis in low volatility environments:
• Intraday Volatility Calculation: This innovative feature allows you to view market volatility levels in real time, providing a clear view of market fluctuations even when volatility is low.
• EMA (Exponential Moving Average) Multi Length: The indicator incorporates three different EMA lengths (Fast, Medium and Slow). This gives you a deeper and more detailed analysis of market volatility, allowing you to detect subtle changes in volatility and make more accurate predictions.
• Visual color change: The indicator uses a color change between green and red to facilitate quick interpretation of the market. Green indicates a decrease in volatility, while red indicates an increase in volatility. This feature helps you quickly identify changes in market dynamics even in periods of low volatility.
• Histogram display: In addition to the colors, the indicator can also be displayed as a histogram. This intuitive representation allows you to visually observe changes in volatility over time and detect emerging patterns or trends in markets with low volatility.
Settings
The Logarithmic Volatility Indicator allows you to customize various settings to suit your specific trading needs:
• Slow EMA length: you can select the length of the slow exponential moving average according to your preferences and trading strategies.
• Fast EMA length: Similarly, you can choose the length of the fast exponential moving average to suit your trading style.
• Average EMA length: In addition to the two EMA lengths above, this indicator offers a third EMA length for even more detailed analysis. This additional feature is especially useful when trading in markets with low volatility, as it allows you to capture subtle changes in market dynamics.
Trading
The Logarithmic Volatility Indicator is designed not only to provide you with essential information about market volatility, but also to give you clear indications on when to trade. Here's how you can use the indicator's colors to guide your trading decisions:
- Long Trading: When the fast EMA has a smaller value than the slow EMA, the indicator will change to green. This is a signal to enter a long trade. That is, you can consider buying at this point, as an increase in price is anticipated due to decreasing volatility. With volatility declining, there is a greater likelihood that the price will continue in the current direction rather than fluctuate erratically.
- b]Short Trading: On the other hand, when the fast EMA has a higher value than the slow EMA, the indicator will turn red. This is a signal to enter a short trade. In other words, you may consider selling at this point, as a decline in price is anticipated due to rising volatility. With volatility on the rise, there is a greater risk of steeper price fluctuations.
It is important to remember that, as with any indicator, the Logarithmic Volatility Indicator does not guarantee 100% success. You should always use this indicator in combination with other analytical tools and good risk management. This tool provides you with an overview of market volatility and can help you identify trading opportunities in low volatility markets, but the final decision on when and how to trade should always be based on your own analysis and judgment.
In conclusion, the Logarithmic Volatility Indicator is an essential trading tool that every trader should have in their arsenal, especially when facing low volatility markets. With its accurate volatility calculation and easy-to-understand visualization, it will help you improve your trading decisions and maximize your profits even in situations where price movements are less pronounced. Try it today and take advantage of its efficiency in low volatility environments!
---------------------------------------------------------------------------------------------------
Presentamos el Indicador de Volatilidad Logarítmica , un innovador indicador de trading diseñado especialmente para operar en mercados con baja volatilidad. Este poderoso indicador está dirigido a traders de todos los niveles, desde principiantes hasta expertos, y se basa en conceptos fundamentales de matemáticas y estadísticas aplicadas al mercado financiero. Su objetivo principal es proporcionarte una mejor comprensión de los movimientos de precios y ayudarte a tomar decisiones de inversión más precisas, especialmente en entornos de baja volatilidad.
Con este indicador se pretende encontrar un estimador de la volatilidad que dependa de la diferencia entre el High y el Low, teniendo en cuenta que esta medida es directamente proporcional a la volatilidad. Un primer resultado fue obtenido por Parkinson (1980) que posteriormente fue mejorado por Garman y Klass (1980), que mejoraron el estimador obteniendo uno de varianza mínima. Es la versión simplificada (y recomendada por ellos mismos) del estimador de Garman y Klass la que se utiliza para calcular la volatilidad diaria del activo.
El Indicador de Volatilidad Logarítmica es un indicador de suavizado único que utiliza logaritmos y el cálculo de la volatilidad de los precios de apertura, máximo, mínimo y cierre. Combina estos elementos para obtener una representación precisa de la volatilidad del mercado en situaciones donde la volatilidad es baja.
Características
Este indicador cuenta con varias características sobresalientes diseñadas para mejorar tu análisis de trading en entornos de baja volatilidad:
• Cálculo de la volatilidad intradía: Esta función innovadora te permite ver los niveles de volatilidad del mercado en tiempo real, lo que brinda una visión clara de las fluctuaciones del mercado incluso cuando la volatilidad es baja.
• EMA (Exponential Moving Average) Multi Longitud: El indicador incorpora tres longitudes diferentes de EMA (Rápida, Media y Lenta). Esto te proporciona un análisis más profundo y detallado de la volatilidad del mercado, permitiéndote detectar cambios sutiles en la volatilidad y realizar predicciones más precisas.
• Cambio de color visual: El indicador utiliza un cambio de color entre verde y rojo para facilitar la interpretación rápida del mercado. El verde indica una disminución de la volatilidad, mientras que el rojo indica un aumento de la volatilidad. Esta característica te ayuda a identificar rápidamente cambios en la dinámica del mercado incluso en períodos de baja volatilidad.
• Visualización Histograma: Además de los colores, el indicador también se puede visualizar como un histograma. Esta representación intuitiva te permite observar de manera visual los cambios en la volatilidad a lo largo del tiempo y detectar patrones o tendencias emergentes en mercados con baja volatilidad.
Ajustes
El Indicador de Volatilidad Logarítmica te permite personalizar varios ajustes para adaptarlos a tus necesidades de trading específicas:
• Longitud de EMA lenta: Puedes seleccionar la longitud de la media móvil exponencial lenta según tus preferencias y estrategias de trading.
• Longitud de EMA rápida: De manera similar, puedes elegir la longitud de la media móvil exponencial rápida para ajustarla a tu estilo de trading.
• Longitud de EMA media: Además de las dos longitudes de EMA anteriores, este indicador ofrece una tercera longitud de EMA para un análisis aún más detallado. Esta característica adicional es especialmente útil cuando operas en mercados con baja volatilidad, ya que te permite capturar cambios sutiles en la dinámica del mercado.
Operativa
El Indicador de Volatilidad Logarítmica está diseñado no solo para brindarte información esencial sobre la volatilidad del mercado, sino también para ofrecerte indicaciones claras sobre cuándo operar. Aquí te explicamos cómo puedes utilizar los colores del indicador para guiar tus decisiones de trading:
• Operativa en Largo: Cuando la EMA rápida tiene un valor más pequeño que la EMA lenta, el indicador cambiará a color verde. Esta es una señal para entrar en una operación en largo. Es decir, puedes considerar comprar en este punto, ya que se anticipa un aumento en el precio debido a la disminución de la volatilidad. Con la volatilidad en descenso, existe una mayor probabilidad de que el precio continúe en la dirección actual en lugar de fluctuar erráticamente.
• Operativa en Corto: Por otro lado, cuando la EMA rápida tiene un valor mayor que la EMA lenta, el indicador se tornará rojo. Esta es una señal para entrar en una operación en corto. En otras palabras, puedes considerar vender en este punto, ya que se anticipa una disminución en el precio debido al aumento de la volatilidad. Con la volatilidad en ascenso, existe un mayor riesgo de fluctuaciones de precio más pronunciadas.
Es importante recordar que, como con cualquier indicador, el Indicador de Volatilidad Logarítmica no garantiza un éxito del 100%. Siempre debes usar este indicador en combinación con otras herramientas de análisis y una buena gestión de riesgos. Esta herramienta te proporciona una visión general de la volatilidad del mercado y puede ayudarte a identificar oportunidades de trading en mercados con baja volatilidad, pero la decisión final de cuándo y cómo operar siempre deberá basarse en tu propio análisis y juicio.
En conclusión, el Indicador de Volatilidad Logarítmica es una herramienta de trading esencial que todo trader debe tener en su arsenal, especialmente cuando se enfrenta a mercados con baja volatilidad. Con su cálculo preciso de la volatilidad y su visualización fácil de entender, te ayudará a mejorar tus decisiones de trading y a maximizar tus ganancias incluso en situaciones donde los movimientos de precios son menos pronunciados. ¡Pruébalo hoy mismo y aprovecha su eficiencia en entornos de baja volatilidad!

ICT Donchian Smart Money Structure (Expo)█ Concept Overview
The Inner Circle Trader (ICT) methodology is focused on understanding the actions and implications of the so-called "smart money" - large institutions and professional traders who often influence market movements. Key to this is the concept of market structure and how it can provide insights into potential price moves.
Over time, however, there has been a notable shift in how some traders interpret and apply this methodology. Initially, it was designed with a focus on the fractal nature of markets. Fractals are recurring patterns in price action that are self-similar across different time scales, providing a nuanced and dynamic understanding of market structure.
However, as the ICT methodology has grown in popularity, there has been a drift away from this fractal-based perspective. Instead, many traders have started to focus more on pivot points as their primary tool for understanding market structure.
Pivot points provide static levels of potential support and resistance. While they can be useful in some contexts, relying heavily on them could provide a skewed perspective of market structure. They offer a static, backward-looking view that may not accurately reflect real-time changes in market sentiment or the dynamic nature of markets.
This shift from a fractal-based perspective to a pivot point perspective has significant implications. It can lead traders to misinterpret market structure and potentially make incorrect trading decisions.
To highlight this issue, you've developed a Donchian Structure indicator that mirrors the use of pivot points. The Donchian Channels are formed by the highest high and the lowest low over a certain period, providing another representation of potential market extremes. The fact that the Donchian Structure indicator produces the same results as pivot points underscores the inherent limitations of relying too heavily on these tools.
While the Donchian Structure indicator or pivot points can be useful tools, they should not replace the original, fractal-based perspective of the ICT methodology. These tools can provide a broad overview of market structure but may not capture the intricate dynamics and real-time changes that a fractal-based approach can offer.
It's essential for traders to understand these differences and to apply these tools correctly within the broader context of the ICT methodology and the Smart Money Concept Structure. A well-rounded approach that incorporates fractals, along with other tools and forms of analysis, is likely to provide a more accurate and comprehensive understanding of market structure.
█ Smart Money Concept - Misunderstandings
The Smart Money Concept is a popular concept among traders, and it's based on the idea that the "smart money" - typically large institutional investors, market makers, and professional traders - have superior knowledge or information, and their actions can provide valuable insight for other traders.
One of the biggest misunderstandings with this concept is the belief that tracking smart money activity can guarantee profitable trading.
█ Here are a few common misconceptions:
Following Smart Money Equals Guaranteed Success: Many traders believe that if they can follow the smart money, they will be successful. However, tracking the activity of large institutional investors and other professionals isn't easy, as they use complex strategies, have access to information not available to the public, and often intentionally hide their moves to prevent others from detecting their strategies.
Instantaneous Reaction and Results: Another misconception is that market movements will reflect smart money actions immediately. However, large institutions often slowly accumulate or distribute positions over time to avoid moving the market drastically. As a result, their actions might not produce an immediate noticeable effect on the market.
Smart Money Always Wins: It's not accurate to assume that smart money always makes the right decisions. Even the most experienced institutional investors and professional traders make mistakes, misjudge market conditions, or are affected by unpredictable events.
Smart Money Activity is Transparent: Understanding what constitutes smart money activity can be quite challenging. There are many indicators and metrics that traders use to try and track smart money, such as the COT (Commitments of Traders) reports, Level II market data, block trades, etc. However, these can be difficult to interpret correctly and are often misleading.
Assuming Uniformity Among Smart Money: 'Smart Money' is not a monolithic entity. Different institutional investors and professional traders have different strategies, risk tolerances, and investment horizons. What might be a good trade for a long-term institutional investor might not be a good trade for a short-term professional trader, and vice versa.
█ Market Structure
The Smart Money Concept Structure deals with the interpretation of price action that forms the market structure, focusing on understanding key shifts or changes in the market that may indicate where 'smart money' (large institutional investors and professional traders) might be moving in the market.
█ Three common concepts in this regard are Change of Character (CHoCH), and Shift in Market Structure (SMS), Break of Structure (BMS/BoS).
Change of Character (CHoCH): This refers to a noticeable change in the behavior of price movement, which could suggest that a shift in the market might be about to occur. This might be signaled by a sudden increase in volatility, a break of a trendline, or a change in volume, among other things.
Shift in Market Structure (SMS): This is when the overall structure of the market changes, suggesting a potential new trend. It usually involves a sequence of lower highs and lower lows for a downtrend, or higher highs and higher lows for an uptrend.
Break of Structure (BMS/BoS): This is when a previously defined trend or pattern in the price structure is broken, which may suggest a trend continuation.
A key component of this approach is the use of fractals, which are repeating patterns in price action that can give insights into potential market reversals. They appear at all scales of a price chart, reflecting the self-similar nature of markets.
█ Market Structure - Misunderstandings
One of the biggest misunderstandings about the ICT approach is the over-reliance or incorrect application of pivot points. Pivot points are a popular tool among traders due to their simplicity and easy-to-understand nature. However, when it comes to the Smart Money Concept and trying to follow the steps of professional traders or large institutions, relying heavily on pivot points can create misconceptions and lead to confusion. Here's why:
Delayed and Static Information: Pivot points are inherently backward-looking because they're calculated based on the previous period's data. As such, they may not reflect real-time market dynamics or sudden changes in market sentiment. Furthermore, they present a static view of market structure, delineating pre-defined levels of support and resistance. This static nature can be misleading because markets are fundamentally dynamic and constantly changing due to countless variables.
Inadequate Representation of Market Complexity: Markets are influenced by a myriad of factors, including economic indicators, geopolitical events, institutional actions, and market sentiment, among others. Relying on pivot points alone for reading market structure oversimplifies this complexity and can lead to a myopic understanding of market dynamics.
False Signals and Misinterpretations: Pivot points can often give false signals, especially in volatile markets. Prices might react to these levels temporarily but then continue in the original direction, leading to potential misinterpretation of market structure and sentiment. Also, a trader might wrongly perceive a break of a pivot point as a significant market event, when in fact, it could be due to random price fluctuations or temporary volatility.
Over-simplification: Viewing market structure only through the lens of pivot points simplifies the market to static levels of support and resistance, which can lead to misinterpretation of market dynamics. For instance, a trader might view a break of a pivot point as a definite sign of a trend, when it could just be a temporary price spike.
Ignoring the Fractal Nature of Markets: In the context of the Smart Money Concept Structure, understanding the fractal nature of markets is crucial. Fractals are self-similar patterns that repeat at all scales and provide a more dynamic and nuanced understanding of market structure. They can help traders identify shifts in market sentiment or direction in real-time, providing more relevant and timely information compared to pivot points.
The key takeaway here is not that pivot points should be entirely avoided or that they're useless. They can provide valuable insights and serve as a useful tool in a trader's toolbox when used correctly. However, they should not be the sole or primary method for understanding the market structure, especially in the context of the Smart Money Concept Structure.
█ Fractals
Instead, traders should aim for a comprehensive understanding of markets that incorporates a range of tools and concepts, including but not limited to fractals, order flow, volume analysis, fundamental analysis, and, yes, even pivot points. Fractals offer a more dynamic and nuanced view of the market. They reflect the recursive nature of markets and can provide valuable insights into potential market reversals. Because they appear at all scales of a price chart, they can provide a more holistic and real-time understanding of market structure.
In contrast, the Smart Money Concept Structure, focusing on fractals and comprehensive market analysis, aims to capture a more holistic and real-time view of the market. Fractals, being self-similar patterns that repeat at different scales, offer a dynamic understanding of market structure. As a result, they can help to identify shifts in market sentiment or direction as they happen, providing a more detailed and timely perspective.
Furthermore, a comprehensive market analysis would consider a broader set of factors, including order flow, volume analysis, and fundamental analysis, which could provide additional insights into 'smart money' actions.
█ Donchian Structure
Donchian Channels are a type of indicator used in technical analysis to identify potential price breakouts and trends, and they may also serve as a tool for understanding market structure. The channels are formed by taking the highest high and the lowest low over a certain number of periods, creating an envelope of price action.
Donchian Channels (or pivot points) can be useful tools for providing a general view of market structure, and they may not capture the intricate dynamics associated with the Smart Money Concept Structure. A more nuanced approach, centered on real-time fractals and a comprehensive analysis of various market factors, offers a more accurate understanding of 'smart money' actions and market structure.
█ Here is why Donchian Structure may be misleading:
Lack of Nuance: Donchian Channels, like pivot points, provide a simplified view of market structure. They don't take into account the nuanced behaviors of price action or the complex dynamics between buyers and sellers that can be critical in the Smart Money Concept Structure.
Limited Insights into 'Smart Money' Actions: While Donchian Channels can highlight potential breakout points and trends, they don't necessarily provide insights into the actions of 'smart money'. These large institutional traders often use sophisticated strategies that can't be easily inferred from price action alone.
█ Indicator Overview
We have built this Donchian Structure indicator to show that it returns the same results as using pivot points. The Donchian Structure indicator can be a useful tool for market analysis. However, it should not be seen as a direct replacement or equivalent to the original Smart Money concept, nor should any indicator based on pivot points. The indicator highlights the importance of understanding what kind of trading tools we use and how they can affect our decisions.
The Donchian Structure Indicator displays CHoCH, SMS, BoS/BMS, as well as premium and discount areas. This indicator plots everything in real-time and allows for easy backtesting on any market and timeframe. A unique candle coloring has been added to make it more engaging and visually appealing when identifying new trading setups and strategies. This candle coloring is "leading," meaning it can signal a structural change before it actually happens, giving traders ample time to plan their next trade accordingly.
█ How to use
The indicator is great for traders who want to simplify their view on the market structure and easily backtest Smart Money Concept Strategies. The added candle coloring function serves as a heads-up for structure change or can be used as trend confirmation. This new candle coloring feature can generate many new Smart Money Concepts strategies.
█ Features
Market Structure
The market structure is based on the Donchian channel, to which we have added what we call 'Structure Response'. This addition makes the indicator more useful, especially in trending markets. The core concept involves traders buying at a discount and selling or shorting at a premium, depending on the order flow. Structure response enables traders to determine the order flow more clearly. Consequently, more trading opportunities will appear in trending markets.
Structure Candles
Structure Candles highlight the current order flow and are significantly more responsive to structural changes. They can provide traders with a heads-up before a break in structure occurs
-----------------
Disclaimer
The information contained in my Scripts/Indicators/Ideas/Algos/Systems does not constitute financial advice or a solicitation to buy or sell any securities of any type. I will not accept liability for any loss or damage, including without limitation any loss of profit, which may arise directly or indirectly from the use of or reliance on such information.
All investments involve risk, and the past performance of a security, industry, sector, market, financial product, trading strategy, backtest, or individual's trading does not guarantee future results or returns. Investors are fully responsible for any investment decisions they make. Such decisions should be based solely on an evaluation of their financial circumstances, investment objectives, risk tolerance, and liquidity needs.
My Scripts/Indicators/Ideas/Algos/Systems are only for educational purposes!

Intrabar Efficiency Ratio█ OVERVIEW
This indicator displays a directional variant of Perry Kaufman's Efficiency Ratio, designed to gauge the "efficiency" of intrabar price movement by comparing the sum of movements of the lower timeframe bars composing a chart bar with the respective bar's movement on an average basis.
█ CONCEPTS
Efficiency Ratio (ER)
Efficiency Ratio was first introduced by Perry Kaufman in his 1995 book, titled "Smarter Trading". It is the ratio of absolute price change to the sum of absolute changes on each bar over a period. This tells us how strong the period's trend is relative to the underlying noise. Simply put, it's a measure of price movement efficiency. This ratio is the modulator utilized in Kaufman's Adaptive Moving Average (KAMA), which is essentially an Exponential Moving Average (EMA) that adapts its responsiveness to movement efficiency.
ER's output is bounded between 0 and 1. A value of 0 indicates that the starting price equals the ending price for the period, which suggests that price movement was maximally inefficient. A value of 1 indicates that price had travelled no more than the distance between the starting price and the ending price for the period, which suggests that price movement was maximally efficient. A value between 0 and 1 indicates that price had travelled a distance greater than the distance between the starting price and the ending price for the period. In other words, some degree of noise was present which resulted in reduced efficiency over the period.
As an example, let's say that the price of an asset had moved from $15 to $14 by the end of a period, but the sum of absolute changes for each bar of data was $4. ER would be calculated like so:
ER = abs(14 - 15)/4 = 0.25
This suggests that the trend was only 25% efficient over the period, as the total distanced travelled by price was four times what was required to achieve the change over the period.
Intrabars
Intrabars are chart bars at a lower timeframe than the chart's. Each 1H chart bar of a 24x7 market will, for example, usually contain 60 intrabars at the LTF of 1min, provided there was market activity during each minute of the hour. Mining information from intrabars can be useful in that it offers traders visibility on the activity inside a chart bar.
Lower timeframes (LTFs)
A lower timeframe is a timeframe that is smaller than the chart's timeframe. This script determines which LTF to use by examining the chart's timeframe. The LTF determines how many intrabars are examined for each chart bar; the lower the timeframe, the more intrabars are analyzed, but fewer chart bars can display indicator information because there is a limit to the total number of intrabars that can be analyzed.
Intrabar precision
The precision of calculations increases with the number of intrabars analyzed for each chart bar. As there is a 100K limit to the number of intrabars that can be analyzed by a script, a trade-off occurs between the number of intrabars analyzed per chart bar and the chart bars for which calculations are possible.
Intrabar Efficiency Ratio (IER)
Intrabar Efficiency Ratio applies the concept of ER on an intrabar level. Rather than comparing the overall change to the sum of bar changes for the current chart's timeframe over a period, IER compares single bar changes for the current chart's timeframe to the sum of absolute intrabar changes, then applies smoothing to the result. This gives an indication of how efficient changes are on the current chart's timeframe for each bar of data relative to LTF bar changes on an average basis. Unlike the standard ER calculation, we've opted to preserve directional information by not taking the absolute value of overall change, thus allowing it to be utilized as a momentum oscillator. However, by taking the absolute value of this oscillator, it could potentially serve as a replacement for ER in the design of adaptive moving averages.
Since this indicator preserves directional information, IER can be regarded as similar to the Chande Momentum Oscillator (CMO) , which was presented in 1994 by Tushar Chande in "The New Technical Trader". Both CMO and ER essentially measure the same relationship between trend and noise. CMO simply differs in scale, and considers the direction of overall changes.
█ FEATURES
Display
Three different display types are included within the script:
• Line : Displays the middle length MA of the IER as a line .
Color for this display can be customized via the "Line" portion of the "Visuals" section in the script settings.
• Candles : Displays the non-smooth IER and two moving averages of different lengths as candles .
The `open` and `close` of the candle are the longest and shortest length MAs of the IER respectively.
The `high` and `low` of the candle are the max and min of the IER, longest length MA of the IER, and shortest length MA of the IER respectively.
Colors for this display can be customized via the "Candles" portion of the "Visuals" section in the script settings.
• Circles : Displays three MAs of the IER as circles .
The color of each plot depends on the percent rank of the respective MA over the previous 100 bars.
Different colors are triggered when ranks are below 10%, between 10% and 50%, between 50% and 90%, and above 90%.
Colors for this display can be customized via the "Circles" portion of the "Visuals" section in the script settings.
With either display type, an optional information box can be displayed. This box shows the LTF that the script is using, the average number of lower timeframe bars per chart bar, and the number of chart bars that contain LTF data.
Specifying intrabar precision
Ten options are included in the script to control the number of intrabars used per chart bar for calculations. The greater the number of intrabars per chart bar, the fewer chart bars can be analyzed.
The first five options allow users to specify the approximate amount of chart bars to be covered:
• Least Precise (Most chart bars) : Covers all chart bars by dividing the current timeframe by four.
This ensures the highest level of intrabar precision while achieving complete coverage for the dataset.
• Less Precise (Some chart bars) & More Precise (Less chart bars) : These options calculate a stepped LTF in relation to the current chart's timeframe.
• Very precise (2min intrabars) : Uses the second highest quantity of intrabars possible with the 2min LTF.
• Most precise (1min intrabars) : Uses the maximum quantity of intrabars possible with the 1min LTF.
The stepped lower timeframe for "Less Precise" and "More Precise" options is calculated from the current chart's timeframe as follows:
Chart Timeframe Lower Timeframe
Less Precise More Precise
< 1hr 1min 1min
< 1D 15min 1min
< 1W 2hr 30min
> 1W 1D 60min
The last five options allow users to specify an approximate fixed number of intrabars to analyze per chart bar. The available choices are 12, 24, 50, 100, and 250. The script will calculate the LTF which most closely approximates the specified number of intrabars per chart bar. Keep in mind that due to factors such as the length of a ticker's sessions and rounding of the LTF, it is not always possible to produce the exact number specified. However, the script will do its best to get as close to the value as possible.
Specifying MA type
Seven MA types are included in the script for different averaging effects:
• Simple
• Exponential
• Wilder (RMA)
• Weighted
• Volume-Weighted
• Arnaud Legoux with `offset` and `sigma` set to 0.85 and 6 respectively.
• Hull
Weighting
This script includes the option to weight IER values based on the percent rank of absolute price changes on the current chart's timeframe over a specified period, which can be enabled by checking the "Weigh using relative close changes" option in the script settings. This places reduced emphasis on IER values from smaller changes, which may help to reduce noise in the output.
█ FOR Pine Script™ CODERS
• This script imports the recently published lower_ltf library for calculating intrabar statistics and the optimal lower timeframe in relation to the current chart's timeframe.
• This script uses the recently released request.security_lower_tf() Pine Script™ function discussed in this blog post .
It works differently from the usual request.security() in that it can only be used on LTFs, and it returns an array containing one value per intrabar.
This makes it much easier for programmers to access intrabar information.
• This script implements a new recommended best practice for tables which works faster and reduces memory consumption.
Using this new method, tables are declared only once with var , as usual. Then, on the first bar only, we use table.cell() to populate the table.
Finally, table.set_*() functions are used to update attributes of table cells on the last bar of the dataset.
This greatly reduces the resources required to render tables.
Look first. Then leap.

Impactful pattern and candles pattern AlertThe Alertion indicator!
impactful pattern:
pattern that happen near the zone or in the zone at lower timeframe and give us entry and stop limit price.
It is helpful for price action traders and those who want to decrease their risk.
There are 3 IP patterns:
Quasimodo
Head and shoulder
whipsaw engulfing
These patterns may occur near the zone or may not occur but by them, you can decrease your trading risk for example you can
trade with half lot before IP pattern and enter with other half after pattern.
how to use?
for example:
you find zone at 1h timeframe for short position
when price enter to your zone
you run this indicator and choose your lower timeframe, for example 15m and click on short position.
Then make the alert by right-click on your chart and choose the add alert and at condition box choose the impactful pattern and then click on create
now wait for message :)
Candles pattern:
like reversal bar, key reversal bar, exhaustion bar, pin bar, two-bar reversal, tree-bar reversal, inside bar, outside bar
these occur when the trend turn, so it is usable when the price enter to your zone or near your zone.
This pattern can decrease your risk.
Inside bar and outside bar:
if this pattern engulf up, it is bullish pattern and if engulf down, it is bearish pattern.
what does this indicator do?
this indicator is for making alert
it helps you to decrease your risk and failure.
You optimize it to alert you when IP pattern happen or candle pattern happen or inside bar or outside bar engulfing or all of them.
For IP pattern, it will message you entry and stop limit price.
It works at 2 different timeframes, so you can make alert for example in 1h TF for candles pattern and 15m TF for IP pattern.
Indicator will alert you for candles pattern at your chart timeframe and for IP pattern at timeframe you've chosen when you run the indicator, and it is changeable
in setting.
setting options
TIMEFRAME
IP: select the timeframe for IP patterns it means when IP pattern happen at that timeframe the indicator will alert you
example = your TF is 1h, you found the supply zone and want to trade, note that IP pattern happen in lower TF, so you select 15m TF or TF lower than 1h.
Short position: select it if you want to make short position.
BUFFERING
indicator send you entry and stop limit price
you can change it by amount of percent
it is your strategy to change your entry and stop loss or not
example= in head and shoulder pattern at short position, the stop limit is high price of head in pattern
so the indicator will message you the exact price but if you want to put
your stop limit 5 percent upper than exact price you can enter 5 in front of stop loss
or you want to enter 5 percent lower than exact high price of shoulder, you can optimize it.
ALERTION
you choose what alert you want
IP alert or candle alert or inside and outside bar alert
type your text for alert
you can write additional text for your message
ADVANCE
IP alert frequency option:
1. Once per bar : indicator will alert you for IP pattern once at your chat timeframe bar, and you should wait til next bar for next alert.
2. Once per bar close : alert you when your chart timeframe bar closed and next alert will happen when next bar is closed.
3. All: alert you all the times IP pattern happen
pivot left and right bars: lower will find smaller pattern
at the END:
this indicator is not strategy
it is part of your strategy that help you to increase your winning rate.
It is helpful for scalping and candle patterns finding.
After you make an alert, you can delete the indicator or change your timeframe or make another alert, your previous alert won’t change.
Thank you all.

Trend-Quality IndicatorBINANCE:BTCUSDT
Open source version of the Trend-Quality Indicator as described by David Sepiashvili in [ Stocks & Commodities V. 22:4 (14-20) ]
Q-Indicator and B-Indicator are available both separately or together
█ OVERVIEW
The Trend-Quality indicator is a trend detection and estimation tool that is based on a two-step filtering technique. It measures cumulative price changes over term-oriented semicycles and relates them to “noise”. The approach reveals congestion and trending periods of the price movement and focuses on the most important trends, evaluating their strength in the process. The indicator is presented in a centered oscillator (Q-Indicator) and banded oscillator format (B-Indicator).
Semicycles are determined by using a short term and a longer term EMAs. The starting points for the cycles are determined by the moving averages crossover.
Cumulative price change (CPC) indicator measures the amount that the price has changed from a fixed starting point within a given semicycle. The CPC indicator is calculated as a cumulative sum of differences between the current and previous prices over the period from the fixed starting point.
The trend within the given semicycle can be found by calculating the moving average of the cumulative price change.
The noise can be defined as the average deviation of the cumulative price change from the trend. To determine linear noise, we calculate the absolute value of the difference between CPC and trend, and then smooth it over the n-point period. The root mean square noise, similar to the conventional standard deviation, can be derived by summing the squares of the difference between CPC and trend over each of the preceding n-point periods, dividing the sum by n, and calculating the square root of the result.
█ Q-INDICATOR
The Q-Indicator is a centered oscillator that fluctuates around a zero line with no upper or lower limits, is calculated by dividing trend by noise.
The Q-Indicator is intended to measure trend activity. The further the Q is from 0, the less the risk of trading with a trend, and the more reliable the trading opportunity. Values exceeding +2 or -2 can be qualified as promising
Values:
in the -1 to +1 range (GRAY) indicate that the trend is buried beneath noise. It is preferable to stay out of this zone
in the +1 to +2 or -1 to -2 range (YELLOW) indicate weak trending
in the +2 to +5 range (BLUE) or -2 to -5 range (ORANGE) indicate moderate trending
above +5 range (GREEN) or below -5 (RED) indicate strong trending
Readings exceeding strong trending levels can indicate overbought or oversold conditions and signal that price action should be monitored closely.
█ B-INDICATOR
The B-Indicator is a banded oscillator that fluctuates between 0 and 100, is calculated by dividing the absolute value of trend by noise added to absolute value of trend, and scaling the result appropriately.
The B-indicator doesn’t show the direction of price movement, but only the existence of the trend and its strength. It requires additional tools for reversal manifestations.
The indicator’s interpretation is simple. The central line suggests that the trend and noise are in equilibrium (trend is equal to noise).
Values:
below 50 (GRAY) indicate ranging market
in the 50 to 65 range (YELLOW) indicate weak trending
in the 65 to 80 range (BLUE) indicate moderate trending
above 80 (GREEN) indicate strong trending
The 65 level can be thought of as the demarcation line of trending and ranging markets and can help determine which type of technical analysis indicator (lagging or leading) is better suited to current market conditions. Readings exceeding strong trending levels can indicate overbought or oversold conditions.

Silen's Financials P/E & P/S[x10] RatesThis script aims to give a better visualization of P/E and P/S rates compared to the build-in "Price to earnings ratio" and "Price to sales ratio" in the "Financials" Section of Tradingview. For those of you don't know, those rates compare earnings and sales with your share price in regard to market cap and outstanding shares.
The scripts differs to the build-in versions in the following points:
- P/E & P/S rates are combined in one indicator
- Negative P/E rates are displayed better: Positive P/E rates are green, Negative P/E rates are red
- For visualization reasons, the indicator will cap positive and negative P/E rates at 100. (P/E rates above those levels are not siginificant either way)
- P/E & P/S rate are directly displayed on the graph
- Both P/E and P/S rates are combined on one left scale
- For visualization reasons, P/S rate is showing 10x the actual P/S rate. Using the standard P/S rate would result in hard-to-recognize changes of the P/S line.
To sum up:
- Positive P/E rates are green
- Negative P/E rate are red
- P/S rates are multiplied by 1 0
- P/S rates are yellow
How to use P/E and P/S rates:
The US market average for P/E rates is roughly ~18 in the US right now (10/2022) while the market average for P/S rates is roughly ~3 in the US. Note that average P/E and P/S can change when the market situation changes.
P/E and P/S rates help you value your stock better and help you decide whether your stock is undervalued or overvalued compared to the market or the industry when it comes to earnings and sales. If you compare to Market averages, a positive P/E of less than 18 means that your stock is likely unvervalued. A P/S rate below 3 (30 in the chart!) means that your stock is likely undervalued as well. If your stock shows rates above those, it is likely that it is overvalued compared to market averages.
Please note that P/E and P/S rates are not the only factors that make up a stock valuation. Valuations are complex and subjective.
A positive P/E rate also means that your company is profitable.
A Negative P/E rate means that your company is unprofitable.
If you have any questions or feedback let me know!
Disclaimer: This script doesn't show the actual P/S rate. It shows the P/S rate multiplied by 10, due to visualization issues. Positive P/E Rates above 100 are displayed as 100. Positive P/E rates are green, Negative P/E rates are red and multiplied by -1.
Disclaimer2: @Tradingview_Team: I couldn't find the right category for this script but categories are mandatory. I assume that "Breadth Indicators" is still the closest there is. Please let me know if you want me to change the category.
Disclaimer3: For visualization, the opacity of the displayed image is 70%. The standard opacity for the P/E and P/S lines is 50% and can be changed in the indicator settings. I found this setting more useful when working together with other indicators on the same chart
Disclaimer4: Earnings Per Share, Total Revenue used are TTM. Total Shares Outstanding used are FQ.

Stochastic PC [BigBitsIO]This script is a very simple stochastic calculation similar to Stochastic RSI that calculates a stochastic value of a moving average of the percentage price change. The purpose of the indicator is to find positive and negative volatility momentum peaks which might be able to help identify changes in trends. Like other stochastic indicators, it may be best used in combination with other indicators.
Explained:
- First gets the % change for the candle from open to close. Green candles produce positive values, red candles produce negative values.
- Then it creates a moving average of that number to try and reduce impacts of very large moves, although this can be changed with the super-fast smoothed length setting. Set it to 1 to remove all smoothing.
- After that, it creates a K value using a stochastic calculation based on the range of the price change moving average we created in the previous step. Set the smoothK to one to use a fast stochastic calculation, it is a slow stochastic calculation by default (3-period SMA of stochastic)
- Finally, to create the D value it calculates a 3-period SMA of the K value.
FAQ:
- Why is this script useful?
- This script can help identify the peaks and valleys of volatility momentum
DISCLAIMER: For educational and entertainment purposes only. Nothing in this content should be interpreted as financial advice or a recommendation to buy or sell any sort of security or investment including all types of crypto. DYOR, TYOB.
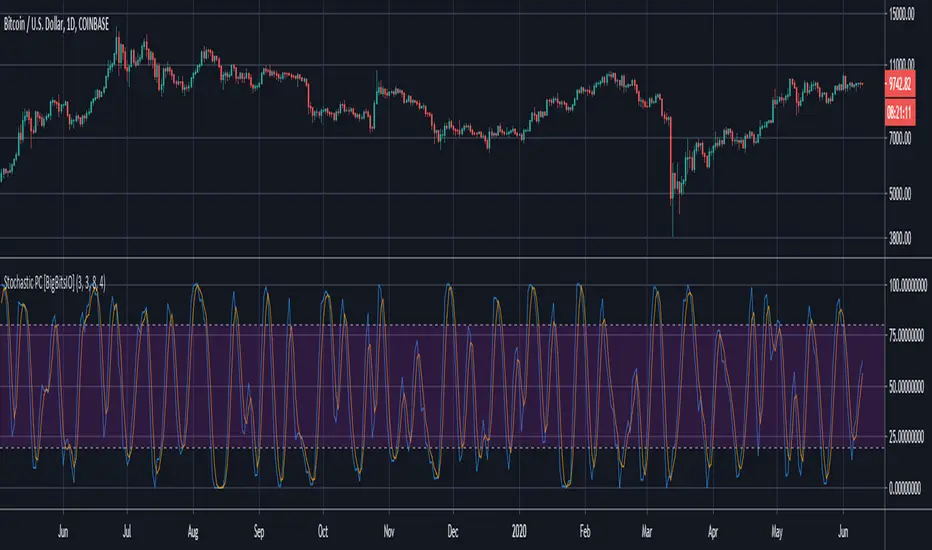
Altcoins capitalization histogram [peregringlk]This script superseeds "Other altcoins BTC capitalization histogram". The previous versions was a bit confusing in my opinion and lacked some generalization, so I'm now publishing this improved version.
It shows 6 pieces of info:
- Green columns: BTC price change for that day.
- Red bars: Altcoins capitalization change for that day, measured in bitcoins (altcoins_USD_capitalization / BTCUSD)
- Green/red background: green if that day the USD capitalization change was a gain, and red if it was a loss.
- Green line: accum BTC price change for the selected last days.
- Red line: accum altcoin capitalization change measured in BTC for the selected days.
- Dotted blue sequence: accum altcoin USD capitalization change for the selected days.
The base line of the histogram is 1 instead of 0, because I'm showing the price changes as multipliers (price change rates), so if there have been a +20% market movement, the calculated value will be 1.2, and if there have been a -20% market movement, then the value will be 0.8. 1 means no movement (preserved price/capitalization). Price and capitalization changes will be calculated using candle closes.
About the accumulated price changes, it will calculate the accumulated multiplication of the corresponding price change multipliers. For example, if you have set you want 3 days for the accumulation rates, and the last three days saw a -20%, +10% and +15% price/capitalization changes, the current value for the line will be 0.8*1.1*1.15 = 1.0120, or a +1.2% price change respect to the day before yesterday.
By default, if you are looking any ALTBTC market (for example, ETHBTC), instead of showing the USD and BTC capitalization of all alts, it will take the BTC and USD prices of the current market (the USD price will be calculated as ALTBTC * BTCUSD; and the BTCUSD price will be taken from BITSTAMP, the one with the longest BTC history I know in tradingview). If you are looking any other markets that is not paired with BTC, then it will take the USD capitalization of all altcoins, and the BTC capitalization will be calculated as altcoins_USD_capitalization / BTCUSD (from BITSTAMP as well).
Also, remember that, in both cases (alts capitalization or price), the graph will consistently respect the following rule:
- btc_usd_price_change * alt/capitalization_btc_price_change = alt_usd_price_change.
That applies for both the green/red bars respect to the background, and the green/red line respect to the blue dotted sequence.
Lastly, you may want to know if, in case btc price and altbtc price or capitalization go in opposite directions, who gain the battle? For example, if BTCUSD moved +20%, and an ALTBTC price moved -20%, the result is a loss, because 1.2*0.8 = 0.96, so the ALTUSD price or capitalization moved -4% (remember that, for preserving the USD value, if today's bitcoin change rate is x, the altbtc change rate must be 1/x; so for a -20% BTCUSD price movement, there must be at least a +25% ALTBTC price change to don't loss USD value, because 1/0.8 = 1.25). The background is what shows you that: if the background is green, it means that for that day there was a total USD gain of value, and when it's red, then it was a loss of USD value.
You can customize the following things:
- Accum change rate interval: the "selected days". By default 7.
- Take alts-capitalization?: By default unmarked. The effect when is unmarked is what I have explained in the previous paragraph. If you mark it, then it will use the USD_capitalization of all alts no matter what market you are looking right now.
- Which capitalization do you want? There are three options, that applies when "Take alts-capitalization?" is marked, or otherwise, when you are not looking a BTC-paired market.
- - - All-alts (default option): take CRYPTOCAP:TOTAL2 security as reference Alts-capitalization, which represents all altcoins.
- - - Other-alts: take CRYPTOCAP:OTHERS security as reference Alts-capitalization, which represents all altcoin except the 9 most capitalized alts.
- - - Big-alts: take CRYPTOCAP:TOTAL2 - CRYPTOCAP:OTHERS as reference Alts-capitalization, which represenst only the 9 most capitalized alts.
The idea of this script is:
A) Figuring out what is causing a USD value gain or loss, the alts market movements, or the BTC price change. So you can spot if some altcoin, or all altcoins combined, are gaining or loosing value by themselves or because of bitcoin.
B) Trying to spot or discover some patterns that allows you to identify altseasons. Once an altseason has been developed, the chart will show it in a pretty obvious way (massive red line bells and dotted blue lines with very high values during a period of various weeks). The hard problem is to spot it in advance, and maybe this graph can help.

Velocity Divergence Radar [JOAT]
Velocity Divergence Radar - Momentum Physics Edition
Overview
Velocity Divergence Radar is an open-source oscillator indicator that applies physics concepts to market analysis. It calculates price velocity (rate of change), acceleration (rate of velocity change), and jerk (rate of acceleration change) to provide a multi-dimensional view of momentum. The indicator also includes divergence detection and force vector analysis.
What This Indicator Does
The indicator calculates and displays:
Velocity - Rate of price change over a configurable period, smoothed with EMA
Acceleration - Rate of velocity change, showing momentum shifts
Jerk (3rd Derivative) - Rate of acceleration change, indicating momentum stability
Force Vectors - Volume-weighted acceleration representing market force
Kinetic Energy - Calculated as 0.5 * mass (volume ratio) * velocity squared
Momentum Conservation - Tracks momentum relative to historical average
Divergence Detection - Identifies when price and velocity diverge at pivots
How It Works
Velocity is calculated as smoothed rate of change:
calculateVelocity(series float price, simple int period) =>
float roc = ta.roc(price, period)
float velocity = ta.ema(roc, period / 2)
velocity
Acceleration is the change in velocity:
calculateAcceleration(series float velocity, simple int period) =>
float accel = ta.change(velocity, period)
float smoothAccel = ta.ema(accel, period / 2)
smoothAccel
Jerk is the change in acceleration:
calculateJerk(series float acceleration, simple int period) =>
float jerk = ta.change(acceleration, period)
float smoothJerk = ta.ema(jerk, period / 2)
smoothJerk
Force is calculated using F = m * a (mass approximated by volume ratio):
calculateForceVector(series float mass, series float acceleration) =>
float force = mass * acceleration
float forceDirection = math.sign(force)
float forceMagnitude = math.abs(force)
Signal Generation
Signals are generated based on velocity behavior:
Bullish Divergence: Price makes lower low while velocity makes higher low
Bearish Divergence: Price makes higher high while velocity makes lower high
Velocity Cross: Velocity crosses above/below zero line
Extreme Velocity: Velocity exceeds 1.5x the upper/lower zone threshold
Jerk Extreme: Jerk exceeds 2x standard deviation
Force Extreme: Force magnitude exceeds 2x average
Dashboard Panel (Top-Right)
Velocity - Current velocity value
Acceleration - Current acceleration value
Momentum Strength - Combined velocity and acceleration strength
Radar Score - Composite score based on velocity and acceleration
Direction - STRONG UP/SLOWING UP/STRONG DOWN/SLOWING DOWN/FLAT
Jerk - Current jerk value
Force Vector - Current force magnitude
Kinetic Energy - Current kinetic energy value
Physics Score - Overall physics-based momentum score
Signal - Current actionable status
Visual Elements
Velocity Line - Main oscillator line with color based on direction
Velocity EMA - Smoothed velocity for trend reference
Acceleration Histogram - Bar chart showing acceleration direction
Jerk Area - Filled area showing jerk magnitude
Vector Magnitude - Line showing combined vector strength
Radar Scan - Oscillating pattern for visual effect
Zone Lines - Upper and lower threshold lines
Divergence Labels - BULL DIV / BEAR DIV markers
Extreme Markers - Triangles at velocity extremes
Input Parameters
Velocity Period (default: 14) - Period for velocity calculation
Acceleration Period (default: 7) - Period for acceleration calculation
Divergence Lookback (default: 10) - Bars to scan for divergence
Radar Sensitivity (default: 1.0) - Zone threshold multiplier
Jerk Analysis (default: true) - Enable 3rd derivative calculation
Force Vectors (default: true) - Enable force analysis
Kinetic Energy (default: true) - Enable energy calculation
Momentum Conservation (default: true) - Enable momentum tracking
Suggested Use Cases
Identify momentum direction using velocity sign and magnitude
Watch for divergences as potential reversal warnings
Use acceleration to detect momentum shifts before price confirms
Monitor jerk for momentum stability assessment
Combine force and kinetic energy for conviction analysis
Timeframe Recommendations
Works on all timeframes. Higher timeframes provide smoother readings; lower timeframes show more granular momentum changes.
Limitations
Physics analogies are conceptual and not literal market physics
Divergence detection uses pivot-based lookback and may lag
Force calculation uses volume ratio as mass proxy
Kinetic energy is a derived metric, not actual energy
Open-Source and Disclaimer
This script is published as open-source under the Mozilla Public License 2.0 for educational purposes. It does not constitute financial advice. Past performance does not guarantee future results. Always use proper risk management.
- Made with passion by officialjackofalltrades

QTاندیکاتور "QT" در پلتفرم TradingView یک ابزار پیشرفته برای تجزیه و تحلیل بازار است که از چندین چرخه زمانی مختلف بهره میبرد. این اندیکاتور به شما کمک میکند تا نقاط بحرانی در بازههای زمانی مختلف (سالیانه، ماهانه، هفتگی، روزانه، 90 دقیقهای و میکرو) را شناسایی کنید. ویژگی برجسته این اندیکاتور، استفاده از SSMT (Same Cycle Multiple Timeframes) و PSP (Price Signal Patterns) برای ارائه سیگنالهای دقیقتر است. این دو بخش باعث میشوند که اندیکاتور "QT" به ابزاری قدرتمند برای تریدرها تبدیل شود.
ویژگیهای اصلی:
SSMT (Same Cycle Multiple Timeframes):
SSMT یک روش تجزیه و تحلیل پیشرفته است که در آن یک چرخه زمانی خاص بهطور همزمان در چندین تایم فریم مختلف رصد میشود. این اندیکاتور با استفاده از SSMT، به شما این امکان را میدهد که تغییرات قیمت در تایم فریمهای مختلف را مقایسه کنید و سیگنالهایی که در چندین تایم فریم همزمان فعال هستند، شناسایی کنید.
این سیگنالها میتوانند به شما کمک کنند که نقاط ورود و خروج بهتری داشته باشید، چرا که تایید شدن سیگنال در چند تایم فریم به معنای اعتبار بالای آن است.
به عنوان مثال، زمانی که یک شکست قیمتی در تایم فریم روزانه رخ میدهد و همزمان در تایم فریمهای هفتگی و ماهانه هم تأیید میشود، احتمال اینکه این حرکت ادامهدار باشد، بسیار بالا خواهد بود.
SSMT قابلیت تنظیم دارد و میتوانید آن را بر اساس نیاز خود بهطور سفارشی تنظیم کنید، از جمله تعیین نحوه نمایش علامتها، رنگها و خطوط سیگنال.
PSP (Price Signal Patterns):
PSP یکی از بخشهای کلیدی اندیکاتور QT است که از الگوهای خاص قیمتی برای شناسایی تغییرات مهم در بازار استفاده میکند. این الگوها میتوانند شامل شکستها (Breakouts)، برگشتها (Reversals) و تغییرات روند (Trend Changes) باشند.
اندیکاتور PSP از دو نماد مختلف برای مقایسه استفاده میکند (مثلاً "SPY" و "QQQ") و نقاطی که این نمادها با یکدیگر دچار انحراف میشوند را شناسایی میکند. به عنوان مثال، اگر یک نماد صعودی باشد اما دیگری نزولی باشد، این میتواند بهعنوان یک هشدار برای تغییر روند بازار عمل کند.
در کنار این الگوها، این اندیکاتور از نشانگرهای گرافیکی (مانند مثلثها، فلشها و علامتهای دایرهای) برای نمایش این تغییرات استفاده میکند.
PSP همچنین این امکان را به شما میدهد که سیگنالهای قیمتی را در تایم فریمهای مختلف مشاهده کرده و تصمیمات دقیقتری بگیرید.
چرخههای زمانی و جعبهها:
اندیکاتور QT از جعبههای زمانی برای نمایش تغییرات در چارچوبهای زمانی مختلف (سالیانه، ماهانه، هفتگی و غیره) استفاده میکند.
این جعبهها میتوانند بهطور خودکار و با تنظیمات سفارشی شما رسم شوند، بهطوری که شما میتوانید روندهای مختلف بازار را در تایم فریمهای متفاوت مشاهده کنید.
بهطور کلی، این ویژگی به شما کمک میکند که نقاط حمایت و مقاومت مهم در زمانهای مختلف بازار را شناسایی کنید.
گرافیک و سفارشیسازی:
این اندیکاتور به شما این امکان را میدهد که رنگها، اندازهها، و استایلهای گرافیکی را به دلخواه خود تغییر دهید. این ویژگی به تریدرها این امکان را میدهد که ابزار را با توجه به نیاز خود شخصیسازی کنند.
همچنین، از آنجا که این اندیکاتور از چندین چرخه زمانی استفاده میکند، شما میتوانید هرکدام از این چرخهها را با استایلهای مختلف نمایش دهید، مثل استفاده از خطچین، نقطهچین یا خطهای عادی.
خلاصه:
اندیکاتور "QT" با استفاده از تکنیکهای پیشرفته مانند SSMT و PSP، تجزیه و تحلیل بازار را در چندین تایم فریم مختلف برای شما امکانپذیر میسازد. این اندیکاتور با تحلیل دقیق چرخههای زمانی مختلف و شناسایی الگوهای قیمتی، سیگنالهایی را برای ورود و خروج به بازار به شما ارائه میدهد که میتواند بهطور قابلتوجهی به استراتژی معاملاتی شما کمک کند.
English:
Detailed Description of QT Indicator with Focus on SSMT and PSP:
The "QT" indicator on TradingView is an advanced tool designed for market analysis using multiple time cycles. It provides traders with a comprehensive view of market trends across different time frames (Yearly, Monthly, Weekly, Daily, 90-minute, and Micro). The standout feature of this indicator is its utilization of SSMT (Same Cycle Multiple Timeframes) and PSP (Price Signal Patterns), which enhances its ability to deliver more accurate signals. These two components make the "QT" indicator a powerful tool for traders.
Main Features:
SSMT (Same Cycle Multiple Timeframes):
SSMT is an advanced analysis technique that monitors a specific cycle across multiple time frames simultaneously. By using SSMT, this indicator allows traders to compare price changes across different time frames and identify signals that are active across multiple time frames.
These signals help traders identify high-probability entry and exit points because when a signal is confirmed across several time frames, it indicates a strong likelihood of a sustained price move.
For example, if a price breakout occurs on the daily time frame and is simultaneously confirmed on the weekly and monthly time frames, it is more likely to continue.
SSMT is highly customizable, allowing traders to adjust how markers, colors, and signal lines are displayed based on their preferences.
PSP (Price Signal Patterns):
PSP is one of the key components of the QT indicator that uses specific price patterns to identify significant market changes. These patterns can include breakouts, reversals, and trend changes.
The indicator utilizes two symbols (e.g., "SPY" and "QQQ") to compare and identify when these symbols diverge, signaling potential market shifts. For instance, if one symbol is bullish while another is bearish, this could signal a change in market direction.
In addition to these patterns, the indicator uses graphical markers (such as triangles, arrows, and circles) to visually represent these market changes and signals.
PSP allows traders to view price signals across different time frames, helping them make more informed decisions.
Time Cycles and Boxes:
The QT indicator uses time boxes to visually display price changes across different time frames (Yearly, Monthly, Weekly, etc.).
These boxes are automatically drawn and can be customized based on the user's settings, allowing traders to observe market trends across various periods.
Overall, this feature helps traders identify critical support and resistance levels at different points in time.
Graphics and Customization:
This indicator allows traders to customize colors, sizes, and graphical styles to fit their needs.
Additionally, since the indicator uses multiple time cycles, traders can display each cycle with different styles, such as solid, dotted, or dashed lines.
Summary:
The "QT" indicator, using advanced techniques like SSMT and PSP, allows traders to analyze the market across multiple time frames. By detecting significant price patterns and utilizing time cycles, the QT indicator provides high-probability signals for market entry and exit. This can greatly assist in enhancing your trading strategy.

QT-AKHOKOاندیکاتور "QT" در پلتفرم TradingView یک ابزار پیشرفته برای تجزیه و تحلیل بازار است که از چندین چرخه زمانی مختلف بهره میبرد. این اندیکاتور به شما کمک میکند تا نقاط بحرانی در بازههای زمانی مختلف (سالیانه، ماهانه، هفتگی، روزانه، 90 دقیقهای و میکرو) را شناسایی کنید. ویژگی برجسته این اندیکاتور، استفاده از SSMT (Same Cycle Multiple Timeframes) و PSP (Price Signal Patterns) برای ارائه سیگنالهای دقیقتر است. این دو بخش باعث میشوند که اندیکاتور "QT" به ابزاری قدرتمند برای تریدرها تبدیل شود.
ویژگیهای اصلی:
SSMT (Same Cycle Multiple Timeframes):
SSMT یک روش تجزیه و تحلیل پیشرفته است که در آن یک چرخه زمانی خاص بهطور همزمان در چندین تایم فریم مختلف رصد میشود. این اندیکاتور با استفاده از SSMT، به شما این امکان را میدهد که تغییرات قیمت در تایم فریمهای مختلف را مقایسه کنید و سیگنالهایی که در چندین تایم فریم همزمان فعال هستند، شناسایی کنید.
این سیگنالها میتوانند به شما کمک کنند که نقاط ورود و خروج بهتری داشته باشید، چرا که تایید شدن سیگنال در چند تایم فریم به معنای اعتبار بالای آن است.
به عنوان مثال، زمانی که یک شکست قیمتی در تایم فریم روزانه رخ میدهد و همزمان در تایم فریمهای هفتگی و ماهانه هم تأیید میشود، احتمال اینکه این حرکت ادامهدار باشد، بسیار بالا خواهد بود.
SSMT قابلیت تنظیم دارد و میتوانید آن را بر اساس نیاز خود بهطور سفارشی تنظیم کنید، از جمله تعیین نحوه نمایش علامتها، رنگها و خطوط سیگنال.
PSP (Price Signal Patterns):
PSP یکی از بخشهای کلیدی اندیکاتور QT است که از الگوهای خاص قیمتی برای شناسایی تغییرات مهم در بازار استفاده میکند. این الگوها میتوانند شامل شکستها (Breakouts)، برگشتها (Reversals) و تغییرات روند (Trend Changes) باشند.
اندیکاتور PSP از دو نماد مختلف برای مقایسه استفاده میکند (مثلاً "SPY" و "QQQ") و نقاطی که این نمادها با یکدیگر دچار انحراف میشوند را شناسایی میکند. به عنوان مثال، اگر یک نماد صعودی باشد اما دیگری نزولی باشد، این میتواند بهعنوان یک هشدار برای تغییر روند بازار عمل کند.
در کنار این الگوها، این اندیکاتور از نشانگرهای گرافیکی (مانند مثلثها، فلشها و علامتهای دایرهای) برای نمایش این تغییرات استفاده میکند.
PSP همچنین این امکان را به شما میدهد که سیگنالهای قیمتی را در تایم فریمهای مختلف مشاهده کرده و تصمیمات دقیقتری بگیرید.
چرخههای زمانی و جعبهها:
اندیکاتور QT از جعبههای زمانی برای نمایش تغییرات در چارچوبهای زمانی مختلف (سالیانه، ماهانه، هفتگی و غیره) استفاده میکند.
این جعبهها میتوانند بهطور خودکار و با تنظیمات سفارشی شما رسم شوند، بهطوری که شما میتوانید روندهای مختلف بازار را در تایم فریمهای متفاوت مشاهده کنید.
بهطور کلی، این ویژگی به شما کمک میکند که نقاط حمایت و مقاومت مهم در زمانهای مختلف بازار را شناسایی کنید.
گرافیک و سفارشیسازی:
این اندیکاتور به شما این امکان را میدهد که رنگها، اندازهها، و استایلهای گرافیکی را به دلخواه خود تغییر دهید. این ویژگی به تریدرها این امکان را میدهد که ابزار را با توجه به نیاز خود شخصیسازی کنند.
همچنین، از آنجا که این اندیکاتور از چندین چرخه زمانی استفاده میکند، شما میتوانید هرکدام از این چرخهها را با استایلهای مختلف نمایش دهید، مثل استفاده از خطچین، نقطهچین یا خطهای عادی.
خلاصه:
اندیکاتور "QT" با استفاده از تکنیکهای پیشرفته مانند SSMT و PSP، تجزیه و تحلیل بازار را در چندین تایم فریم مختلف برای شما امکانپذیر میسازد. این اندیکاتور با تحلیل دقیق چرخههای زمانی مختلف و شناسایی الگوهای قیمتی، سیگنالهایی را برای ورود و خروج به بازار به شما ارائه میدهد که میتواند بهطور قابلتوجهی به استراتژی معاملاتی شما کمک کند.
English:
Detailed Description of QT Indicator with Focus on SSMT and PSP:
The "QT" indicator on TradingView is an advanced tool designed for market analysis using multiple time cycles. It provides traders with a comprehensive view of market trends across different time frames (Yearly, Monthly, Weekly, Daily, 90-minute, and Micro). The standout feature of this indicator is its utilization of SSMT (Same Cycle Multiple Timeframes) and PSP (Price Signal Patterns), which enhances its ability to deliver more accurate signals. These two components make the "QT" indicator a powerful tool for traders.
Main Features:
SSMT (Same Cycle Multiple Timeframes):
SSMT is an advanced analysis technique that monitors a specific cycle across multiple time frames simultaneously. By using SSMT, this indicator allows traders to compare price changes across different time frames and identify signals that are active across multiple time frames.
These signals help traders identify high-probability entry and exit points because when a signal is confirmed across several time frames, it indicates a strong likelihood of a sustained price move.
For example, if a price breakout occurs on the daily time frame and is simultaneously confirmed on the weekly and monthly time frames, it is more likely to continue.
SSMT is highly customizable, allowing traders to adjust how markers, colors, and signal lines are displayed based on their preferences.
PSP (Price Signal Patterns):
PSP is one of the key components of the QT indicator that uses specific price patterns to identify significant market changes. These patterns can include breakouts, reversals, and trend changes.
The indicator utilizes two symbols (e.g., "SPY" and "QQQ") to compare and identify when these symbols diverge, signaling potential market shifts. For instance, if one symbol is bullish while another is bearish, this could signal a change in market direction.
In addition to these patterns, the indicator uses graphical markers (such as triangles, arrows, and circles) to visually represent these market changes and signals.
PSP allows traders to view price signals across different time frames, helping them make more informed decisions.
Time Cycles and Boxes:
The QT indicator uses time boxes to visually display price changes across different time frames (Yearly, Monthly, Weekly, etc.).
These boxes are automatically drawn and can be customized based on the user's settings, allowing traders to observe market trends across various periods.
Overall, this feature helps traders identify critical support and resistance levels at different points in time.
Graphics and Customization:
This indicator allows traders to customize colors, sizes, and graphical styles to fit their needs.
Additionally, since the indicator uses multiple time cycles, traders can display each cycle with different styles, such as solid, dotted, or dashed lines.
Summary:
The "QT" indicator, using advanced techniques like SSMT and PSP, allows traders to analyze the market across multiple time frames. By detecting significant price patterns and utilizing time cycles, the QT indicator provides high-probability signals for market entry and exit. This can greatly assist in enhancing your trading strategy.

SuperTrend Weighted by Divergence█ OVERVIEW
SuperTrend Weighted by Divergence is a trend-following indicator based on the classic SuperTrend, enhanced with dynamic ATR weighting driven by divergences. Its key feature is adaptive behavior: when a divergence appears, the indicator temporarily reduces the ATR multiplier, allowing the trend line to react faster to potential market reversals.
The indicator remains clean, visually clear, and well suited for traders who want to combine trend-following with early detection of weakening momentum.
█ CONCEPT
One of the biggest drawbacks of trend indicators is their lagging nature, caused by the characteristics of source data. Classic SuperTrends react only after the trend has already developed, which often leads to late entries or exits.
The idea behind SuperTrend Weighted by Divergence is to introduce dynamic adjustment of the trend line in response to the first signs of trend weakening.
Instead of treating ATR as a constant volatility buffer, the indicator temporarily modifies its impact when the market sends warning signals in the form of price–oscillator divergences.
For divergence detection, a hidden auxiliary oscillator called “MPO4 Lines – Modal Engine” (default settings) is used. This oscillator is not displayed on the chart – only the points where divergences are detected are shown as markers on price bars.
Divergences do not generate direct entry signals; they are used solely to temporarily adjust the behavior of the SuperTrend.
If, after detecting a divergence against the current trend, a divergence in line with the trend appears, the previous divergence is invalidated and the SuperTrend returns to its standard behavior (base ATR multiplier).
█ FEATURES
Data sources:
- ATR (Average True Range)
- Reference point: HL2 (high/low average)
- MPO4 Lines – Modal Engine oscillator (hidden, used only for divergence detection)
Divergence logic:
- Bullish divergence: lower low in price + higher low in the oscillator
- Bearish divergence: higher high in price + lower high in the oscillator
- Divergences are detected using pivots (left/right)
- Divergence detection is delayed by the pivot length, as confirmation requires a fixed number of bars on the right side
Divergence impact:
- After a divergence is detected, the ATR multiplier is reduced
- The reduction strength is controlled by Divergence Sensitivity
- The effect is active only for a limited number of bars – 200 bars by default (divBars)
- The effect is canceled on trend change or when a trend-aligned divergence appears
Trend change logic:
- Trend changes only after a confirmed close beyond the trailing line
- No repainting
- Trend lines break at reversal points
Visual signals:
- “Buy” and “Sell” labels only on confirmed trend changes
- Optional bar coloring based on current trend (Color bars by trend)
- Soft fill between price and the trend line
- Divergence markers (dots above/below bars) shown at the point of divergence detection, not across the entire divergence structure
Alerts:
- Buy Signal – trend change to bullish
- Sell Signal – trend change to bearish
- Bullish Divergence
- Bearish Divergence
█ HOW TO USE
Adding the indicator:
Paste the code into Pine Editor or search for “SuperTrend Weighted by Divergence” on TradingView
Main settings:
- ATR Length – ATR period
- Base ATR Multiplier – base SuperTrend width
- Pivot Length – divergence sensitivity and detection delay
- Divergence Sensitivity – strength of divergence impact (0.0–1.0)
- Color bars by trend – enable / disable bar coloring
- Line and fill colors – fully customizable
Interpretation:
- Green line and bars = uptrend
- Red line and bars = downtrend
- Divergence against the trend = possible weakening and faster SuperTrend reaction
- Trend-aligned divergence = return to standard SuperTrend behavior
- No divergence = classic, stable SuperTrend behavior
█ APPLICATIONS
Ideal for:
- Trend-following
Entering positions only in the direction of the current trend, using the SuperTrend as a directional filter.
- Early detection of trend weakness
Repeated divergences against the trend may indicate decreasing momentum and a potential upcoming reversal.
- Markets with variable dynamics (crypto, indices, forex)
Entries based on trend changes, preferably confirmed by other tools such as Fibonacci levels, RSI, support/resistance, or market structure.
- Scalping, day trading, and swing trading (with parameter adjustments)
Increasing Divergence Sensitivity to around 0.4–0.5 produces many more signals on small, often short-lived moves.
These settings work well for scalping and day trading, but are not ideal for swing trading, as they tend to generate more false signals and frequent trend changes.
█ NOTES
- Works on all markets and timeframes
- Divergences are used to adapt SuperTrend behavior, not as standalone entry signals
- Higher Divergence Sensitivity = faster reaction and more signals
- Lower Divergence Sensitivity = smoother trend and fewer changes
- Best results are achieved by tuning parameters to the instrument and trading style

Reduced-Lag Chande Momentum Oscillator [BOSWaves]Reduced-Lag Chande Momentum Oscillator – Adaptive Momentum Geometry with Reduced-Latency Reversion Logic
Overview
The Reduced-Lag Chande Momentum Oscillator represents a sophisticated extension of the classical Chande Momentum Oscillator, preserving the foundational measurement of net directional pressure while addressing inherent limitations in lag, noise, and signal clarity. The traditional CMO provides reliable snapshots of upward versus downward force but reacts slowly to rapid market accelerations and can obscure meaningful momentum inflections with delayed readings. This iteration integrates a dual-stage reduced-lag filter, optional advanced smoothing, and acceleration-based analytics, producing a real-time, multi-dimensional representation of market momentum.
The design reframes classical momentum using a layered curvature and gradient structure - main, midline, and shadow - to show trajectory, velocity, and intensity in one view. Instead of the usual ±70/30 extremes, it uses ±50 as a statistically grounded threshold where one side of the market begins exerting true dominance. This captures structural imbalance more reliably, exposing exhaustion and actionable inflection without amplifying noise.
This visualization gives traders a continuous, responsive read on market structure, revealing not just direction but rate of change, acceleration alignment, and curvature behavior. The oscillator becomes a momentum map, expressing both probability and intensity behind directional shifts.
Where conventional oscillators mislabel short-lived swings as signals, the Reduced-Lag CMO separates baseline shifts from high-conviction transitions, enabling cleaner, more decisive signal interpretation.
Theoretical Foundation
The classical Chande Momentum Oscillator, created by Tushar Chande, calculates the normalized net difference between consecutive upward and downward price changes over a defined window, generating readings from –100 to +100. While effective for capturing basic directional pressure, the unmodified CMO suffers from signal latency and sensitivity to abrupt market swings, which can obscure actionable inflection points.
The Reduced-Lag CMO augments this foundation with three key mechanisms:
Reduced-Lag Filtering : A dual-EMA structure eliminates inertial lag, aligning the oscillator curve closely with real-time market momentum without producing overshoot artifacts.
Smoothing Architecture : Optional SMA, EMA, or WMA smoothing is applied post-filter, balancing noise reduction with trajectory fidelity. A multi-layer line system (shadow → midline → main) communicates depth, curvature, and gradient dynamics.
Acceleration Integration : First and second derivatives of the smoothed curve quantify velocity and acceleration, allowing the indicator to identify not only momentum flips but the force behind each shift, forming the basis for the strong-signal overlay.
The combination of these mechanisms produces an oscillator that respects the original CMO framework while delivering real-time, context-sensitive intelligence. The ±50 boundaries are selected as the statistically validated pressure zones where directional dominance exceeds neutral oscillation. Crosses and rejections at these boundaries are not arbitrary overbought/oversold events, but measurable imbalances with actionable significance.
How It Works
The Reduced-Lag CMO is constructed through a multi-stage process:
Momentum Estimation Core : Raw CMO values are calculated and then passed through a reduced-lag filter to remove delay, creating a curve that closely tracks instantaneous directional pressure.
Smoothing & Layered Representation : The filtered curve can be smoothed and split into three layers - shadow, midline, and main - giving visual depth, trajectory clarity, and curvature instead of a single-line oscillator.
Gradient-Based Pressure Mapping : Color gradients encode momentum strength and polarity. Green-yellow transitions highlight increasing upward dominance, while red-yellow transitions indicate weakening downward force.
Pressure-Zone Anchoring (±50) : The system defines statistically significant pressure zones at ±50. Moves beyond these levels reflect dominant directional control, and rejections inside the zone signal potential exhaustion.
Signal Generation : Momentum events are evaluated through velocity and acceleration. Standard signals appear as triangle markers indicating validated momentum flips. Strong signals appear as triangles with diamonds when acceleration confirms a high-conviction transition.
A cooldown rule spaces signals apart to reduce clutter and emphasize structurally meaningful events.
Interpretation
The Reduced-Lag CMO reframes momentum as a dynamic equilibrium between directional force and structural pressure:
Positive Momentum Phases : Curves above zero with green-yellow gradients indicate sustained upward pressure. Shallow retracements or midline tests denote controlled pullbacks.
Negative Momentum Phases : Curves below zero with red-yellow gradients show downward dominance. Rejections from –50 highlight potential exhaustion and reversal readiness.
Pressure-Zone Dynamics (±50) : Crosses beyond ±50 confirm dominant directional force. Meanwhile, rejections and rotations inside the zone signal structural fatigue.
Velocity & Acceleration Analysis : Rising momentum with decelerating velocity suggests fading force; acceleration alignment amplifies signal strength and forms the basis of strong signals.
Signal Architecture
The Reduced-Lag CMO produces a single event type with two intensities: a validated momentum inflection.
Standard Signals - Triangles:
Triggered by momentum flips confirmed by velocity.
Represent moderate-intensity directional changes.
Appear at zero-line crosses or ±50 rejections with aligned velocity.
Strong Signals Triangles + Diamonds:
Triggered when acceleration confirms the directional change.
Represent high-intensity, high-conviction shifts.
Rare by design; indicate robust momentum inflections.
Cooldown mechanics prevent repeated signals in short succession, emphasizing structural reliability over noise.
Strategy Integration
Trend Confirmation : Align zero-line flips with higher-timeframe directional bias.
Reversal Detection : Strong signals from ±50 zones highlight potential inflection points.
Volatility Assessment : Gradient transitions reveal strengthening or weakening momentum.
Pullback Timing : Multi-layer curvature identifies controlled retracements vs trend exhaustion.
Confluence Mapping : Pair with structure-based indicators to filter signals in context.
Technical Implementation Details
Core Engine : Classical CMO with Ehlers reduced-lag extension
Lag Reduction : Dual EMA filtering
Smoothing : Optional SMA/EMA/WMA post-filter
Multi-Layer Curve : Shadow, midline, main
Signal System : Two-tier momentum-acceleration framework
Pressure Zones : ±50 statistically validated thresholds
Cooldown Logic : Bar-indexed suppression
Gradient Mapping : Encodes magnitude and direction
Alerts : Standard and strong signals
Optimal Application Parameters
Timeframes:
1 - 5 min : Intraday momentum tracking
15 - 60 min : Trend rotations & volatility transitions
4H - Daily : Macro momentum exhaustion & re-accumulation mapping
Suggested Ranges:
CMO Length : 7 - 12
Reduced-Lag Length : 5 - 15
Smoothing : 10 - 20
Cooldown Bars : 5 - 15
Performance Characteristics
High Effectiveness:
Markets with directional pulses & clean pressure transitions
Trending phases with measurable pullbacks
Instruments with stable volatility cycles
Reduced Edge:
Choppy consolidations
Ultra-low volatility environments
Disclaimer
The Reduced-Lag Chande Momentum Oscillator is a professional-grade analytical tool. It is not predictive and carries no guaranteed profitability. Effectiveness depends on asset class, volatility regime, parameter selection, and disciplined execution. Any suggested application timeframes or recommended ranges are guidance only - they are not universally optimal and will not deliver consistent accuracy on every asset or market condition. BOSWaves recommends using it in conjunction with structure, liquidity, and momentum context.

Contango/Backwardation Monitor
This is an indicator to display the spread difference between two products. I designed it around VX1! and VX2! but any other two products can be chosen. It is a simple subtraction of VX2-VX1. I will go through the options first and what they do followed by what contango/backwardation is in my own words. You will need the data package for VX futures for the default version to work.
INPUTS
-Apply Smoothing: choose to apply smoothing or not.
-Smoothing Method: choose between SMA,EMA,WMA, etc.
-Line Width: Width of line if line is chosen style(can be changed in style section)
-Threshold 1-5: This is the level at which the line will change colors(defaults are for VX)
-Color 1-5: The color the line will change to when crossing threshold.
Towards Backwardation: Background color change when line is slanted down
Towards Contango: Background color change when line is slanted up
Bars to Confirm Trend: This is my method to cut down on background color changes. It is how many bars consecutive going back needed to change color.
STYLE
-All colors and whatnot can be changed here(threshold colors can be changed here or on the input page).
T1 Line-T5 line: These are simple horizontal lines that can be used to denote threshold areas or whatever you want.
Contango/Backwardation-These terms are used mostly with futures to define the calendar spread between two contracts. Contango is when that spread is is getting longer and backwardation is when that spread is closing. In terms of VIX futures, Contango would imply that volatility is stabilizing and the S and P will likely gain. Backwardation, woudl eb the opposite.
The most simple way to read this indicator with default settings- If the line is up, red, and the background is red, then you can assume S and P prices are going down. And if the opposite is true, then prices are likely going up.
Please feel free to ask any questions and I will do my best to answer them.

Gann Astronomical Turning PointsThis is a comprehensive Pine Script that implements W.D. Gann's astronomical theories to identify potential market turning points. Here's a detailed breakdown of the script:
Overview
The script identifies and displays astronomical events (sun angles, moon phases, and Mercury retrogrades) that Gann theorists believe correlate with market turning points. It also analyzes historical price performance following these events to provide statistical significance.
Key Components
1. Input Parameters
Date Range: Users can set the analysis period (start and end dates)
Display Options: Toggle visibility of different astronomical events and tables
Analysis Settings: Configure the lookback period for price change analysis (1-20 days)
2. Astronomical Calculations
The script includes several functions to calculate celestial positions:
getDaysSinceEpoch(t): Calculates days since January 1, 2000 (reference point)
getSunLongitude(t): Computes the Sun's position in the ecliptic (0-360°)
getMoonPhase(t): Determines the Moon's phase angle relative to the Sun
getMercuryLongitude(t): Calculates Mercury's position in the ecliptic
3. Gann Critical Angles (Sun Events)
The script identifies when the Sun reaches four critical angles that Gann considered significant:
0° Aries (Spring Equinox)
90° Cancer (Summer Solstice)
180° Libra (Fall Equinox)
270° Capricorn (Winter Solstice)
These are detected by tracking when the Sun's longitude crosses these specific angles.
4. Moon Phases
Four key moon phases are identified:
New Moon: Moon passes between Earth and Sun
First Quarter: Moon is 90° east of Sun
Full Moon: Moon is opposite the Sun
Last Quarter: Moon is 270° east of Sun
5. Mercury Retrograde Periods
The script detects when Mercury appears to move backward in its orbit:
Identifies start and end dates of retrograde motion
Displays these periods as highlighted zones on the chart
6. Price Change Analysis
For each astronomical event, the script:
Calculates the percentage price change over a user-defined lookback period
Categorizes changes as positive or negative
Stores this data for statistical analysis
7. Statistical Significance
The script calculates several metrics for each event type:
Average Price Change: Mean percentage change following events
Up/Down Ratio: Number of positive vs. negative changes
Accuracy Percentage: How often the dominant direction occurred
8. Visual Elements
The script includes multiple display components:
Event Labels
Sun Angles: Orange sun symbols displayed above price bars
Moon Phases: Moon phase emojis displayed below price bars
Mercury Retrograde: Red boxes highlighting the retrograde periods
Information Tables
Events Table: Shows upcoming and recent astronomical events
Significance Analysis Table: Displays statistical performance of each event type
Forecast Section: Identifies the next upcoming event and predicted direction
9. Forecasting Functionality
The script predicts market direction for the next astronomical event based on:
Historical average price change for that event type
Statistical accuracy of previous similar events
Color-coded forecast (green for bullish, red for bearish)
This script offers an interesting implementation of Gann's astronomical theories, but should be used as part of a broader analysis rather than as a standalone trading system.
Disclaimer: This indicator is for educational purposes only. Past performance does not guarantee future results. Always conduct your own research and risk assessment before trading.
