PlanDeFi: Adaptive Trend Ribbons [ATR+RSI]#### **Overview**
The **Crypto Half-Trend Pro ** is a trend-following indicator designed to identify bullish and bearish market conditions using a combination of **moving averages, volatility adjustments, and dynamic ATR bands**. This enhanced version improves on the traditional Half-Trend system by incorporating **EMA smoothing, volatility-based adjustments, and additional fakeout/reversal detection mechanisms**.
#### **Key Features**
✅ **Trend Detection:**
- Uses a combination of fast and slow moving averages (EMA/SMA) to determine trend direction.
- Implements **Hull Moving Average (HMA)** smoothing for better trend visualization.
✅ **Dynamic ATR Bands:**
- Adjusts bands based on market volatility using **RSI-based ATR multipliers**.
- Helps identify potential **breakouts and trend reversals**.
✅ **Fakeout & Reversal Detection:**
- Detects potential **fake breakouts** by analyzing price action against extended ATR bands.
- Identifies **early reversal signals** using price crossovers and volume confirmation.
✅ **Customizable Alerts & Visuals:**
- Built-in **buy & sell signals** for trend confirmation.
- Color-coded bullish/bearish trend lines and **fakeout warnings**.
- **TradingView alerts** for trend shifts and reversals.
#### **How It Works**
🔹 The indicator calculates a **smoothed trend line** using a Hull Moving Average on dynamic price levels.
🔹 ATR bands expand/contract dynamically based on **market volatility** to improve signal accuracy.
🔹 Trend direction is confirmed when price crosses the trend line **with volume confirmation**.
🔹 **Fakeouts** are detected when price temporarily exceeds extended bands but fails to hold momentum.
🔹 **Reversal signals** are generated when price breaks back into the ATR zone with volume spikes.
#### **How to Use It**
- 📈 **Buy Signal:** When price breaks above the trend line, confirmed by volume and crossover signals.
- 📉 **Sell Signal:** When price breaks below the trend line with confirmed bearish conditions.
- 🚨 **Reversal Warning:** If price sharply re-enters the ATR zone with volume confirmation, expect a potential trend shift.
- 🛑 **Fakeout Alert:** If price temporarily breaks resistance but closes back inside, it may be a false move.
#### **Ideal For**
✔️ Crypto & Forex traders looking for **dynamic trend signals**
✔️ Swing traders wanting to **avoid fakeouts & catch reversals**
✔️ Traders seeking a **customizable, volatility-adjusted trend system**
🚀 **Try PlanDeFi: Adaptive Trend Ribbons today and improve your trend analysis!**
Search in scripts for "crossover债券是什么"

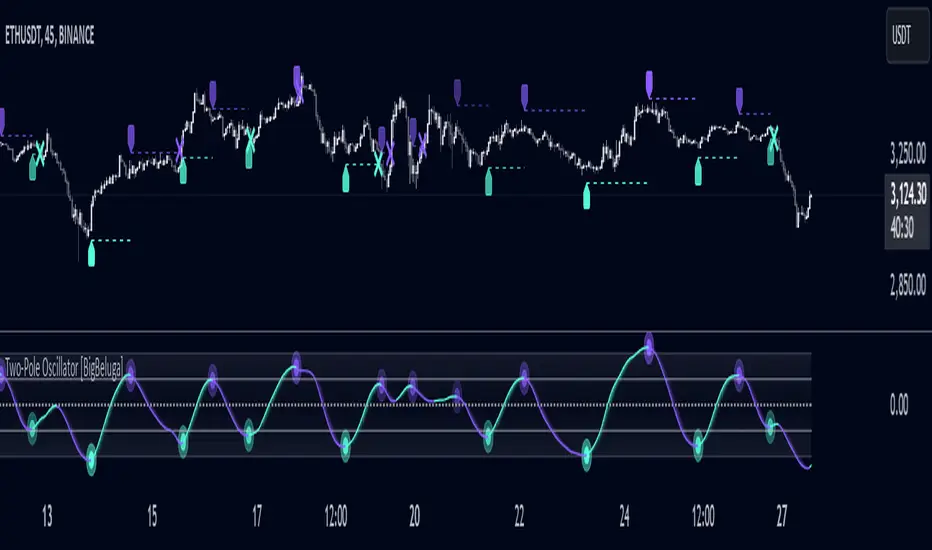
Two-Pole Oscillator [BigBeluga]
The Two-Pole Oscillator is an advanced smoothing oscillator designed to provide traders with precise market signals by leveraging deviation-based calculations combined with a unique two-pole filtering technique. It offers clear visual representation and actionable signals for smart trading decisions.
🔵Key Features:
Two-Pole Filtering: Smooths out the main oscillator signal to reduce noise, providing a cleaner and more reliable view of market momentum and trend strength.
// Two-pole smooth filter function
f_two_pole_filter(source, length) =>
var float smooth1 = na
var float smooth2 = na
alpha = 2.0 / (length + 1)
if na(smooth1)
smooth1 := source
else
smooth1 := (1 - alpha) * smooth1 + alpha * source
if na(smooth2)
smooth2 := smooth1
else
smooth2 := (1 - alpha) * smooth2 + alpha * smooth1
Deviation-Based Oscillator: Utilizes price deviations from the mean to generate dynamic signals, making it ideal for detecting overbought and oversold conditions.
float sma1 = ta.sma(close, 25)
float sma_n1 = ((close - sma1) - ta.sma(close - sma1, 25)) / ta.stdev(close - sma1, 25)
Signal Gradient Strength: Signals on the main oscillator line feature gradient coloring based on their proximity to the 0 level:
➔ Closer to 0: More transparent, indicating weaker signals.
➔ Closer to 1 or -1: Less transparent, highlighting stronger signals.
Level-Based Signal Validation: Parallel levels are plotted on the chart for each signal:
➔ If a level is crossed by price, the signal is invalidated, marked by an "X" at the invalidation point.
Trend Continuation
Invalidation Levels: Serve as potential stop-loss or trade-reversal zones, enabling traders to make more informed and disciplined trading decisions.
Dynamic Chart Plotting: Signals are plotted directly on the chart with corresponding levels, providing a comprehensive visual representation for easy interpretation.
🔵How It Works:
The oscillator calculates price deviation from a mean value and applies two-pole filtering to smooth the resulting signal.
Gradient-colored signals reflect their strength, with transparency indicating proximity to the 0 level on the oscillator scale.
Buy and sell signals are generated based on crossovers and crossunders of the oscillator line with a signal line.
If a level is crossed, the corresponding signal is marked with a "X" plotted on the chart at the crossover point.
🔵Use Cases:
Detecting overbought or oversold market conditions with a smoother, noise-free oscillator.
Using invalidation levels to set clear stop-loss or trade exit points.
Identifying strong momentum signals and filtering out weaker, less reliable ones.
Combining oscillator signals with price action for more precise trade entries and exits.
This indicator is perfect for traders seeking a refined approach to oscillator analysis, combining signal strength visualization with actionable invalidation levels to enhance trading precision and strategy.
Waldo RSI Overlay :oWaldo RSI Overlay :o Indicator Guide
Welcome to the guide for the Waldo RSI Overlay :o indicator on TradingView. This tool enhances your trading analysis through RSI-based overlays for trend analysis, divergence detection, and breakout/breakdown signals when used with its companion indicator, Waldo RSI :o.
Key Features:
RSI Overlay:
• RSI Source: Choose from:
o ON RSI: Uses the RSI values directly to detect pivots, focusing on RSI highs and lows for trend analysis.
o ON HIGH, ON CLOSE, ON LOW, ON OPEN:
These options base pivot detection on price action at those specific points, offering an alternative market structure view.
• RSI Settings:
o Source: Default is (H+L)/2, but you can select any price for RSI calculation.
o Length: Default RSI length is 7, which you can adjust for sensitivity.
Trend Lines:
• Show Trend Lines: Toggle to display trend lines based on pivot points.
• Zigzag Length: Sets the sensitivity of pivot point detection.
• Confirm Length: Ensures the validity of pivot points (default is 3).
• Colors: Customize colors for Higher Highs (HH), Lower Highs (LH), Higher Lows (HL), and Lower Lows (LL).
• Transparency and Line Width: Control how trend lines and fills appear.
• Label Size: Adjust the size of labels identifying pivot points.
Divergences:
• Classic Divergences:
o Show Classic Div: Enable to highlight regular divergences where price and RSI move in opposite directions.
o Colors: Define colors for bullish and bearish divergence lines and labels.
o Transparency and Line Width: Adjust the visual impact of divergence signals.
• Hidden Divergences:
o Similar settings as classic, but these highlight divergences indicating trend continuation.
Breakout/Breakdown:
• Show Breakout/Breakdown: When activated, this feature signals when the price breaks through previous highs or lows. To activate these breakouts, you need the companion indicator Waldo RSI :o, select the SRC in the External section, and select the crossovers for each one.
This combination provides RSI confirmation for breakout/breakdown events.
Overbought/Oversold Zones:
• Show Overbought and Oversold Zones: Bars are colored when RSI exceeds 70 (purple) or falls below 30 (blue), indicating potential market extremes.
Moving Averages (Optional):
• Show Moving Averages: Option to overlay two moving averages for trend confirmation.
• Source, Type, Length: Customize each MA's configuration.
Ghost Lines (Optional):
• Ghost Lines: When enabled, trend lines extend for only a specified period (Ghost Length) instead of indefinitely.
How to Use the Indicator:
1. Setup:
o Configure RSI settings by choosing the RSI Source and adjusting the RSI Length to suit your trading style.
o Set the Zigzag Length and Confirm Length for trend line sensitivity based on market volatility.
2. Trend Analysis:
o Look at the colored horizontal lines and fills for HH, LH, HL, LL to discern market structure and potential reversal points.
3. Divergence Detection:
o Identify divergences where price and RSI diverge. Regular divergences might signal trend exhaustion, while hidden ones could indicate trend persistence.
4. Breakout/Breakdown Signals:
o Ensure you have both the Waldo RSI Overlay :o and Waldo RSI :o indicators applied. Green triangles below bars signal breakouts; red ones above indicate breakdowns, based on price movement with RSI confirmation from the companion indicator.
5. Overbought/Oversold:
o Use these colored zones to spot potential momentum shifts or reversal areas.
6. Moving Averages on RSI:
o If used, these can help confirm trends or identify crossover signals for additional trade confirmation.
7. Ghost Lines:
o For a less cluttered chart, enable this to limit how far trend lines extend.
Tips for Usage:
• Always combine this indicator with other analytical tools for better confirmation. No single indicator should guide all decisions.
• Adjust settings according to the asset's behavior and your trading timeframe.
• Regularly review your settings as market dynamics change.
Remember, trading involves risk, and past performance doesn't predict future outcomes. Use this indicator within a comprehensive trading strategy.

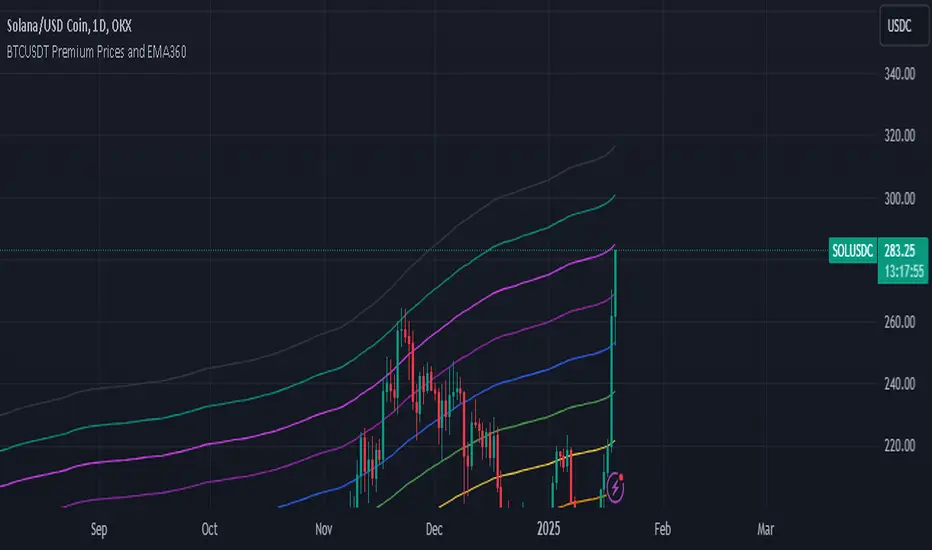
BTCUSDT Premium Prices and EMA360The Exponential Moving Average (EMA) is a widely used technical indicator in trading that helps analysts and traders identify price trends over a specified period. Unlike the Simple Moving Average (SMA), which treats all data points equally, the EMA gives more weight to recent prices, making it more sensitive to recent price movements. This characteristic allows the EMA to react quickly to changes in market conditions, providing timely insights into potential trends.
## **Key Features of EMA**
- **Weighting Mechanism**: The EMA uses a smoothing factor that emphasizes recent price data while still considering older observations. This leads to a more dynamic representation of price trends compared to the SMA .
- **Trend Identification**: The EMA is particularly effective for identifying the direction of a stock's price movement. A rising EMA indicates an uptrend, while a declining EMA suggests a downtrend. Traders often use multiple EMAs with different periods to spot crossovers, which can signal potential buy or sell opportunities .
- **Calculation**: To calculate the EMA, one typically starts with an initial Simple Moving Average (SMA) for the first period, then applies the following formula for subsequent periods:
$$
\text{EMA}_{\text{today}} = \left(\text{Price}_{\text{today}} \times \left(\frac{2}{N + 1}\right)\right) + \left(\text{EMA}_{\text{yesterday}} \times \left(1 - \frac{2}{N + 1}\right)\right)
$$
Where $$N$$ is the number of periods .
## **Applications in Trading**
Traders utilize the EMA in various strategies, including:
- **Crossover Strategies**: By monitoring two EMAs of different lengths (e.g., 50-day and 200-day), traders can identify bullish or bearish signals when one crosses above or below the other .
- **Combining Indicators**: The EMA can be combined with other indicators like the Relative Strength Index (RSI) or Moving Average Convergence Divergence (MACD) for enhanced decision-making .
In summary, the Exponential Moving Average is a crucial tool for traders seeking to navigate market trends effectively. Its ability to prioritize recent data makes it an essential component of many trading strategies, providing insights that can lead to informed investment decisions.
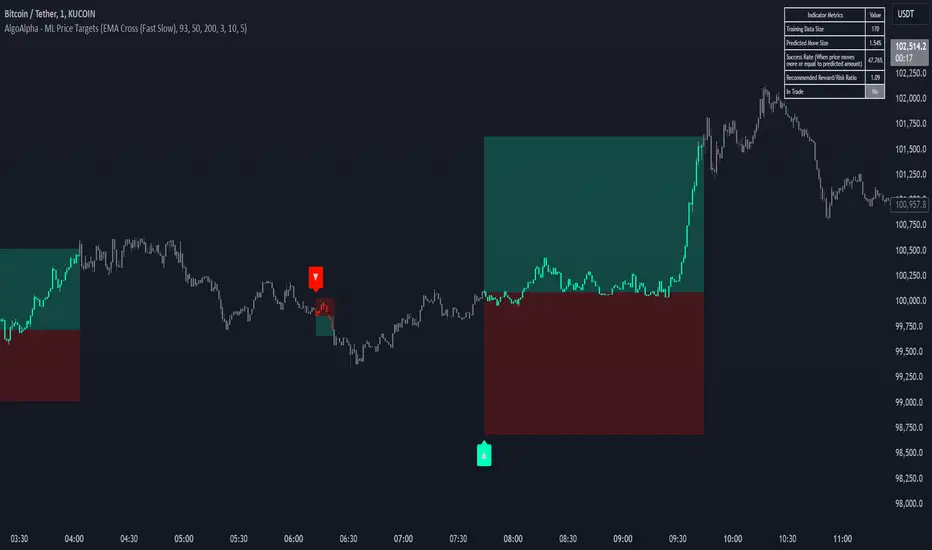
Machine Learning Price Target Prediction Signals [AlgoAlpha]Introducing the Machine Learning Price Target Predictions, a cutting-edge trading tool that leverages kernel regression to provide accurate price targets and enhance your trading strategy. This indicator combines trend-based signals with advanced machine learning techniques, offering predictive insights into potential price movements. Perfect for traders looking to make data-driven decisions with confidence.
What is Kernel Regression and How It Works
Kernel regression is a non-parametric machine learning technique that estimates the relationship between variables by weighting data points based on their similarity to a given input. The similarity is determined using a kernel function, such as the Gaussian (RBF) kernel, which assigns higher weights to closer data points and progressively lower weights to farther ones. This allows the model to make smooth and adaptive predictions, balancing recent data and historical trends.
Key Features
🎯 Predictive Price Targets : Uses kernel regression to estimate the magnitude of price movements.
📈 Dynamic Trend Analysis : Multiple trend detection methods, including EMA crossovers, Hull Moving Average, and SuperTrend.
🔧 Customizable Settings : Adjust bandwidth for kernel regression and tweak trend indicator parameters to suit your strategy.
📊 Visual Trade Levels : Displays take-profit and stop-loss levels directly on the chart with customizable colors.
📋 Performance Metrics : Real-time win rate, recommended risk-reward ratio, and training data size displayed in an on-chart table.
🔔 Alerts : Get notified for new trends, take-profit hits, and stop-loss triggers.
How to Use
🛠 Add the Indicator : Add it to your favorites and apply it to your chart. Configure the trend detection method (SuperTrend, HMA, or EMA crossover) and other parameters based on your preferences.
📊 Analyze Predictions : Observe the predicted move size, recommended risk-reward ratio, and trend direction. Use the displayed levels for trade planning.
🔔 Set Alerts : Enable alerts for trend signals, take-profit hits, or stop-loss triggers to stay informed without constant monitoring.
How It Works
The indicator calculates features such as price volatility, relative strength, and trend signals, which are stored during training periods. When a trend change is detected, the kernel regression model predicts the likely price move based on these features. Predictions are smoothed using the specified bandwidth to avoid overfitting while ensuring timely responses to feature changes. Visualized take-profit and stop-loss levels help traders optimize risk management. Real-time metrics like win rate and recommended risk-reward ratios provide actionable insights for decision-making.
[blackcat] L2 Waveband Trading█ OVERVIEW
The Waveband Trading script calculates trading signals based on a modified Relative Strength Index (RSI)-like system combined with specific price action criteria. It plots two lines representing different smoothed RSI-like indicators and marks potential buying opportunities labeled as "S" for stronger trends and "B" for weaker but still favorable ones.
█ LOGICAL FRAMEWORK
The script begins by defining the waveband_trading_signals function which computes RSI-like metrics and determines buy signals under certain conditions. The main sections include input parameter definitions, function calls, data processing within the function, and plot commands for visual representation. Data flows from historical OHLCV data to various technical computations like EMAs and SMAs before being evaluated against user-defined thresholds to generate trade signals.
█ CUSTOM FUNCTIONS
Waveband Trading Signals:
• Purpose: Computes waveband trading signals using a customized version of the RSI indicator.
• Parameters:
— overboughtLevel: Threshold level indicating market overbought condition.
— oversoldLevel: Threshold level indicating market oversold condition.
— strongHoldLevel: Strong hold condition threshold between neutral and overbought states.
— moderateHoldLevel: Moderate hold condition threshold below strong hold level.
• [b>Returns: A tuple containing:
— k: Smoothed RSI-like metric.
— d: Further smoothed version of 'k'.
— buySignalStrong: Boolean indicating a strong trend buy signal.
— buySignalWeak: Boolean indicating a weak but promising buy signal.
█ KEY POINTS AND TECHNIQUES
• Utilizes EMA and SMA functions to smooth out price variations effectively.
• Employs crossover logic between fast ('k') and slow ('d') indicators to identify entry points.
• Incorporates volume checks ensuring increasing interest in trades aligns with upwards momentum.
• Leverages predefined threshold levels allowing flexibility to adapt to varying market conditions.
• Uses the new labeling feature ( label.new ) introduced in Pine Script v5 for marking significant chart events visually.
█ EXTENDED KNOWLEDGE AND APPLICATIONS
Potential enhancements could involve incorporating additional filters such as MACD crossovers or Fibonacci retracement levels alongside optimizing current conditions via backtesting. This technique might also prove useful in other strategies requiring robust confirmation methods beyond simple price action; alternatively, adapting it into a more automated form for execution on exchanges offering API access. Understanding key functionalities like relative strength assessment, smoothed averaging techniques, and conditional buy/sell rules enriches one’s toolkit when developing complex trading algorithms tailored specifically toward personal investment philosophies.

[blackcat] L2 Enhanced MACD Trend█ OVERVIEW
The Enhanced MACD Trend script combines traditional Moving Average Convergence Divergence (MACD) analysis with On-Balance Volume (OBV) insights to provide traders with a comprehensive understanding of market trends. By examining both price momentum and volume fluctuations, this tool aids in identifying potential upward or downward market transitions.
█ LOGICAL FRAMEWORK
Initially, the script prompts users to configure fundamental parameters such as the speed of moving averages. It subsequently utilizes a specialized auxiliary function named calculate_macd_obv_signals to perform intricate computations. This function calculates the discrepancy between two distinct types of moving averages (captured via MACD analysis), evaluates the direction of capital inflows and outflows within securities (using OBV), and applies smoothing techniques to mitigate undue influence from minor fluctuations. Ultimately, visual representations of these calculations are rendered on an additional chart pane for enhanced interpretability.
█ CUSTOM FUNCTIONS
Function: calculate_macd_obv_signals
• Purpose: Determines critical aspects associated with MACD and OBV.
• Parameters:
• fastLength (int): Dictates the responsiveness of the shorter Exponential Moving Average (EMA) to price variations.
• slowLength (int): Specifies the reactivity of the longer EMA.
• signalSmoothing (int): Defines the degree of smoothness applied to the divergence between EMAs.
• Functionality:
• macd_diff: Illustrates whether price increases have accelerated relative to previous levels or decelerated, providing insight into existing momentum.
• macd_signal_line: Smoothens macd_diff values, serving akin to a trailing indicator for macd_diff.
• macd_histogram: Visually accentuates disparities between macd_diff and macd_signal_line employing color-coded bars, facilitating identification of significant divergences.
• obv_signal: Represents a refined variant of short-term OBV concentrating solely on periods characterized by elevated buying interest, aiding in reduction of extraneous signals.
• moving_average_short: Analyzes recent closing prices across several sessions to corroborate burgeoning bullish or bearish tendencies.
• Returns: An array encompassing .
█ KEY POINTS AND TECHNIQUES
Advanced Features: Employs sophisticated functions including ta.ema() and ta.sma(), enabling accurate calculation of EMAs and SMAs respectively, thus enhancing precision in trend detection.
Optimization Techniques: Incorporates customizable inputs (input.int) permitting strategic adjustments alongside scrutiny of escalating or declining volumes to accurately gauge genuine sentiment shifts while discounting insignificant anomalies.
Best Practices: Maintains separation between algorithmic processes and graphical outputs, preserving organizational clarity; hence simplifying debugging efforts and future enhancements.
Unique Approaches: Integrates multifaceted assessments simultaneously – amalgamating candlestick formations and volumetric activities – offering a holistic perspective instead of reliance on singular indicators. Consequently, delivers astute recommendations grounded in diverse analytical underpinnings rather than speculative forecasts.
█ EXTENDED KNOWLEDGE AND APPLICATIONS
Potential Modifications:
1 — Implement automated alert mechanisms signaling crossover events pinpointing optimal buy/sell junctures to fine-tune timing preemptively minimizing losses proactively.
2 — Enable user customization of sensitivity criteria governing trigger intensity thereby eliminating trivial aberrations and emphasizing substantial patterns exclusively.
Application Scenarios:
Beneficial for high-frequency trading aiming to capitalize on fleeting price movements swiftly. Suitable for dynamic environments necessitating rapid responses due to frequent market volatility demanding prompt reactions. Perfect for individuals engaging in regular transactions seeking unparalleled accuracy navigating fluctuating circumstances ensuring consistent profitability amidst disturbances maintaining steady yields irrespective of upheavals.
Related Concepts:
Contemplate interactions among oscillators (such as MACD) and volume metrics detecting instances wherein they oppose each other (indicative of divergences) or concur (signaling crossovers). Profound comprehension of these interrelationships substantially refines trading strategies integrating broader economic factors, seasonal influences guiding overarching plans resulting in heightened predictive capabilities elevating trading effectiveness leveraging cumulative information transforming unprocessed statistics into actionable intelligence empowering informed decisions advancing confidently toward objectives effortlessly scaling achievements seamlessly realizing aspirations effortlessly.

[blackcat] L3 Counter Peacock Spread█ OVERVIEW
The script titled " L3 Counter Peacock Spread" is an indicator designed for use in TradingView. It calculates and plots various moving averages, K lines derived from these moving averages, additional simple moving averages (SMAs), weighted moving averages (WMAs), and other technical indicators like slope calculations. The primary function of the script is to provide a comprehensive set of visual tools that traders can use to identify trends, potential support/resistance levels, and crossover signals.
█ LOGICAL FRAMEWORK
Input Parameters:
There are no explicit input parameters defined; all variables are hardcoded or calculated within the script.
Calculations:
• Moving Averages: Calculates Simple Moving Averages (SMA) using ta.sma.
• Slope Calculation: Computes the slope of a given series over a specified period using linear regression (ta.linreg).
• K Lines: Defines multiple exponentially adjusted SMAs based on a 30-period MA and a 1-period MA.
• Weighted Moving Average (WMA): Custom function to compute WMAs by iterating through price data points.
• Other Indicators: Includes Exponential Moving Average (EMA) for momentum calculation.
Plotting:
Various elements such as MAs, K lines, conditional bands, additional SMAs, and WMAs are plotted on the chart overlaying the main price action.
No loops control the behavior beyond those used in custom functions for calculating WMAs. Conditional statements determine the coloring of certain plot lines based on specific criteria.
█ CUSTOM FUNCTIONS
calculate_slope(src, length) :
• Purpose: To calculate the slope of a time-series data point over a specified number of periods.
• Functionality: Uses linear regression to find the current and previous slopes and computes their difference scaled by the timeframe multiplier.
• Parameters:
– src: Source of the input data (e.g., closing prices).
– length: Periodicity of the linreg calculation.
• Return Value: Computed slope value.
calculate_ma(source, length) :
• Purpose: To calculate the Simple Moving Average (SMA) of a given source over a specified period.
• Functionality: Utilizes TradingView’s built-in ta.sma function.
• Parameters:
– source: Input data series (e.g., closing prices).
– length: Number of bars considered for the SMA calculation.
• Return Value: Calculated SMA value.
calculate_k_lines(ma30, ma1) :
• Purpose: Generates multiple exponentially adjusted versions of a 30-period MA relative to a 1-period MA.
• Functionality: Multiplies the 30-period MA by coefficients ranging from 1.1 to 3 and subtracts multiples of the 1-period MA accordingly.
• Parameters:
– ma30: 30-period Simple Moving Average.
– ma1: 1-period Simple Moving Average.
• Return Value: Returns an array containing ten different \u2003\u2022 "K line" values.
calculate_wma(source, length) :
• Purpose: Computes the Weighted Moving Average (WMA) of a provided series over a defined period.
• Functionality: Iterates backward through the last 'n' bars, weights each bar according to its position, sums them up, and divides by the total weight.
• Parameters:
– source: Price series to average.
– length: Length of the lookback window.
• Return Value: Calculated WMA value.
█ KEY POINTS AND TECHNIQUES
• Advanced Pine Script Features: Utilization of custom functions for encapsulating complex logic, leveraging TradingView’s library functions (ta.sma, ta.linreg, ta.ema) for efficient computations.
• Optimization Techniques: Efficient computation of K lines via pre-calculated components (multiples of MA30 and MA1). Use of arrays to store intermediate results which simplifies plotting.
• Best Practices: Clear separation between calculation and visualization sections enhances readability and maintainability. Usage of color.new() allows dynamic adjustments without hardcoding colors directly into plot commands.
• Unique Approaches: Introduction of K lines provides an alternative representation of trend strength compared to traditional MAs. Implementation of conditional band coloring adds real-time context to existing visual cues.
█ EXTENDED KNOWLEDGE AND APPLICATIONS
Potential Modifications/Extensions:
• Adding more user-defined inputs for lengths of MAs, K lines, etc., would make the script more flexible.
• Incorporating alert conditions based on crossovers between key lines could enhance automated trading strategies.
Application Scenarios:
• Useful for both intraday and swing trading due to the combination of short-term and long-term MAs along with trend analysis via slopes and K lines.
• Can be integrated into larger systems combining this indicator with others like oscillators or volume-based metrics.
Related Concepts:
• Understanding how linear regression works internally aids in grasping the slope calculation.
• Familiarity with WMA versus SMA helps appreciate why different types of averaging might be necessary depending on market dynamics.
• Knowledge of candlestick patterns can complement insights gained from this indicator.

IU EMA Channel StrategyIU EMA Channel Strategy
Overview:
The IU EMA Channel Strategy is a simple yet effective trend-following strategy that uses two Exponential Moving Averages (EMAs) based on the high and low prices. It provides clear entry and exit signals by identifying price crossovers relative to the EMAs while incorporating a built-in Risk-to-Reward Ratio (RTR) for effective risk management.
Inputs ( Settings ):
- RTR (Risk-to-Reward Ratio): Define the ratio for risk-to-reward (default = 2).
- EMA Length: Adjust the length of the EMA channels (default = 100).
How the Strategy Works
1. EMA Channels:
- High-based EMA: EMA calculated on the high price.
- Low-based EMA: EMA calculated on the low price.
The area between these two EMAs creates a "channel" that visually highlights potential support and resistance zones.
2. Entry Rules:
- Long Entry: When the price closes above the high-based EMA (crossover).
- Short Entry: When the price closes below the low-based EMA (crossunder).
These entries ensure trades are taken in the direction of momentum.
3. Stop Loss (SL) and Take Profit (TP):
- Stop Loss:
- For long positions, the SL is set at the previous bar's low.
- For short positions, the SL is set at the previous bar's high.
- Take Profit:
- TP is automatically calculated using the Risk-to-Reward Ratio (RTR) you define.
- Example: If RTR = 2, the TP will be 2x the risk distance.
4. Exit Rules:
- Positions are closed at either the stop loss or the take profit level.
- The strategy manages exits automatically to enforce disciplined risk management.
Visual Features
1. EMA Channels:
- The high and low EMAs are dynamically color-coded:
- Green: Price is above the EMA (bullish condition).
- Red: Price is below the EMA (bearish condition).
- The area between the EMAs is shaded for better visual clarity.
2. Stop Loss and Take Profit Zones:
- SL and TP levels are plotted for both long and short positions.
- Zones are filled with:
- Red: Stop Loss area.
- Green: Take Profit area.
Be sure to manage your risk and position size properly.

3 EMA + RSI with Trail Stop [Free990] (LOW TF)This trading strategy combines three Exponential Moving Averages (EMAs) to identify trend direction, uses RSI to signal exit conditions, and applies both a fixed percentage stop-loss and a trailing stop for risk management. It aims to capture momentum when the faster EMAs cross the slower EMA, then uses RSI thresholds, time-based exits, and stops to close trades.
Short Explanation of the Logic
Trend Detection: When the 10 EMA crosses above the 20 EMA and both are above the 100 EMA (and the current price bar closes higher), it triggers a long entry signal. The reverse happens for a short (the 10 EMA crosses below the 20 EMA and both are below the 100 EMA).
RSI Exit: RSI crossing above a set threshold closes long trades; crossing below another threshold closes short trades.
Time-Based Exit: If a trade is in profit after a set number of bars, the strategy closes it.
Stop-Loss & Trailing Stop: A fixed stop-loss based on a percentage from the entry price guards against large drawdowns. A trailing stop dynamically tightens as the trade moves in favor, locking in potential gains.
Detailed Explanation of the Strategy Logic
Exponential Moving Average (EMA) Setup
Short EMA (out_a, length=10)
Medium EMA (out_b, length=20)
Long EMA (out_c, length=100)
The code calculates three separate EMAs to gauge short-term, medium-term, and longer-term trend behavior. By comparing their relative positions, the strategy infers whether the market is bullish (EMAs stacked positively) or bearish (EMAs stacked negatively).
Entry Conditions
Long Entry (entryLong): Occurs when:
The short EMA (10) crosses above the medium EMA (20).
Both EMAs (short and medium) are above the long EMA (100).
The current bar closes higher than it opened (close > open).
This suggests that momentum is shifting to the upside (short-term EMAs crossing up and price action turning bullish). If there’s an existing short position, it’s closed first before opening a new long.
Short Entry (entryShort): Occurs when:
The short EMA (10) crosses below the medium EMA (20).
Both EMAs (short and medium) are below the long EMA (100).
The current bar closes lower than it opened (close < open).
This indicates a potential shift to the downside. If there’s an existing long position, that gets closed first before opening a new short.
Exit Signals
RSI-Based Exits:
For long trades: When RSI exceeds a specified threshold (e.g., 70 by default), it triggers a long exit. RSI > short_rsi generally means overbought conditions, so the strategy exits to lock in profits or avoid a pullback.
For short trades: When RSI dips below a specified threshold (e.g., 30 by default), it triggers a short exit. RSI < long_rsi indicates oversold conditions, so the strategy closes the short to avoid a bounce.
Time-Based Exit:
If the trade has been open for xBars bars (configurable, e.g., 24 bars) and the trade is in profit (current price above entry for a long, or current price below entry for a short), the strategy closes the position. This helps lock in gains if the move takes too long or momentum stalls.
Stop-Loss Management
Fixed Stop-Loss (% Based): Each trade has a fixed stop-loss calculated as a percentage from the average entry price.
For long positions, the stop-loss is set below the entry price by a user-defined percentage (fixStopLossPerc).
For short positions, the stop-loss is set above the entry price by the same percentage.
This mechanism prevents catastrophic losses if the market moves strongly against the position.
Trailing Stop:
The strategy also sets a trail stop using trail_points (the distance in price points) and trail_offset (how quickly the stop “catches up” to price).
As the market moves in favor of the trade, the trailing stop gradually tightens, allowing profits to run while still capping potential drawdowns if the price reverses.
Order Execution Flow
When the conditions for a new position (long or short) are triggered, the strategy first checks if there’s an opposite position open. If there is, it closes that position before opening the new one (prevents going “both long and short” simultaneously).
RSI-based and time-based exits are checked on each bar. If triggered, the position is closed.
If the position remains open, the fixed stop-loss and trailing stop remain in effect until the position is exited.
Why This Combination Works
Multiple EMA Cross: Combining 10, 20, and 100 EMAs balances short-term momentum detection with a longer-term trend filter. This reduces false signals that can occur if you only look at a single crossover without considering the broader trend.
RSI Exits: RSI provides a momentum oscillator view—helpful for detecting overbought/oversold conditions, acting as an extra confirmation to exit.
Time-Based Exit: Prevents “lingering trades.” If the position is in profit but failing to advance further, it takes profit rather than risking a trend reversal.
Fixed & Trailing Stop-Loss: The fixed stop-loss is your safety net to cap worst-case losses. The trailing stop allows the strategy to lock in gains by following the trade as it moves favorably, thus maximizing profit potential while keeping risk in check.
Overall, this approach tries to capture momentum from EMA crossovers, protect profits with trailing stops, and limit risk through both a fixed percentage stop-loss and exit signals from RSI/time-based logic.

True Range Trend StrengthThis script is designed to analyze trend strength using True Range calculations alongside Donchian Channels and smoothed moving averages. It provides a dynamic way to interpret market momentum, trend reversals, and anticipate potential entry points for trades.
Key Functionalities:
Trend Strength Oscillator:
Calculates trend strength based on the difference between long and short momentum derived from ATR (Average True Range) adjusted stop levels.
Smooths the trend strength using a simple moving average for better readability.
Donchian Channels on Trend Strength Oscillator:
Plots upper and lower Donchian Channels on the smoothed trend strength oscillator.
Traders can use these levels to anticipate breakout points and determine the strength of a trend.
Zero-Cross Shading:
Highlights bullish and bearish zones with shaded backgrounds:
Green for bullish zones where smoothed trend strength is above zero.
Red for bearish zones where smoothed trend strength is below zero.
Moving Averages for Oscillator:
Overlays fast and slow moving averages on the oscillator to provide crossover signals:
Fast MA Cross Above Slow MA: Indicates bullish momentum.
Fast MA Cross Below Slow MA: Indicates bearish momentum.
Alerts:
Alerts are available for MA crossovers, allowing traders to receive timely notifications about potential trend reversals or continuation signals.
Anticipating Entries with Donchian Channels:
The integration of Donchian Channels offers an edge in anticipating excellent trade entries.
Traders can use the oscillator's position relative to the channels to gauge oversold/overbought conditions or potential breakouts.
Use Case:
This script is particularly useful for traders looking to:
Identify the strength and direction of market trends.
Time entries and exits based on dynamic Donchian Channel levels and trend strength analysis.
Incorporate moving averages and visual cues for better decision-making.

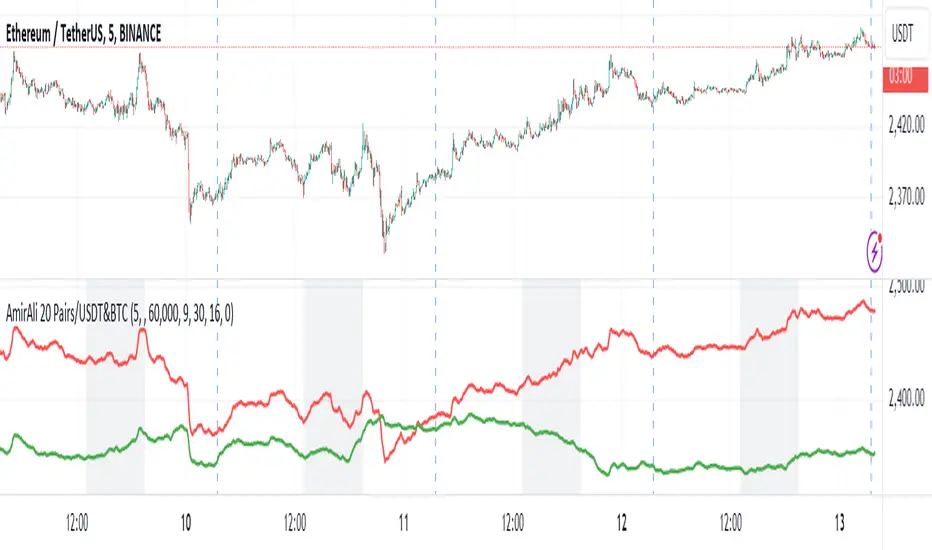
AmirAli 20 Pairs/USDT&BTCThis TradingView indicator, titled "20 Pairs/USDT&BTC," is designed to analyze and display the Exponential Moving Averages (EMAs) of various cryptocurrency pairs against USDT and BTC. Here's a detailed breakdown of its features, functionality, and usage:
Key Features:
Pairs Display: The indicator allows users to select which cryptocurrency pairs they wish to display on the chart. The available options include popular cryptocurrencies such as Ethereum (ETH), Binance Coin (BNB), Solana (SOL), Dogecoin (DOGE), Ripple (XRP), Litecoin (LTC), Polkadot (DOT), Avalanche (AVAX), Uniswap (UNI), Chainlink (LINK), Cardano (ADA), Cosmos (ATOM), Filecoin (FIL), Stellar (XLM), VeChain (VET), Enjin (ENJ), Celo (CELO), Hedera (HBAR), and Sandbox (SAND).
Dynamic Price Retrieval: For each selected pair, the indicator retrieves the closing prices for both USDT and BTC from Binance. This is done using the request.security function, which fetches real-time data.
EMA Calculation: The indicator calculates and plots the EMA for each cryptocurrency pair over a user-defined length, allowing traders to identify trends and potential buy/sell signals based on price movements relative to their EMAs.
User Customization: Users can customize several parameters, including the time frame for data retrieval, EMA length, and the visibility of each pair.
Market Hours Visualization: The indicator highlights the trading hours with a gray background, helping users identify when the market is active.
How to Use the Indicator:
Adding the Indicator: To use the indicator, add it to your TradingView chart by searching for "20 Pairs/USDT&BTC" in the public library or by pasting the provided Pine Script code into a new indicator script.
Select Pairs: Enable or disable specific cryptocurrency pairs in the input options at the top of the script. For example, if you want to analyze ETH and ADA, ensure that the respective boxes are checked.
Adjust Time Frame: Set the time frame for the indicator. You can choose any time frame or leave it blank to use the current chart's time frame.
Set EMA Length: Choose the length for the EMA calculation based on your trading strategy. A shorter EMA (e.g., 5) reacts more quickly to price changes, while a longer EMA (e.g., 20) smooths out price fluctuations.
Observe Trends: Monitor the plotted EMAs for the selected pairs. Crossovers of the price with the EMA can indicate potential buy or sell signals. For instance, if the price crosses above the EMA, it may signal a bullish trend, whereas a crossover below could indicate a bearish trend.
Consider Market Hours: Pay attention to the gray background during U.S. trading hours, as this may indicate higher volatility and trading opportunities.
Conclusion
The "20 Pairs/USDT&BTC" indicator is a powerful tool for cryptocurrency traders looking to analyze multiple pairs simultaneously. By providing a visual representation of EMAs, it aids in identifying trends and potential trading opportunities in a user-friendly manner. Make sure to adapt the settings according to your trading strategy and market conditions for optimal results.
Amir Hasankhah & Ali Beyki
RSI & Volume Impact Analyzer Ver.1.00Description:
The RSI VOL Score indicator combines the Relative Strength Index (RSI) and volume data through a mathematical calculation to assist traders in identifying and confirming potential trend reversals and continuations. By leveraging both momentum (RSI) and volume data, this indicator provides a more comprehensive view of market strength compared to using RSI or volume alone.
How It Works:
This indicator calculates a score by comparing the RSI against its moving average, adjusted by the volume data. The resulting score quantifies market momentum and strength. When the score crosses its signal line, it may indicate key moments where the market shifts between bullish and bearish trends, potentially helping traders spot these changes earlier.
Calculation Methods:
The RSI VOL Score allows users to select between several calculation methods to suit their strategy:
SMA (Simple Moving Average): Provides a balanced smoothing approach.
EMA (Exponential Moving Average): Reacts more quickly to recent price changes, offering faster signals.
VWMA (Volume Weighted Moving Average): Emphasizes high-volume periods, focusing on stronger market moves.
WMA (Weighted Moving Average): Applies greater weight to recent data for a more responsive signal.
What the Indicator Plots:
Score Line: Represents a combined metric based on RSI and volume, helping traders gauge the overall strength of the trend.
Signal Line: A smoothed version of the score that helps traders identify potential trend changes. Bullish signals occur when the score crosses above the signal line, while bearish signals occur when the score drops below.
Key Features:
Trend Identification: The score and signal line crossovers can help confirm emerging bullish or bearish trends, allowing traders to act on upward or downward momentum.
Customizable Settings: Traders can adjust the lengths of the RSI and signal line and choose between different moving averages (SMA, EMA, VWMA, WMA) to tailor the indicator to their trading style.
Timeframe-Specific: The indicator works within the selected timeframe, ensuring accurate trend analysis based on the current market context.
Practical Use Cases:
Trending Markets: In trending markets, this indicator helps confirm bullish or bearish signals by validating price moves with volume. Traders can use the crossover of the score and signal line as a guide for entering or exiting trades based on trend strength.
Ranging Markets: In ranging markets, the indicator helps filter out false signals by confirming if price movements are backed by volume, making it a useful tool for traders looking to avoid entering during weak or uncertain market conditions.
Interpreting the Score and Signal Lines:
Bullish Signal: A bullish signal occurs when the score crosses above the signal line, indicating a potential upward trend in momentum and price.
Bearish Signal: A bearish signal is generated when the score crosses below the signal line, suggesting a potential downward trend or weakening market momentum.
By mathematically combining RSI and volume data into a single trend score, the RSI VOL Score indicator provides traders with a powerful tool for identifying trend shifts early and making more confident trading decisions.
Important Note:
The signals generated by this indicator should be interpreted in conjunction with other analysis tools. It is always advisable to confirm signals before making any trading decisions.
Disclaimer:
This indicator is designed to assist traders in their decision-making process and does not provide financial advice. The creators of this tool are not responsible for any financial losses or trading decisions made based on its signals. Trading involves significant risk, and users should seek professional advice or conduct their own research before making any trading decisions.

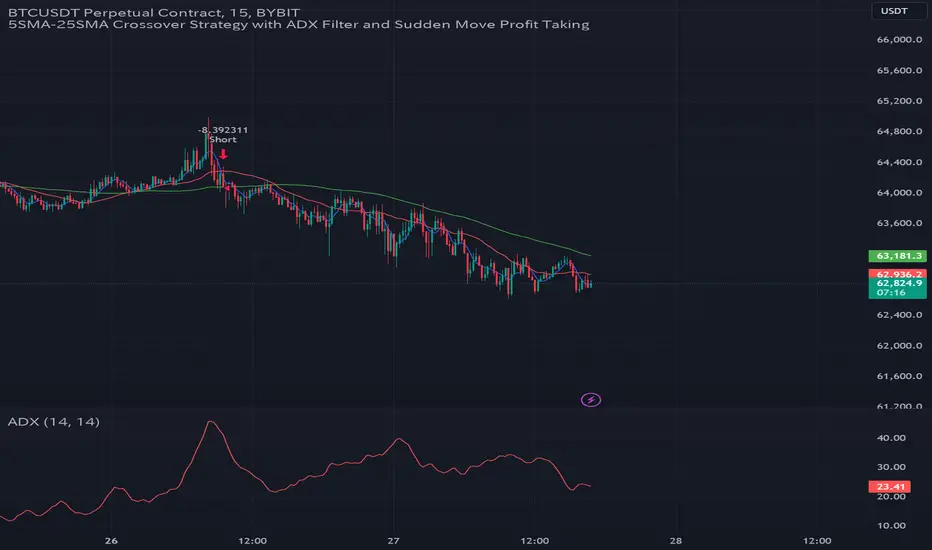
GC Strategy with Trend Filter and Sudden Move Profit TakingBYBIT:BTCUSDT.P 15M
Situation Assessment with Three Moving Averages
The strategy uses the crossover of the 5SMA and 25SMA as entry signals.
Additionally, the 75SMA is used as a filter. Long entries are only allowed when the price is above the 75SMA, and short entries are only allowed when the price is below the 75SMA.
ADX Filter
The Average Directional Index (ADX) is used to check the strength of the trend. Entry signals are only activated when the ADX is above 20. This ensures that trades are only executed when the trend is strong.
Sudden Move Detection
The strategy detects sudden price movements. If a sudden move occurs, the position is closed to lock in profits.
Entry
Long Entry: When the 5SMA crosses above the 25SMA, the price is above the 75SMA, and the ADX is above 20.
Short Entry: When the 5SMA crosses below the 25SMA, the price is below the 75SMA, and the ADX is above 20.
Exit
Positions are closed if a sudden move occurs. Positions are also closed if an opposing entry signal is generated.
This strategy aims to confirm the strength of the trend using moving average crossovers and ADX and to lock in profits based on sudden price movements.
3本の移動平均線による状況判断
5SMAと25SMA のクロスオーバーをエントリーシグナルとして使用します。
さらに、75SMAをフィルターとして使用し、価格が75SMAの上にある場合のみロングエントリーを許可し、75SMAの下にある場合のみショートエントリーを許可します。
ADXフィルター
ADX(平均方向性指数)を使ってトレンドの強さを確認します。
ADXが20より大きい場合のみ、エントリーシグナルを有効にします。これにより、トレンドが強い時にのみ取引を行うことができます。
急激な変動検知
価格の急激な変動を検出します。
急激な変動があった場合には、ポジションをクローズして利益を確定します。
エントリー
ロングエントリー
5SMAが25SMAを上にクロスし、価格が75SMAの上にあり、ADXが20を超えているとき。
ショートエントリー
5SMAが25SMAを下にクロスし、価格が75SMAの下にあり、ADXが20を超えているとき。
エグジット
急激な変動があった場合、ポジションをクローズします。
反対のエントリーシグナルが発生した場合にも、ポジションをクローズします。
このストラテジーは、移動平均のクロスオーバーとADXを使ってトレンドの強さを確認し、急激な変動に基づいて利益を確定することを目的としています。
Price Oscillator TR### Summary: How to Use the Price Oscillator with EMA Indicator
The **Price Oscillator with EMA** is a custom technical analysis tool designed to help traders identify potential buying and selling opportunities based on price momentum. Here's how to use it:
1. **Understanding the Oscillator**:
- The oscillator is calculated by normalizing the current price relative to the highest high and lowest low over a specified lookback period. It fluctuates between -70 and +70.
- When the oscillator is near +70, the price is close to the recent highs, indicating potential overbought conditions. Conversely, when it’s near -100, the price is close to recent lows, indicating potential oversold conditions.
2. **Exponential Moving Average (EMA)**:
- The indicator includes an EMA of the oscillator to smooth out price fluctuations and provide a clearer signal.
- The EMA helps to filter out noise and confirm trends.
3. **Trading Signals**:
- **Bullish Signal**: A potential buying opportunity is signaled when the oscillator crosses above its EMA. This suggests increasing upward momentum.
- **Bearish Signal**: A potential selling opportunity is signaled when the oscillator crosses below its EMA. This indicates increasing downward momentum.
4. **Visual Aids**:
- The indicator includes horizontal lines at +70, 0, and -70 to help you quickly assess overbought, neutral, and oversold conditions.
- The blue line represents the oscillator, while the orange line represents the EMA of the oscillator.
### How to Use:
- **Set your parameters**: Adjust the lookback period and EMA length to fit your trading strategy and time frame.
- **Watch for Crossovers**: Monitor when the oscillator crosses the EMA. A crossover from below to above suggests a buy, while a crossunder from above to below suggests a sell.
- **Confirm with Other Indicators**: For more reliable signals, consider using this indicator alongside other technical tools like volume analysis, trend lines, or support/resistance levels.
This indicator is ideal for traders looking to capture momentum-based trades in various market conditions.
Momentum & Squeeze Oscillator [UAlgo]The Momentum & Squeeze Oscillator is a technical analysis tool designed to help traders identify shifts in market momentum and potential squeeze conditions. This oscillator combines multiple timeframes and periods to provide a detailed view of market dynamics. It enhances the decision-making process for both short-term and long-term traders by visualizing momentum with customizable colors and alerts.
🔶 Key Features
Custom Timeframe Selection: Allows users to select a custom timeframe for oscillator calculations, providing flexibility in analyzing different market periods.
Recalculation Option: Enables or disables the recalculation of the indicator, offering more control over real-time data processing.
Squeeze Background Visualization: Highlights potential squeeze conditions with a background color, helping traders quickly spot consolidation periods.
Adjustable Squeeze Sensitivity: Users can modify the sensitivity of the squeeze detection, tailoring the indicator to their specific trading style and market conditions.
Bar Coloring Condition: Option to color the price bars based on momentum conditions, enhancing the visual representation of market trends.
Threshold Bands: Option to fill threshold bands for a clearer visualization of overbought and oversold levels.
Reference Lines: Display reference lines for overbought, oversold, and mid-levels, aiding in quick assessment of momentum extremes.
Multiple Output Modes: Offers different output visualization modes, including:
ALL: Displays all calculated momentum values (fast, medium, slow).
AVG: Shows the average momentum, providing a consolidated view.
STD: Displays the standard deviation of momentum, useful for understanding volatility.
Alerts: Configurable alerts for key momentum events such as crossovers and squeeze conditions, keeping traders informed of important market changes.
🔶 Usage
The Momentum & Squeeze Oscillator can be used for various trading purposes:
Trend Identification: Use the oscillator to determine the direction and strength of market trends. By analyzing the average, fast, medium, and slow momentum lines, traders can gain insights into short-term and long-term market movements.
Squeeze Detection: The indicator highlights periods of low volatility (squeeze conditions) which often precede significant price movements. Traders can use this information to anticipate and prepare for potential breakouts.
Overbought/Oversold Conditions: The oscillator helps identify overbought and oversold conditions, indicating potential reversal points. This is particularly useful for timing entry and exit points in the market.
Momentum Shifts: By monitoring the crossover of momentum lines with key levels (e.g., the 50 level), traders can spot shifts in market momentum, allowing them to adjust their positions accordingly.
🔶 Disclaimer:
Use with Caution: This indicator is provided for educational and informational purposes only and should not be considered as financial advice. Users should exercise caution and perform their own analysis before making trading decisions based on the indicator's signals.
Not Financial Advice: The information provided by this indicator does not constitute financial advice, and the creator (UAlgo) shall not be held responsible for any trading losses incurred as a result of using this indicator.
Backtesting Recommended: Traders are encouraged to backtest the indicator thoroughly on historical data before using it in live trading to assess its performance and suitability for their trading strategies.
Risk Management: Trading involves inherent risks, and users should implement proper risk management strategies, including but not limited to stop-loss orders and position sizing, to mitigate potential losses.
No Guarantees: The accuracy and reliability of the indicator's signals cannot be guaranteed, as they are based on historical price data and past performance may not be indicative of future results.

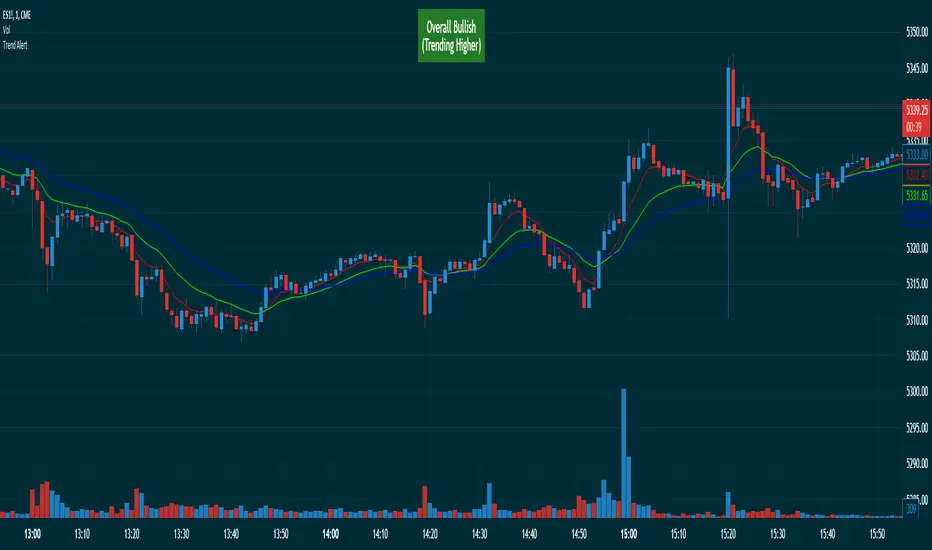
Triple EMA Trend AlertThis EMA trend indicator works by determining if a short-term EMA is above an intermediate-term EMA that is in turn above a long-term EMA (in a bullish trend) or if the reverse is true in a bearish trend. An alert box is displayed on the chart to give a trend trader a quick at-a-glance reference to see which way the overall trend is moving by turning green when the trend is overall bullish, red when overall bearish, and gray when indecisive and not clearly trending (a good time for the trend trader to consider setting back and just observing as they wait for a new trend to develop). Text is displayed in the box showing the current overall trend direction. Sometimes, using this criterion, a trend can still be considered overall bullish while the EMAs are actually bearish prior an EMA crossover that results in a trend readout change to indecisive or in the opposite direction. For this reason, the indicator will also display in parenthesis if the EMAs are trending lower or higher by comparing all live-bar EMA values to that of the previous bar’s values to determine if they are collectively trending lower or higher at that time in order to give an early warning of a potential trend reversal before the EMA crossovers change the overall bullish or bearish readout of the indicator. Both the alert box and EMA line chart overlays can be turned on and off independently, if desired.
Volume Storm Trend [ChartPrime]The Volume Storm Trend (VST) indicator is a robust tool for traders looking to analyze volume momentum and trend strength in the market. By incorporating key volume-based calculations and dynamic visualizations, VST provides clear insights into market conditions.
Components:
Calculating the median of the source data.
Volume Power Calculation: The indicator calculates the "heat power" and "cold power" by applying an Exponential Moving Average (EMA) to the median of volume data arrays.
// ---------------------------------------------------------------------------------------------------------------------}
// 𝙄𝙉𝘿𝙄𝘾𝘼𝙏𝙊𝙍 𝘾𝘼𝙇𝘾𝙐𝙇𝘼𝙏𝙄𝙊𝙉𝙎
// ---------------------------------------------------------------------------------------------------------------------{
max_val = 1000
src = close
source = ta.median(src, len)
heat.push(src > source ? (volume > max_val ? max_val : volume) : 0)
heat.remove(0)
cold.push(src < source ? (volume > max_val ? max_val : volume) : 0)
cold.remove(0)
heat_power = ta.ema(heat.median(), 10)
cold_power = ta.ema(cold.median(), 10)
Visualization:
Gradient Colors: The indicator uses gradient colors to visualize bullish volume and bearish volume powers, providing a clear contrast between rising and falling trends.
Bars Fill Color: The color fill between high and low prices changes based on whether the heat power is greater than the cold power.
Bottom Line: A zero line with changing colors based on the dominance of heat or cold power.
Weather Symbols: Visual indicators ("☀" for hot weather and "❄" for cold weather) appear on the chart when the heat and cold powers crossover, helping traders quickly identify trend changes.
Inputs:
Source: The input data source, typically the closing price.
Median Length: The period length for calculating the median of the source. Default is 40.
Volume Length: The period length for calculating the average volume. Default is 3.
Show Weather: A toggle to display weather symbols on the chart. Default is false.
Temperature Type: Allows users to choose between Celsius (°C) and Fahrenheit (°F) for temperature display.
Show Weather Function:
The `Show Weather?` function enhances the VST indicator by displaying weather symbols ("☀" for hot and "❄" for cold) when there are significant crossovers between heat power and cold power. This feature adds a visual cue for potential market tops and bottoms. When the market heats to a high temperature, it often indicates a potential top, signaling traders to consider exiting long positions or preparing for a reversal.
Additional Features:
Dynamic Table Display: A table displays the current "temperature" on the chart, indicating market heat based on the calculated heat and cold powers.
The Volume Storm Trend indicator is a powerful tool for traders
looking to enhance their market analysis with volume and momentum insights, providing a clear and visually appealing representation of key market dynamics.

Supertrend with Target Price & ATREE [SS]Hey everyone,
Releasing this supertrend mashup indicator.
This is your basic supertrend, but with two additions:
1. The integration of the ATREE technical probability modeller; and
2. The use of ATR price targets for crossovers
ATREE
ATREE stands for Advanced Technical Range Expectancy Estimator. It has its very own indicator available here . If you are not that familiar with it, I would suggest heading over to that page and reading about it, because it gives you the in-depth details.
But for a recap, ATREE uses technical indicators such as RSI, Stochastics or Z-Score to predict the likely sentiment, whether it be bullish or bearish. The indicator allows you to select the ATREE model type and supports 3 separate probability models based on either:
1. RSI
2. Stochastics; or
3. Z-Score
If you want to know which model is most effective for the ticker and timeframe you are using, you can launch up the native ATREE indicator and review the backtesting results to ascertain which model performs optimally for that particular ticker on that particular timeframe.
When ATREE assesses the sentiment as bearish, you will get a red fill. When it assesses the sentiment as bullish, you will get a green fill. This will help you adjust your bias to focus on either dip buying or rip shorting.
The ATREE timeframe is also customizable, so you can pull data from higher timeframes than you are on.
ATR Price Targets
As with my EMA 9/21 crossover with the target price, this is essentially the same concept. When the trend shifts to bullish or bearish, bull and bear targets will be printed so you know where to look for potential reversal and you can also set realistic target prices if you are scalping or day trading.
Supertrend
The last and base feature is the supertrend. The supertrend settings are customizeable.
It will provide a green line for uptrend and a redline for downtrend, the basic supertrend functionality.
And that's the indicator!
Let me know what you think and hope you enjoy!
Safe trades as always!

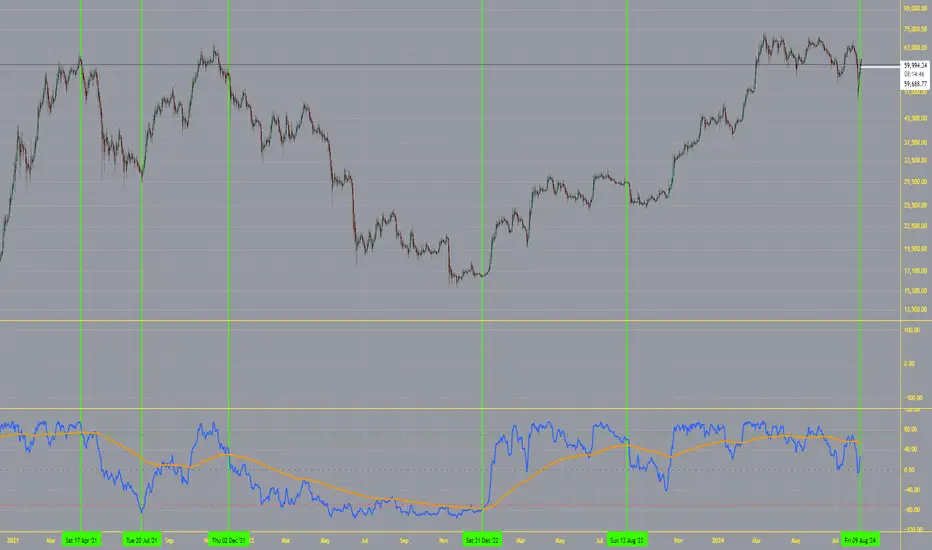
Weighted Alpha with Zero line indicatorDescription:
This script introduces an Enhanced Weighted Alpha Indicator, designed for traders and analysts who seek a more nuanced view of market momentum and trend strength. The Weighted Alpha is a sophisticated measure that combines the concepts of price change and consistency of trend over a specified period. This version of the indicator is enhanced with a customizable lambda value, allowing users to fine-tune the sensitivity according to their trading strategy.
Key Features:
Weighted Alpha Calculation: The script calculates the Weighted Alpha based on the daily return of the asset, adjusted by a decay factor (lambda). This provides a smoothed, long-term view of the asset's momentum.
Customizable Lambda: Users can adjust the lambda value to modify the rate at which older data decreases in relevance. A higher lambda value gives more weight to recent data, making the indicator more sensitive to recent price movements.
Zero Line Indicator: A dotted red horizontal line at the 0 value on the y-axis serves as a quick visual reference. This line helps in identifying when the Weighted Alpha crosses from positive to negative or vice versa, indicating potential shifts in market momentum.
Separate Chart Pane: The Weighted Alpha is plotted on a separate pane below the main chart, providing a clear and uncluttered view.
Usage:
Trend Analysis: A positive Weighted Alpha indicates an upward trend, while a negative value suggests a downward trend. The magnitude of the Weighted Alpha gives an idea of the trend's strength.
Crossover Signals: Watch for the Weighted Alpha line crossing the zero line. Such crossovers can signal potential trend reversals.
Customization: Experiment with different lambda values to match the indicator's sensitivity with your trading style. A lower lambda smooths out the line more, while a higher lambda makes it more responsive to recent price changes.
Conclusion:
This Enhanced Weighted Alpha Indicator is a powerful tool for traders looking to analyze and anticipate market trends with greater precision. Its customization options and clear visual representation make it a valuable addition to any trader's toolkit.

Smart MAThe Smart MA indicator is a tool designed for traders seeking insights into market trends, with its foundation rooted in moving averages. It offers two distinctive color options, with "Crossing" as the default choice and "Direction" as an alternative. Let's delve deeper into these options:
1. "Crossing" Color Option (Default):
Key Features:
Utilizes the interaction between fast and slow moving averages.
The color of the base moving average (MA) line dynamically changes based on crossovers between these moving averages.
Offers real-time visual signals for potential shifts in market sentiment.
Interpretation:
With the "Crossing" color option as the default setting, the base MA line's color responds to the interaction of the fast and slow moving averages.
A crossover where the fast MA crosses above the slow MA may prompt the base MA line to change to a bullish color (e.g., teal), indicating a potential bullish trend.
Conversely, if the fast MA crosses below the slow MA, the base MA line's color may alter to represent a bearish sentiment (e.g., red). This color shift provides a visual marker for a potential bearish trend, potentially guiding traders towards shorting opportunities.
2. "Direction" Color Option:
Key Features:
Focuses on the directional trend of the base moving average (MA).
The color of the base MA line signifies the direction in which the base MA is moving.
Aids in quickly identifying the prevailing market trend.
Interpretation:
Uptrend - Bullish Direction: When the base MA slopes upward, indicating an average price increase over the chosen base MA length, the base MA line's color may shift to a bullish hue (e.g., teal). This visual cue signals a potential uptrend, suggesting favorable long positions.
Downtrend - Bearish Direction: If the base MA slopes downward, signifying an average price decrease over the selected base MA length, the base MA line could change to a bearish shade (e.g., red). This color shift acts as an indicator of a potential downtrend, implying possible opportunities for shorting.
Customization:
Both color options allow traders to adjust the indicator's parameters, including base MA length, MA type, fast MA length, and slow MA length, to align with their trading strategies and preferred timeframes.
In summary, the Smart MA indicator, based on moving averages, provides traders with two color options: the default "Crossing" and "Direction" as an alternative. The "Crossing" option leverages fast and slow moving averages to offer real-time visual cues for dynamic market shifts. The "Direction" option simplifies trend analysis by focusing on the directional trend of the base MA. The choice between these options depends on your trading style and the depth of analysis you require. With the Smart MA indicator, you're equipped to make informed trading decisions in today's financial markets.

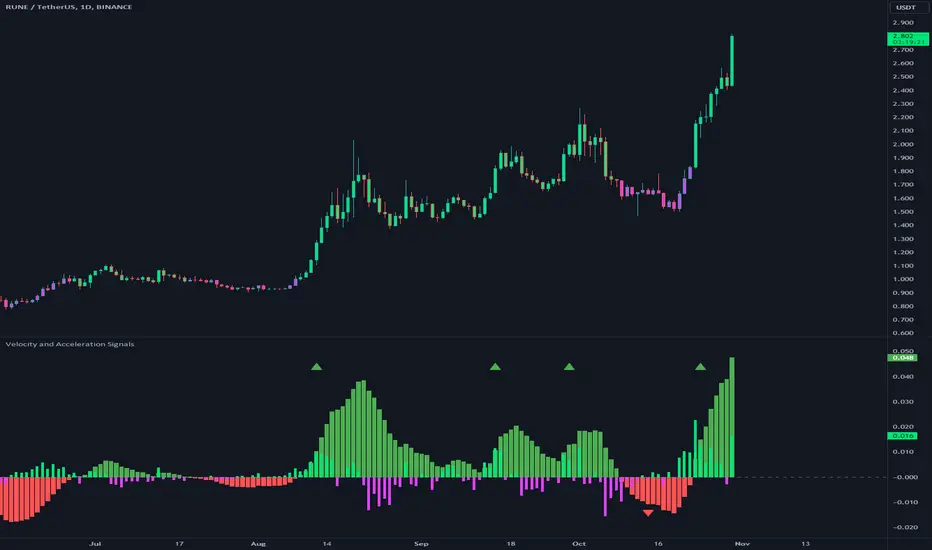
Velocity and Acceleration SignalsThe "Velocity and Acceleration Signals" indicator is a versatile tool designed to provide traders with valuable insights into price momentum and acceleration. By harnessing the power of mathematics and visualization, this indicator helps traders make informed decisions in the fast-paced world of financial markets.
Crunching the Numbers: How It Works
At its core, the indicator relies on two key concepts: velocity and acceleration. Here's how it operates:
-- Velocity Calculation : The indicator takes a step back in time, considering a user-defined historical period (typically around 14 bars). It calculates the velocity of price movements during this period. Velocity represents the speed at which an asset's price is changing and is derived by examining how much the price has moved between bars. Specifically, it computes the rate of change in price over time.
-- Acceleration Calculation : Building upon velocity, the indicator goes one step further and calculates acceleration. Acceleration signifies how quickly the velocity is changing. It quantifies whether the price is speeding up or slowing down in its ascent or descent.
-- Smoothing with EMA : To enhance clarity and reduce noise, the indicator smooths the velocity using an Exponential Moving Average (EMA) with a user-defined length. This smoothed velocity provides a more comprehensive view of the price momentum trend.
Visualizing Market Dynamics
The indicator doesn't just crunch numbers; it also paints a vivid picture of market sentiment:
-- Coloration : The indicator employs a color scheme to visualize market conditions. It uses lime for positive acceleration and fuchsia for negative acceleration. The color green represents positive smoothed velocity, while red denotes negative smoothed velocity. A gray hue signals a neutral or transitional phase.
-- Plotting Velocity and Acceleration : The indicator provides visual representations of both smoothed velocity and acceleration. Smoothed velocity is depicted as columns, with green or red coloring indicating the direction. Acceleration is displayed as a histogram, with lime or fuchsia bars showcasing bullish or bearish momentum. A gray zero line offers a reference point for changes in momentum direction.
-- Strong Up and Strong Down Conditions : For traders seeking distinctive signals, the indicator identifies "Strong Up" and "Strong Down" conditions. A "Strong Up" occurs when smoothed velocity crosses above a user-defined threshold, coupled with positive acceleration. Conversely, a "Strong Down" emerges when smoothed velocity crosses below another threshold, accompanied by negative acceleration. These conditions are marked with prominent triangular shapes.
Unlocking Trading Potential
Now, let's explore how traders can leverage the indicator:
-- Trend Confirmation : Traders can use this indicator to validate the prevailing market trend. A robust smoothed velocity, combined with acceleration in the same direction, can confirm the current trend.
-- Contrarian Signals : Extreme conditions signaled by a strong crossover or crossunder of the smoothed velocity threshold, along with appropriate acceleration, can hint at potential trend reversals.
-- Divergence Analysis : Savvy traders can employ this indicator to identify divergences between price movements and momentum. If the price exhibits higher highs while the indicator shows lower highs (or vice versa), it may signify a weakening or strengthening trend.
Navigating Limitations
As with any trading tool, it's essential to acknowledge the indicator's limitations:
-- Lookback Period : The indicator's effectiveness may vary based on the chosen historical period. Longer periods smooth out fluctuations but may lag in capturing recent changes in sentiment.
-- Threshold Sensitivity : Interpreting threshold crossovers or crossunders can be subjective. Traders should carefully fine-tune these threshold values based on their trading strategy and market conditions.
-- Context Matters : The indicator focuses solely on velocity and acceleration signals and does not incorporate other critical factors such as trading volume, market news, or fundamental analysis. Therefore, traders should use it in conjunction with additional indicators and analysis techniques.
While the primary focus is on trend and momentum analysis, this indicator indirectly provides information about volatility as well. Rapid changes in velocity and acceleration can indicate increasing volatility in the market, which may be of interest to traders looking for opportunities during volatile conditions.
However, this indicator doesn't directly measure volume. To incorporate volume analysis into your trading strategy, you may want to combine this indicator with volume-based indicators or consider other tools specifically designed for volume analysis.
In conclusion, this indicator is a valuable ally for traders looking to decode market dynamics and make data-driven trading decisions. While it offers powerful insights, it's crucial to recognize its limitations and deploy it as part of a comprehensive trading strategy.
Fiboborsa+BistTitle: "Fiboborsa+Bist Indicator for TradingView"
Description: The "Fiboborsa+Bist" indicator is a powerful tool designed for TradingView users. This indicator offers a comprehensive set of technical indicators to assist you in your technical analysis and trading decisions.
Features:
Simple Moving Averages (SMA): You can enable or disable SMA with different periods (20, 50, 100, 200) to observe different timeframes and trends.
SMA Strategy: Use SMA crossovers to determine trends. Watch for the 20-period SMA crossing above the 50-period SMA for a bullish signal. For a bearish signal, observe the 50-period SMA crossing below the 100-period SMA.
Exponential Moving Averages (EMA): Similar to SMA, you can enable or disable EMA with different periods (5, 8, 14, 21, 34, 55, 89, 144, 233) for more precise trend analysis.
EMA Strategy: Use EMA crossovers and crossunders for short-term trend changes. A buy signal may occur when the 5-period EMA crosses above the 14-period EMA, while a crossunder suggests a selling opportunity.
Weighted Moving Averages (WMA): Customize WMA settings with various periods (5, 13, 21, 34, 89, 144, 233, 377, 610, 987) to suit your trading style.
WMA Strategy: Use WMA crossovers to verify trends. When the 13-period WMA crosses above the 34-period WMA, it may indicate an uptrend.
Buy and Sell Signals: The indicator provides buy and sell signals based on EMA crossovers and crossunders. Strong signals are also highlighted.
EMA Buy and Sell Strategy: Make informed trading decisions using buy and sell signals generated by EMA crossovers and crossunders.
Ichimoku Cloud: You can enable the Ichimoku Cloud for a clear visual representation of support and resistance levels.
Ichimoku Strategy: Use the Ichimoku Cloud to determine trend direction. Entering long positions is common when the price is above the cloud and considering short positions when it's below the cloud. Verify the trend with the Chikou Span.
Bollinger Bands: Easily visualize price volatility by enabling the Bollinger Bands feature.
Bollinger Bands Strategy: Bollinger Bands help you visualize price volatility. Look for potential reversal points when the price touches or crosses the upper or lower bands.
Use the "Fiboborsa+Bist" indicator to enhance your trading strategies and make informed decisions in the dynamic world of financial markets.
Additional Information:
Bollinger Bands: Bollinger Bands are a technical analysis tool used to monitor price volatility and determine overbought or oversold conditions. This indicator consists of three components:
Middle Moving Average (SMA): Typically, a 20-day SMA is used.
Upper Band: Calculated by adding two times the standard deviation to the SMA.
Lower Band: Calculated by subtracting two times the standard deviation from the SMA.
As the price moves between these two bands, it becomes possible to identify potential buying or selling points by comparing its height or low with these bands.
Ichimoku Cloud: The Ichimoku Cloud is a comprehensive indicator used for trend identification, defining support and resistance levels, and measuring trend strength. The Ichimoku Cloud comprises five key components:
Tenkan Sen (Conversion Line): Used to identify short-term trends.
Kijun Sen (Base Line): Used to identify medium-term trends.
Senkou Span A (Leading Span A): Calculated as (Tenkan Sen + Kijun Sen) / 2 and shows future support and resistance levels.
Senkou Span B (Leading Span B): Calculated as (highest high + lowest low) / 2 and indicates future support and resistance levels.
Chikou Span (Lagging Line): Enables tracking the price backward.
The Ichimoku Cloud interprets a price above the cloud as an uptrend and below the cloud as a downtrend. The Chikou Span assists in verifying the current trend.
ADDITIONAL STRATEGY WITH RSI AND MACD INDICATORS
**Strategy: Two-Stage Trading Strategy Using RSI, MACD, and Fiboborsa+Bist Indicators**
**Stage 1: Determining the Trend and Selecting the Trading Direction**
1. **Trend Identification with Fiboborsa+Bist Indicator:**
- Analyze the simple moving averages (SMA), exponential moving averages (EMA), and weighted moving averages (WMA) used with the Fiboborsa+Bist indicator. These indicators will provide information about the direction of the market trend.
2. **Identifying Overbought and Oversold Conditions with RSI:**
- Use the RSI indicator to identify overbought (70 and above) and oversold (30 and below) conditions. This helps in measuring the strength of the trend. If RSI enters the overbought zone, a downward correction is likely. If RSI enters the oversold zone, an upward correction is probable.
3. **Evaluating Momentum with MACD:**
- Examine price momentum using the MACD indicator. When the MACD line crosses above the signal line, it may indicate an increasing upward momentum. Conversely, a downward cross can suggest an increasing downward momentum.
**Stage 2: Generating Buy and Sell Signals**
4. **Combining RSI, MACD, and Fiboborsa+Bist Indicators:**
- To generate a buy signal, wait for RSI to move out of the oversold region into an uptrend and for the MACD line to cross above the signal line.
- To generate a sell signal, wait for RSI to move out of the overbought region into a downtrend and for the MACD line to cross below the signal line.
5. **Confirmation with Fiboborsa+Bist Indicator:**
- When you receive a buy or sell signal, use the Fiboborsa+Bist indicator to confirm the market trend. Confirming the trend can strengthen your trade signals.
6. **Setting Stop-Loss and Take-Profit Levels:**
- Remember to manage risk when opening buy or sell positions. Set stop-loss and take-profit levels to limit your risk.
7. **Monitor and Adjust Your Trades:**
- Continuously monitor your trade positions and adjust your strategy as per market conditions.
This two-stage trading strategy offers the ability to determine trends and generate trade signals using different indicators. However, every trading strategy involves risks, so risk management and practical application are essential. Also, it's recommended to test this strategy in a demo account before using it in a real trading account.
