Crypto Spot Market BotHello Friends.
This script is only for long positions.
How does the algorithm work ?
The Relative Momentum Index
Relative Strength İndex
Average Directional Movement İndex
Momentum
When rsi and adx produce signals in the same direction, the rmi indicator confirms the signal. After the Confirmed Signal, the buy-side transaction is entered , the closed according to the % of profit taking and stoploss specified on the algorithm in the entered transaction.
In the spot market, it is possible to make money even in a down trend
All shared charts run within a 1-hour time frame.
Note : The shared backtest results have been shared as of 9/9/2021 by calculating 50% balance and 2 pyramiding methods in an account of 1000 dollars. Keep in mind that this algorithm will want to try to average down in possible worst-case scenarios. 2% - %3take profit levels will provide consecutive gains in the spot market.
How should the adjustments be made?
Value variables should be made according to formula a and formula b values and backtest results. You can increase the frequency of transactions by lowering the adx and rsi values.
Alarm Features ;
Signal Alert
TakeProfit Alert
Stoploss Alert.
Overview :
Backtest Script Link :
Search in scripts for "crypto"

CRYPTO DASHBOARD Gs₿A Simple Crypto Dashboard/Screener which indicates the Price and percentage changes for the Given Period of time i.e for 1 Hr ,4 Hrs, 1 Day, 3 Days, 3 Weeks and 3 - 12 Months. By Default it displays #BTC and its Dominance and current trading pair Price and % changes.
Crypto Jimboo's Algo V3Hey Everyone!
This is the third published version of my algo, Crypto Jimboo's Algo! I am an amateur coder and developer learning each day. This is my attempt at utilizing price action, some market data, and moving averages to make more successful trades. So far, it has proved to be pretty useful. If you are a beginner trader and you are looking for some help on learning how to read charts and understand price action - try this out. I will continue to try to add to it and make it better with time. I have seen success on the 5m, 15m, 1hr, 2hr, 4hr, and daily timeframes to this point. I have left the option of including or not including candlestick indicators/patterns in the settings options of the Algo (it will automatically add the candlestick patterns to the chart until you go into the settings of the indicator and check whatever ones you do not want off). Additionally, I left it so that the colors on the algo can be modified to the user's liking. You can also use the alert dialogue box to set alerts to your computer, email, and phone!
Best of luck and let me know how it works, please!
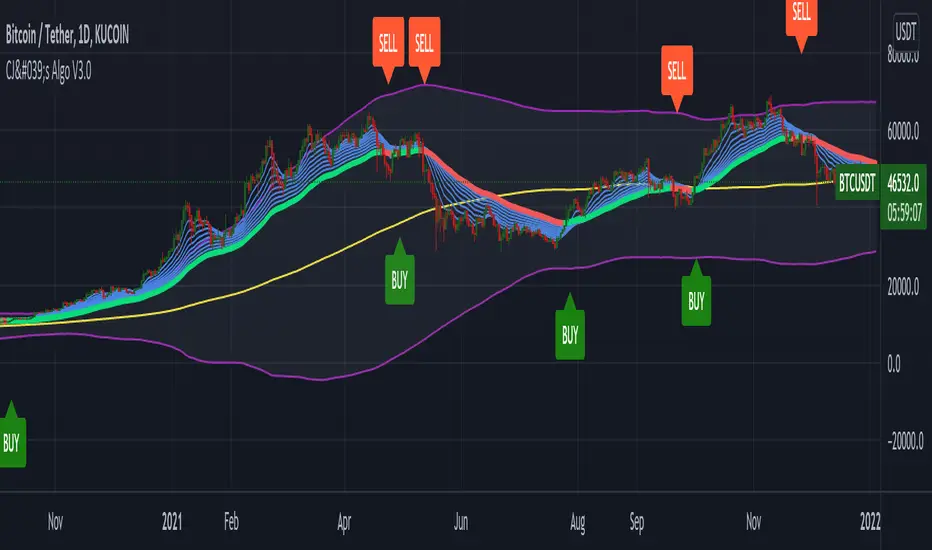
I have placed my strategy and a snapshot of how my chart looks below.
5m, 15m, 1hr, 2hr, 4hr, and Daily Timeframe Strategy
• For Buy – Ensure the price action is not at the top of the Bollinger Bands (purple lines in the snapshot), the price action is trading above all EMA lines (many blue lines), and check for a green trend catcher (the centerline that turns green and red as the price fluctuates). If the above is true, open a long position.
• For Sell – Ensure the price action is not at the bottom of the Bollinger Bands, the price action is trading below all EMA lines, and check for a red trend catcher. If the above is true, open a short position.
Crypto Volume/Strength ComparatorHello Traders,
Here is an attempt to perform comparative analysis between top cryptos based on strength (oscillator) and volume. Methodology used here is similar to Magic Number formula described in the post : Enhanced Magic Formula for fundamental analysis . But, instead of using fundamentals, we are making use of few technicals to derive similar outcome. Usage of the available stats will not be same as Magic number since we are using technicals.
⬜ Process
▶ Get crypto exchange based on prefix of instrument being used.
▶ For the given exchange, get data for all the tickers available in input fields.
▶ Calculate Oscillator, Momentum based on price for each tickers.
▶ Calculate Oscillator, Momentum based on volume for each tickers.
▶ Calculate Volatility for each tickers.
▶ Rank Price-Oscillator, Price-Momentum, Volume-Oscillator, Volume-Momentum, Volatility for each tickers.
▶ Calculate combined rank by adding up individual ranks.
▶ Calculate movement of rankings from bar to bar
▶ Sort tickers based on rank and populate them on table. Display direction of rankings.
⬜ Components
Display components are as follows:
⬜ Settings
Settings are pretty simple and straightforward
⬜ Calculations
▶ Oscillators : High values of oscillators are considered as ideal as the process is intended towards finding trend.
▶ Momentum : Momentum is calculated on the basis of Squeeze Momentum Indicator by @LazyBear.
▶ Volatility : Volatility is calculated on the basis of Williams Vix Fix by @ChrisMoody. Here too since we are in trend following mode, lower vix fix is considered ideal.
⬜ Few Notes
Tickers will show data only if selected exchange has them. Some tickers are not available in all exchanges. In that case, it will show NAN. This is kind of unavoidable as we need to have fixed size arrays for any calculations.
Indicator works only on crypto tickers which has valid exchange.
Tickers move through the rankings in real time. Background of all stats are based on gradient from green to red.
Tickers on top may not always have better long opportunity or tickers at bottom may not always be optimal for shorting. We need to consider how long the instrument may stay in the position or how fast it is moving in opposite direction. Hence, directions of the ranking movement are also shown on the table.

Crypto Scannner for Traffic Lights StrategyI allways try to make trading easier. Developing Scripts for a quick backtest and improvement of a strategy, getting alerts for entry and exit a position. Loading data to a spreadsheet is also important and takes time.
In this case finding good parameters in different markets or assets to enter in a position, is a bit exhausting. It is something you have to do everyday, and sometimes in different moments of the day.
So I manage to develop a Screener, to take a quick look at specific hours, and tell if I have a buy or sell condition in an specific asset. Obviously this is not an alert to make a trade instantaneusly, but this help you filter a lot of information in matters of seconds. Then open those specific charts and make a better analisys.
A few weeks ago, I published a scrpipt called "Traffic Lights Strategy", that uses 4 emas to get a buy or a sell condition.
It is easy to understand and use, but if you don´t want to missed some opportunities, and don't want to be look at the screen in all the time looking for them, I have here a simple solution.
This script works plotting 2 labels. The first one plots all the assets in which the condition is true (fastema > medema > slowema > filterema or fastema < medema < slowema < filterema)
The second one plots the assets were the condition is true only if happened up to 5 candles back, so you can be in time to enter a trade.
You can take the script and customize it for a different strategy or assets. I coded like this because I backtested this strategy in this specific assets, and statistics suggest that it might be profitable.
I hope this works for you. In other time I'll try to code a script for the others strategies I published.

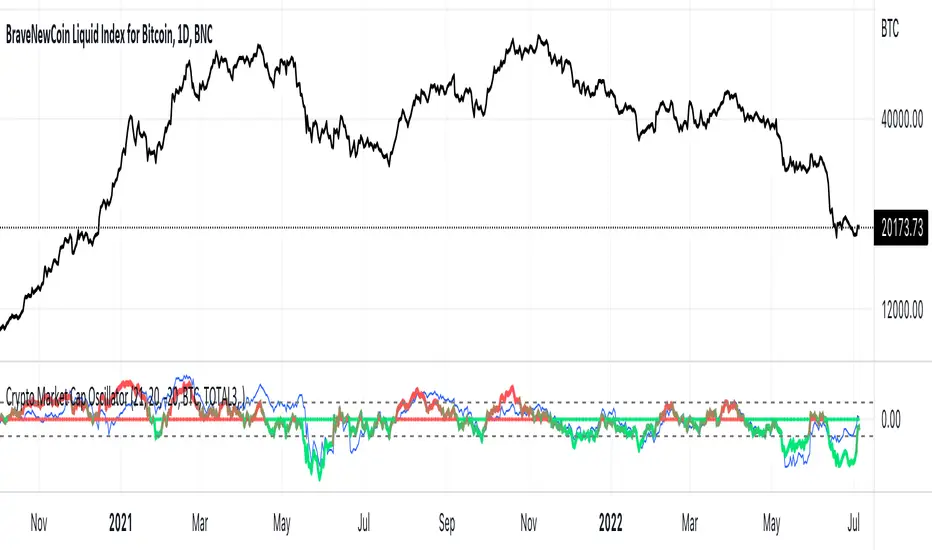
Crypto Market Cap Oscillatorthis oscillator gives helps you to select the right buy or sell moment based on the market cap of the token of your choice
It is based on a base 100 oscillator
Black plot is BTC marketcap
Gray plot is total ALT marketcap
Coloured is based on the coin of your choice
The greener the plot, the best buy opportunity
The more red the plot, the best sell opportunity
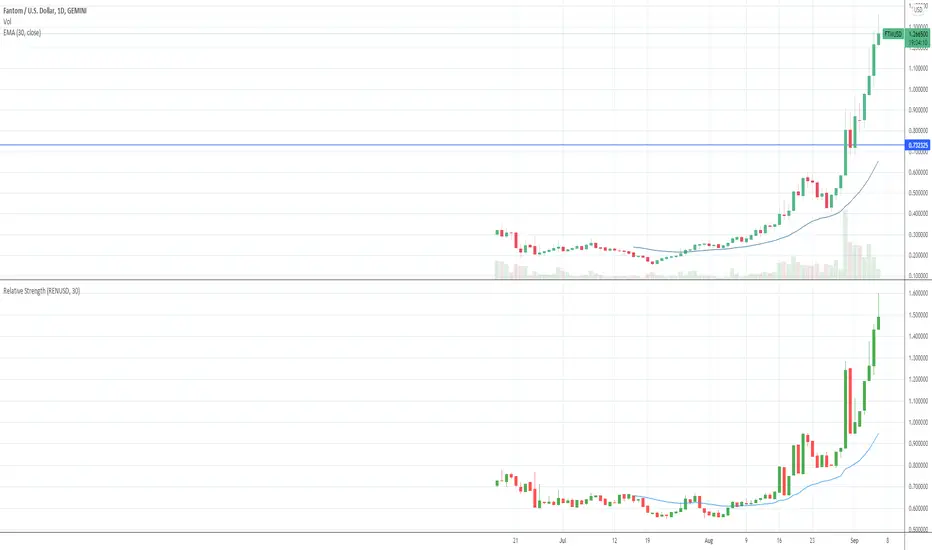
Crypto Relative StrengthIndicator meant for crypto markets. Computes the relative strength of the current ticker against a target ticker and plots a candlestick chart. Also, plots an exponential moving average of the relative strength.
Crypto Total Market Cap, Exclude Tether, (USD)Total cryptocurrency market capitalization without tether, with alerts for chosen value thresholds.
The rationale is that tether is a printed supply stable coin with a fixed value; there is no need to include its value in a combined market cap. It's debatable if that's true, but that doesn't explain what this indicator is.
The second part of this indicator is highlighted when the aforementioned adjusted market cap is above or below certain values. They are round numbers; a psychological factor. A psyop, if you will.
Options to configure are the lower and upper bound and colors. The alerts must be manually turned on, as usual.

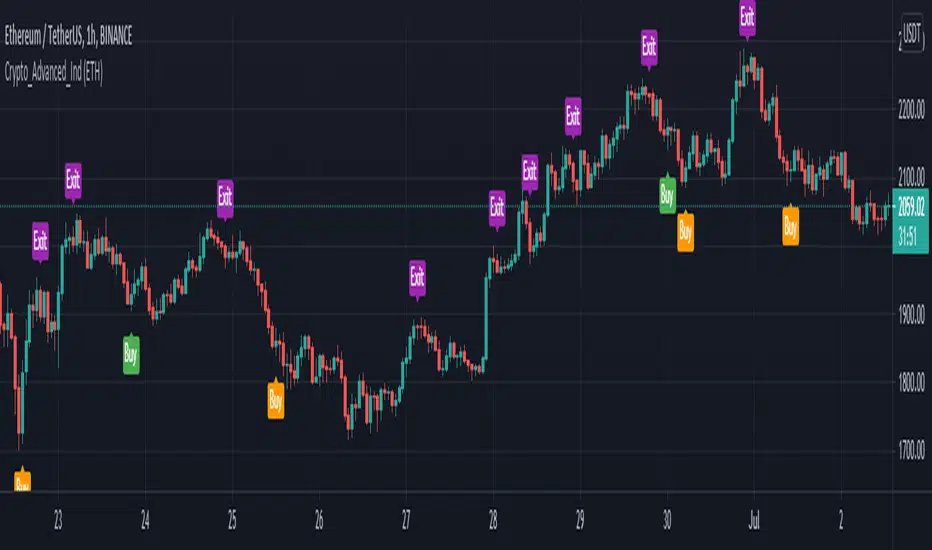
Crypto Advanced Trading IndicatorThe Crypto Indicator gives you a true picture of the market entry points, after a scan it does every period (after every candlestick closes) . It is pretty straightforward in its use with clear visual representation of the entry and exit points provided by the indicator.
This allows you to make improved entry and exit points and accommodates many trading styles, systems, and strategies.
It will work along most TradingView indicators and the timeframes we recommend you using it in are the 1H and sometimes the 4H chart.
The specific components of the indicator are:
Methodology:
The indicator uses a MACD oscillator to determine the local trend direction and to give buy & exit signals when its conditions are met.
An optional TradingView indicator, exponential moving average cross (EMA cross), can be used to filter out 'false' signals.
The calculation of the entry points are drawn from specific different prices for every one of the coins hardcoded in the script, and the filter function in the indicator settings, allows the user to change those prices based on the coin he is currently watching, based on the specific coin it is chosen in the filter.
Persistent variables are used for buy and exit prices, enabling color-coding of the signals (profitable or not).
Features:
Color coded labels - Buy, Exit = purple
Two types of entries - Bull Buy = green, Bear Buy = orange
Coin filter
Buy signal alerts
Remarks:
In our experience and therefore recommendation, the values used for each crypto coin work best on the 1-Hour timeframe. We encourage everyone to experiment, but the best results we had, were on this specific timeframe or higher.
Using the indicator on non-standard charts (Heikin Ashi, Renko etc.) can produce unrealistic results.
- Thanks to John Aslanis and Alexandros Temelkou the idealists and creators of this indicator.
Use the link below to watch a tutorial video, request a trial, or purchase for access:
Crypto RSI Oscillator [marksc]This is my main indicator of pricing trend reversals.
It consists of two main indicators:
1. The green/red oscillator shows a general rising (green) or falling (red) price trend over a smoothed average of a number of periods (length).
2. The yellow "OverUnder Line" shows the Relative Strength Index adjusted price trend in real time.
How to use it:
- You will need to adjust the Overbought and Underbought (green and red) horizontal lines such that the yellow line rarely peaks past them. This will depend on historical data and the time-scale you're using. So if you configure it on a 15minute timescale and then switch to hourly the lines will need-readjusted. This is because the yellow line's movement is "Relative" to a number of periods of time in the timescale.
Predicting Pricing Reversals:
Adjust the Overbought and Underbought lines such that, in the past, the yellow line has rarely peaked over or under them.
When the yellow line peaks over or under one of the Over/Underbought lines again the price will likely make a strong reversal.
(Conversely, if the yellow line is not peaking but staying mostly flat or only slightly angled then the pricing trend is likely to continue.)
Predicting "Pump and Dumps":
If the price makes a sharp reversal while the yellow line was far from the over/underbought lines (ie. the yellow line was near the center), this indicates that a larger purchase or sale than has happened in a long time just happened. In most cases the price will quickly correct back to where it was because this sharp price reversal was was abnormal over the length*period used in the RSI calculation.

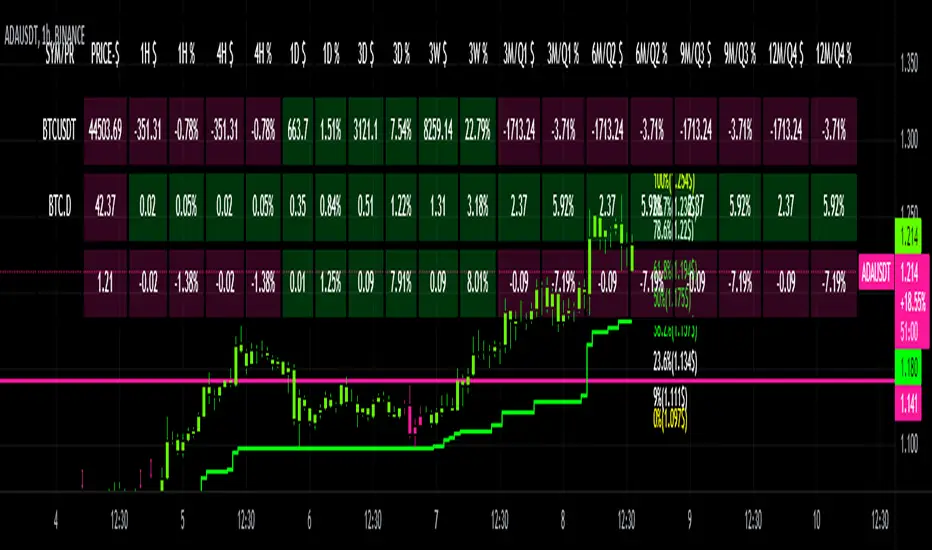
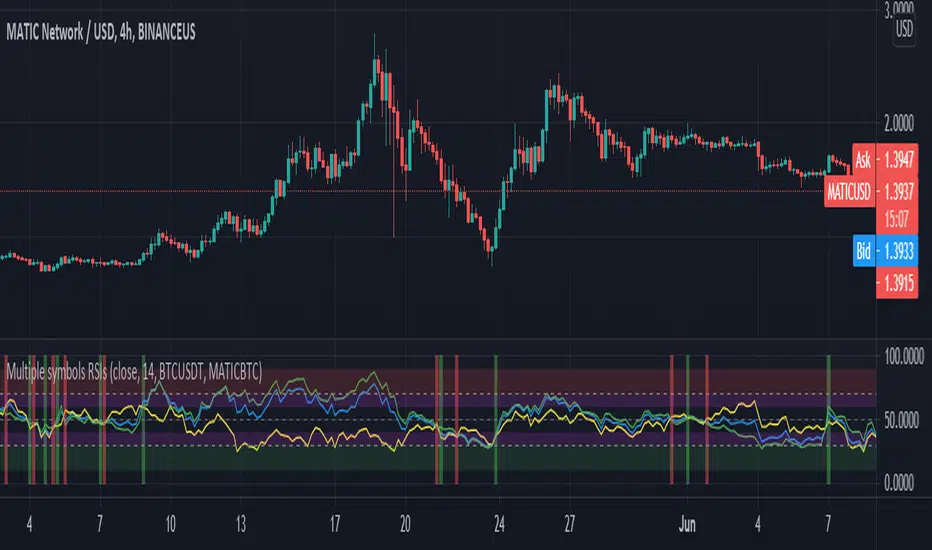
Crypto Tripple RSIGives an ability to compare 3 RSIs:
current altcoin + BTC (e.g. ADABTC) - green by default
current pair (e.g. ADAUSDT) - blue by default
BTC (e.g. BTCUSDT) - yellow by default
It helps to understand the cause of price change - whether BTC provokes price change or not. Also it shows performance of an altcoin - the bigger gaps between RSIs, the stronger (RSI of BTC is on the bottom)/ weaker (RSI of BTC is on the top) altcoin is.
Crypto PricesA simple indicator that gives you a quick overview of which BTC & ETH markets are the most expensive and which are the cheapest at any given time.
Five spot markets and five derivatives markets are included.
An average price of all those markets is calculated and then it shows you how the markets selected are trading relatively to that average.
The average will always be based on all markets (for each coin), but you can add or exclude markets to compare in the settings (do it in the input settings, NOT the style settings).
There's a lot of information that can be derived from comparing prices of different markets.
Markets included:
SPOT
Bitfinex
Coinbase
Binance
FTX
Huobi
DERIVS
Bitmex
Bybit
Binance
FTX
Deribit
It's free so just add it to your favourites and you can start using it.
Shout-out to /u/dogepgp for helping me out with this indicator.

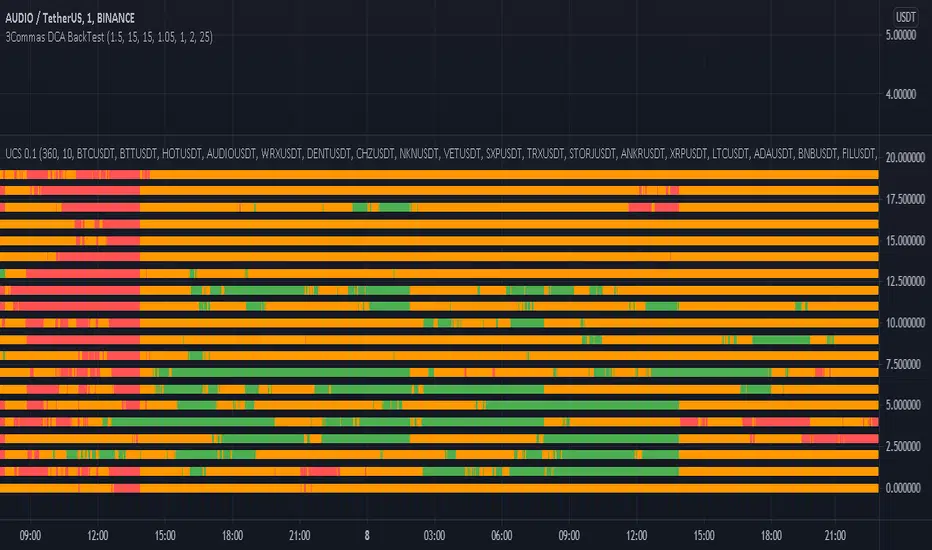
Crypto Market VolatilityCross market look at different Crypto markets ans their growth from the lowest value in 6 hours.
Green = +10% growth
Orange = 0 001- 9.99% growth
red = lowest price in last 6 hours
Use 1 minutes candles.Orange lines signify less volatility for bots.
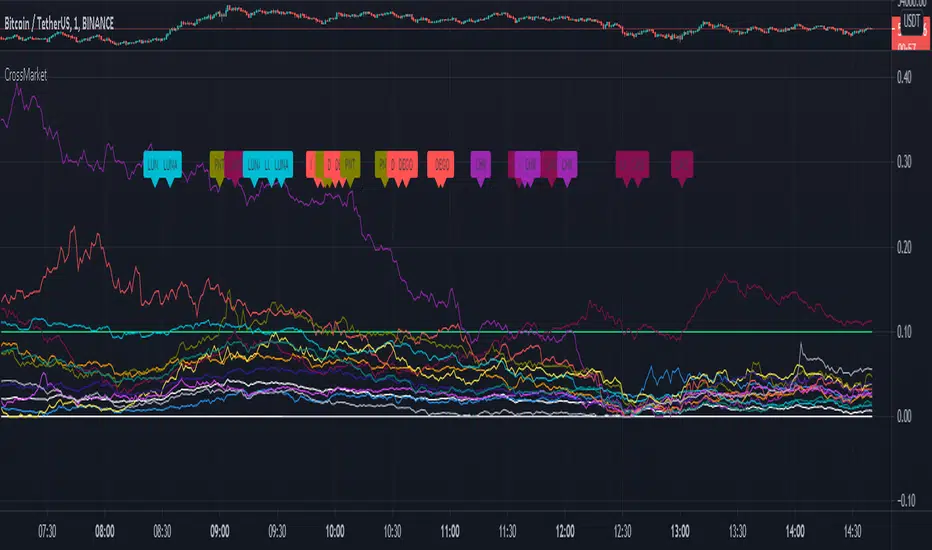
Crypto Cross MarketCross market look at Crypto currencies under and arround 1USDT and their percentage increase in a 6 hour period.
Crypto Bot Buy Signal 01 - Optimized RSI MomentumWelcome to our first Tradingview buy signal indicator.
We develop signals which have been specially developed for crypto trading bots. We publish new indicators at regular intervals.
This strategy is based on our "Crypto Bot Signal 01 - Optimized RSI Momentum" indicator, so that you can apply and test this strategy to your charts/pairs.
The basic idea of this script is to compare a low sensitive RSI with a low sensitive smoothed RSI to find the sweet spot to buy. This strategy is relatively robust against false breakouts, even if these can of course never be avoided. These signals occur relatively rare, but you can set an alarm up on different pairs simultaneously. The strategy works best in 5 min chart and in crypto pairs. It wasnt tested in Forex etc. but feel free to test it.
We recommend to base your sell strategy on trailing stop-loss and not indicator based. A traling stop-loss arming at 1% and trailing stop-loss percentage at 0.3% works well. Our goal was it to reduce the average coin holding time to a minimum. We recommend this procedure cause we believe in the power of long term uptrending crypto, compounding and dont want to sell at a loss in a false breakout. But you can handel it like you prefere.
Feel free to adjust the parameters to your preferences:
- A lower value of the RSI and EMA length makes this indicator more sensitive
- A lower threshold value results in better trades but it reduces the amout of possible trades per day
- A higher threshold value results in more trades but the risk of false breakouts gets higher
We sell this indicator so it is invite only. But of cause you can test it before buying. Also you can freely test the strategy before. Simply check out our profil and look for "Crypto Bot Signal 01 Strategy - Optimized RSI Momentum".
If there are questions, write them into the comments or contact us directly over the direct message. Happy Trading!

Crypto _Market_Compare - XRAY vision Showing data from all corners of the crypto market. Each data input has is own color and label for better visuals. Left click the scale on the indicator and turn on "indicator labels" as well as "indicator value" and make sure there is "no overlapping labels".
This awesome visual is a quick glance tool to help you to grasp the health and current state of an asset vs the market and USD. Often traders overlook the importance of this and I always try to study this data to show what is possible for my profit goals and timeframe.
Things to look for and how these :
PATTERNS!
Crossings (up/down)
Levels
Status or Grade of each plot (which is lowest, low, high, higher, highest etc)
Send inquiries via message for paid access.

Crypto Smart VortexThe indicator is designed to work in conjunction with the Crypto Smart Scalper, it can identify potential retracement zones which will help you make a decision on whether to enter a trade or wait for a retest of the entry zone, it will also allow you to determine the best take profit points.
This is NOT a trading system and should be used with supporting information and data. It is not identifying or is meant to represent a standalone trading system.
If you would like to enquire about access to this invite only script please send me a private message on trading view and I will be happy to assist. Thank you.

Crypto Monitor / DashboardI created a Crypto Monitoring Dashboard!
Here is the idea behind it:
Monitor up to 4x Symbols on one chart
Monitor 2x Time Frames at once
Monitor 3x indicators
So to get into the details a bit more and how to use it. There are 4 separate rows for each symbol
Row 1: Shows the status of the MACD indicator on the higher and lower time frame and color codes them accordingly.
Row 2: Shows the higher time frame RSI value compared to pre-determined values for bullish , oversold, and overbought.
Row 3: Shows the lower time frame RSI value compared to pre-determined values for bullish , oversold, and overbought.
Row 4: Shows the status of the price compared to the moving average. Price greater then the MA is considered bullish ; below is bearish
Since things get rather cramped with the multiple symbols on all at once, the intention is that you enlarge this and look at just ( aka not with the bar chart) this for your favorite 4 coins and then when you see the conditions you want, you close it and open the chart of your coin.
Please feel free to leave a comment if you have questions or suggestions on how to improve it! Appreciate the feedback

Crypto Trading Hours UTC based on Berlin time (UTC +2)Although crypto markets trade 24/7, there are spikes in volume according to the general hours at which different parts of the world do the majority of their trading.
This Script highlights the US, European and Asian markets when they are most active. The normal market hours are always from 08:00 to 16:30 local time.
US market opens at 8:00 Silicon Valley local time, and closes at 16:30 New York local time.
European market opens at 8:00 London local time, and closes at 16:30 Frankfurt local time.
Asian market opens at 8:00 Hong Kong local time, and closes at 16:30 Sydney local time.


Crypto Ingenius Breakout w AlertsThis is the study version with working alerts of the Crypto Ingenius Breakout Strategy since alerts only work in studies

CryptoJJ - SSL indicatorThe SSL indicator with colour change. Tool for spotting trends and finding good entry points. I recommend using it for higher timeframes, from 4h to 1D.
Play with the settings, you can change the moving avarage type, its length, if you prefer having the default
bar colours in your chart, disable the colouring function in the script.
Good luck crypto traders!
CryptoJJ

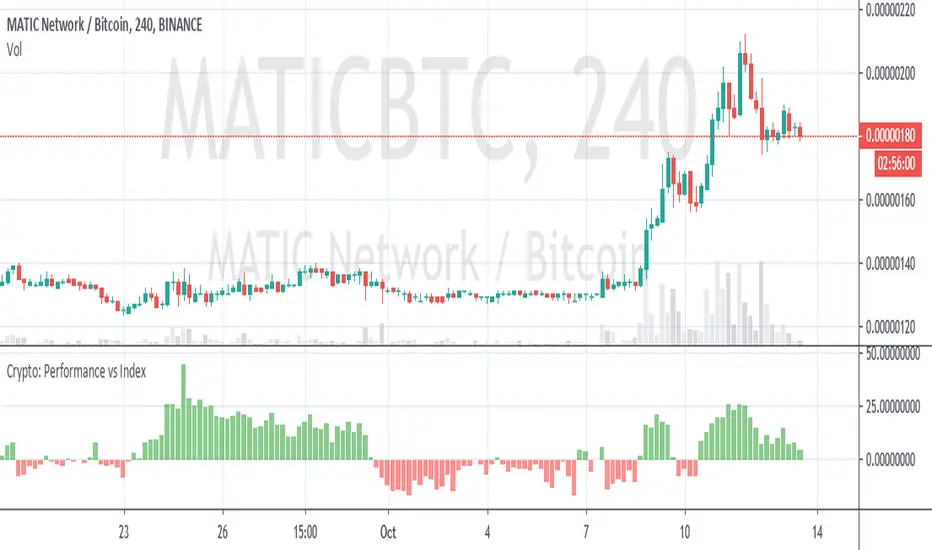
Crypto Performance vs IndexQuickly shows you if an altcoin is outperforming or underperforming it's peers. You can compare again indexes of high cap, mid cap and low cap indexes, which are provided by FTX.com. I intend to add some more features but am currently a bit busy so wanted to get it published as I've been finding it useful