Daily lines (UTC)This is a simple script to add highlighted lines on the daily open.
It uses UTC as timezone.
Search in scripts for "daily"

Daily SeasonalityDay trading trend filter indicator designed to hep get better entries or exits based on historical opens and closes each hour.
This indicator is NOT designed as an entry or exit signal. The purpose behind it is to give you statistical information about how likely certain times of day are either bullish , bearish or neutral and use that to confirm or reject other trading signals.
For example you might be anticipating a breakout based on your strategy or another indicator but see that the next few days are usually bearish and re-evaluate entering the trade.
The Daily Seasonality indicator calculates the percentage of candles per day of the week that had a higher close than open.
Default settings are:
- a look-back of 52 weeks (1 year).
- extreme bullish ( bright green) above 74%
-extreme bearish ( bright red) below 25%
- bullish (green) above 55%
- bearish (red) below 45%
- neutral (white) exactly 50%
- no trend (gray) 46% - 54%
All of these are updatable via the settings.
This indicator is designed to work only on the Daily timeframe.

Daily Range 1) Daily high - low range as a column chart
2) If differentiates the days of the week, Wednesday - Blue, Thursday - Red

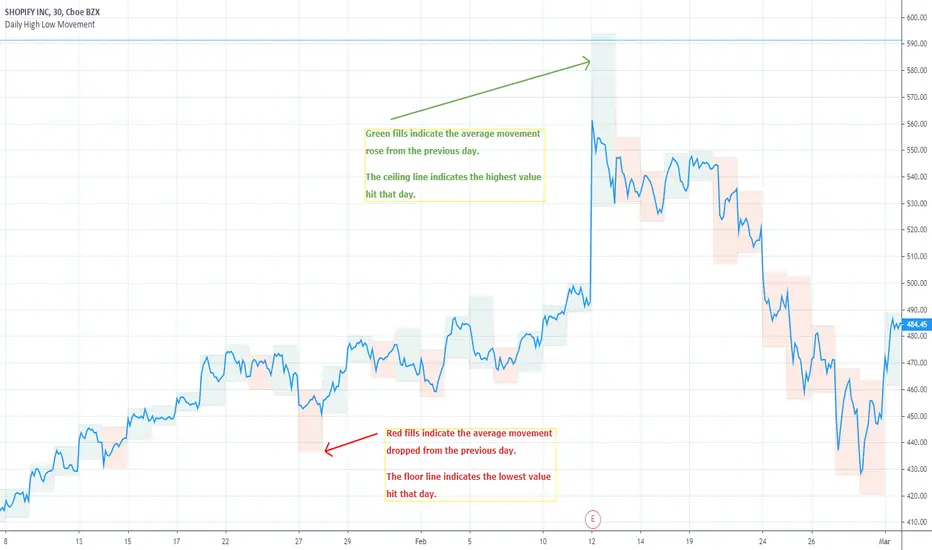
Daily High Low MovementIndicates the daily high and low drawn by green and red lines. Fill blocks indicate the average value movement relevant to the previous day. Green fills indicate that the value is moving higher than the previous day and red meaning lower.
NYSE:BA
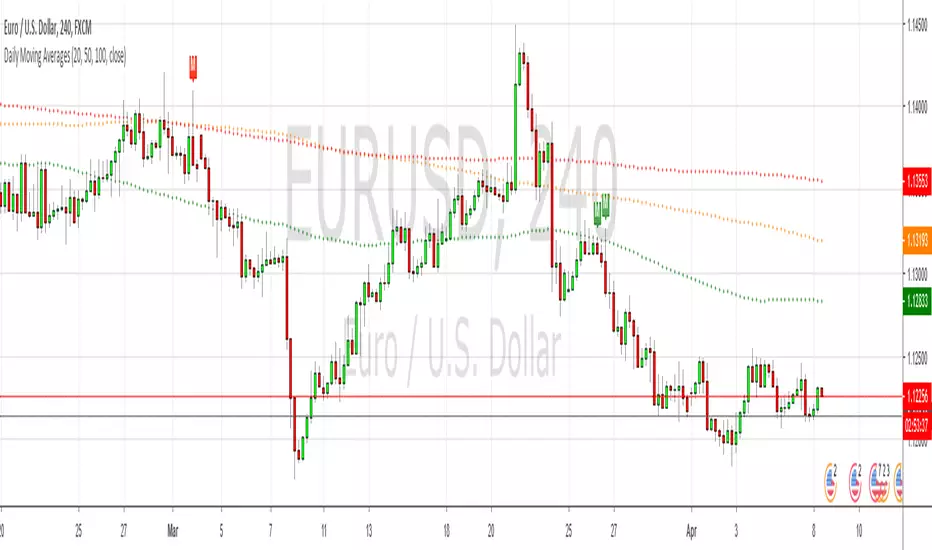
Daily & 4H Moving AveragesThis indicator shows the 99MA daily (dotted) and 4H (solid) moving averages on all timeframes. It defaults to the 99MA, but you can change it to 25MA or whatever your heart desires. Why would you want to use this? Cause the 99MA is like magic for altcoins, presumably because it's the largest default MA on Binance and lots of people are watching it.
If you can see where the daily and 4h MA lines are, even while looking at a 1h or 30m chart, then you'll know more about the areas where price might do predictable stuff.

Daily OHLC UpdatedThis plots the daily OHLC values as well as a few other options.
The base indicator plots and colors a daily open line. When line is green close is above open. When line is red close is below day open.
You can also turn on background highlighting.
Background will be green (default) If close is above day open
Background will be red (default) If close is below day open
There is also an option to turn on indicators on the bottom of your chart:
Arrow up will be green (default) If close is above day open
Arrow down will be red (default) If close is below day open
Next version will be adding alerts.

Daily Moving AveragesPlots the 20, 50, 100 & 200 daily moving averages on any lower timeframe, but it uses a custom function to calculate the plots rather than using the security() function, so the lines are smooth rather than jagged.
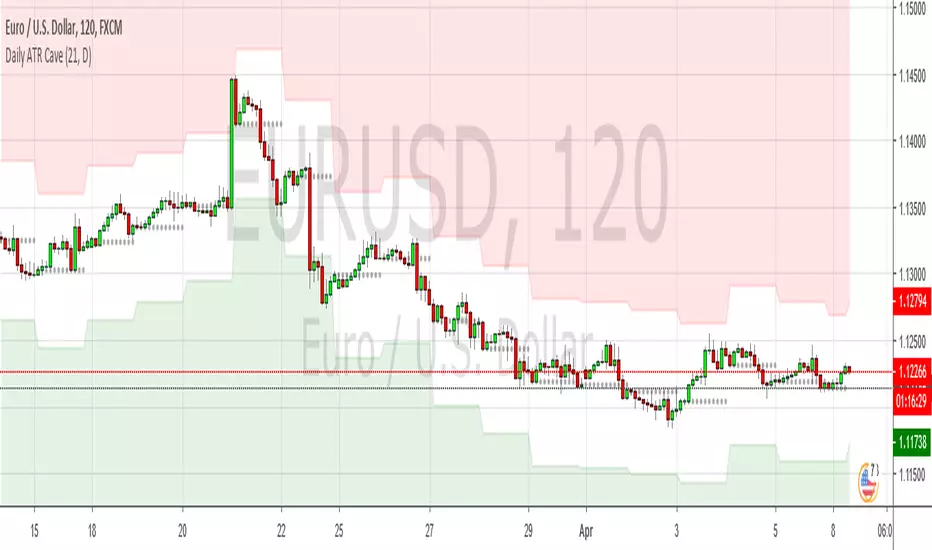
Daily ATR CaveSimilar to the RSI Cave idea, this plots daily Average True Range values on lower timeframes, as well as the daily open level, which is show as a grey dotted line. Basically a simple way to visualise basic mean reversion stuff
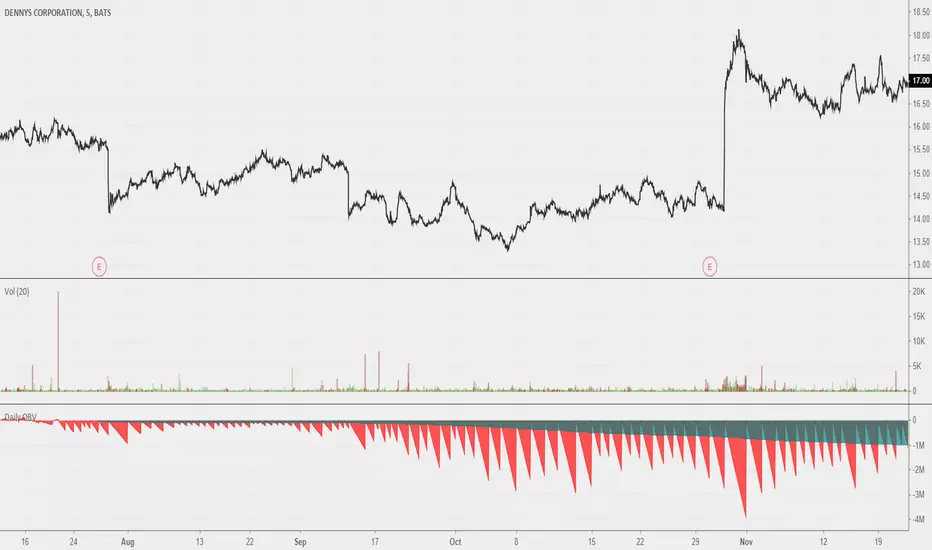
Daily OBVOBV that should reset on a daily session break. Looks neat when you scroll out all the way. Good use remains to be found; I believe this could be a useful reference for a more fleshed out idea for 'local zone' OBVs. Maybe comparing previous sessions' daily OBVs to current.
Daily Exponential Moving AveragesTired of wasting countless hours switching back and forth between timeframes?
Worry not! For only 499.95$ now you can... Oh wait this script took me 5 minutes I can't sell that.
The idea is priceless thought.
This is a very basic script that lets you view 2 daily exponential moving averages from any timeframe (you won't see much from higher timeframes thought).
To see the 1 hour regular divergence at the top you would still need to check the 1 hour.
I recommend having a vague idea of the trend on daily/weekly chart and then looking only at 4 HR with daily indicators on it like with this script + maybe if you want you might use the 1HR chart for confirmation or to try and pinpoint the best place to enter.
No matter what your holding periods are, other timeframes are bad anyway.
Going to release a couple more scripts in the coming weeks.

Daily High/Lowmodified version of Mike Witts Daily High/Low indicator.
This is a simple change that removes the 1-day offset from the indicator.

Daily SMA x2 With InputsIdeal for Intraday charts when you want to know the daily SMAs or for daily charts if you want to save on an indicator


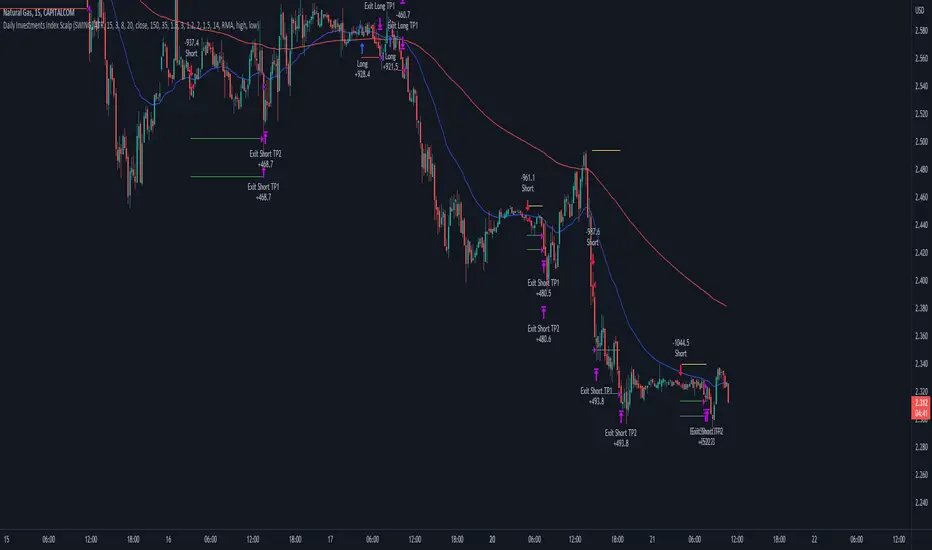
Daily Investments Index ScalpThis strategy is based on the DIDI index with our own confirmations and calculated SL/TP .
You can change every setting if you want it to use for another pair, but this is fine tuned for NATURALGAS
The entries are taken when:
Long:
- Buy signal from the DIDI indicator
- Long EMA is underneath the Short EMA
- Price must be Above the Long EMA
- TP1 (default) - ATR based first TP is ATR * 1.2 Multiplier
- TP2 (default) - ATR based first TP is ATR * 2 Multiplier
- TP2 SL is the strategy entry price when we hit the first TP
- SL (default) - Latest swing low with a look back of 17 candles
Short:
- Sell signal from the DIDI indicator
- Long EMA is Above the Short EMA
- Price must be Below the Long EMA
- TP1 (default) - ATR based first TP is ATR * 1.2 Multiplier
- TP2 (default) - ATR based first TP is ATR * 2 Multiplier
- TP2 SL is the strategy entry price when we hit the first TP
- SL (default) - Latest swing low with a look back of 17 candles
It's fairly simple, and i think you can use this base so extend your own strategy
Good luck :)
If you have any questions, feel free to comment
MUJBOT - ADVANCED DAILY OPENTitle: MUJBOT - ADVANCED DAILY OPEN
Description:
The "MUJBOT - ADVANCED DAILY OPEN" is a versatile and user-friendly TradingView indicator designed to enhance daily trading strategies by highlighting the daily open price on the chart. This indicator is particularly useful for traders who focus on intraday price movements around the opening price of the trading day.
Key Features:
Daily Open Line: Visually represents the opening price of each trading day on the chart, providing a clear reference point for the day's initial market sentiment.
Dynamic Testing Counter: Keeps track of how many times the price tests or crosses the daily open level within the day. This feature offers insight into the significance and market reaction to the daily open price.
Customizable Display: Includes an option to show or hide the daily open line and the testing counter label. Traders can easily toggle the display according to their preference, keeping their charts uncluttered.
Real-Time Updates: The label and line are dynamically updated in real-time with each new price bar, ensuring traders have the most current information at their fingertips.
Simplicity and Efficiency: With a straightforward design, the indicator adds minimal complexity to the chart while providing valuable trading information.
Usage:
Intraday Trading: Ideal for intraday traders, the indicator helps in identifying how the current price is behaving relative to the opening price, which can be a crucial factor in decision-making.
Support and Resistance: The daily open can act as a natural support or resistance level. Monitoring how the price interacts with this level can provide insights into potential breakout or reversal opportunities.
Trend Analysis: Observing the frequency of the daily open price being tested can give clues about the day's trend strength and potential continuation or reversal.
Customization Options:
Toggle the visibility of the daily open line and label.
The line extends six bars ahead from the daily open for clear visibility.
The label displays the daily open price and the count of how many times it has been tested.
Conclusion:
The "MUJBOT - ADVANCED DAILY OPEN" indicator is a valuable tool for traders who emphasize the importance of the daily open in their trading strategy. Its simplicity, combined with real-time tracking features, makes it an essential addition to the trader's toolkit on TradingView.
Feel free to modify or add any additional details specific to your trading strategy or indicator functionality.

Current price & Daily openFor those who likes clean chart:
I made a simple script that shows Current price based on the last candle color.
Also can show Daily open line based on the daily candle color.
Daily open line is same as strong support and resistance levels.
Mostly price shows strong responces on daily open line.
1: Daily open line color is blue if current price is above the daily open line.
And daily open line is red if current price is below the daily open line.
This means blue daily open line represents bullish daily candle and red daily open line represents bearish daily candle.
Simply you can expect Buy setup on the daily open line if it is blue and vice versa. That means you are following the daily trend, nothing else.
Always double confirm with your own trading style. It's not guaranteed.
You can use this script when you want to see daily price action or to find daily high lows.
This script helps to identify the following day high and lows too on the lower timeframe.
2: When you add drawing tools on your chart price labels are overlapping or if you choose not overlap then price moves up or down so you are not able to see current price easily.
This script helps to show current price on the last candle. You can easily see the current price.
Current price color is blue when last candle is bullish and it's red when last candle is bearish .
It always calculates last candle. So it could be weekly or 1 minute candle, whatever timeframe you working on.
Thank you.

ATR Daily LevelsPlots the daily ATR on the chart as upper and lower levels.
It can be use to adapt your trading in high and low periods of market volatility, determine reasonable target or take profit, entry at likely mean reversion, stop loss beyond normal flows etc...
More on the script behavior:
- Daily ATR upper/lower levels are applied on the current day low/high;
- The ATR value is defined by the last D1 bar;
- Shows up to D1 timeframe;
- Configuration for the indicator's period (default: 20 period ATR);
- Configuration for plotting the indicator on the the x axis with an offset/at begining of the day (default: offset);

Double Daily MAAdds a fast (default 50) and slow (default 200) daily moving average to your chart (no matter the timeframe of your chart). This is useful if you want to do a multiple timeframe analysis on a single chart. For instance, institutional investors according to conventional wisdom behave different when the price is above or below the daily 200 SMA. If you are an intraday trader, this might be good information to have.

Daily SMA (Historical Plotting with RTH/ETH, (5))Daily SMA (RTH/ETH Dynamic Session Handling) — Midnight + RTH Open Locks
This indicator plots projected daily Simple Moving Averages (SMAs) on intraday charts by anchoring calculations to a Regular Trading Hours (RTH) daily SMA reference, while visualizing how the daily SMA evolves intraday during Extended Trading Hours (ETH) and RTH sessions.
When daily SMAs are evaluated strictly at the daily timeframe, they do not form a continuous intraday history and may appear flat on historical intraday bars until realtime bars begin updating. This script visualizes the daily SMA’s intraday progression while keeping the underlying daily SMA reference unchanged.
Purpose
Standard daily SMAs plotted on intraday charts are evaluated at the daily timeframe and therefore do not form a continuous intraday history. When charts are refreshed or reloaded, these values may appear flat until realtime data resumes.
This script addresses that visualization limitation by projecting the daily SMA across historical and realtime intraday bars, while keeping the daily SMA reference intact.
How it works
• Daily SMA seed values are sourced exclusively from an RTH-only daily timeframe series.
• At ETH midnight, the SMA seed is locked using completed daily closes from the RTH daily series.
• At the RTH open, the seed is re-locked using the completed RTH daily window.
• After each seed event, the SMA is projected intraday using the active chart bar’s price.
Price semantics
• Historical bars use fully closed candle data only.
• The realtime bar uses the last traded price until the candle closes.
• Once a bar closes, its value is final and does not repaint.
Higher-timeframe data usage
• request.security() is used intentionally to access daily SMA data.
• lookahead=barmerge.lookahead_on is used only to reference the developing daily timeframe value during the active session for projection purposes.
• No future bars are accessed and no historical values are retroactively altered.
Data integrity
• SMA seed values are derived solely from the daily timeframe and do not depend on intraday bar history.
• SMA values are computed forward from the locked seed and do not revise prior bars.
• If insufficient daily history exists for a symbol, values safely return na.
Scope and limitations
• Intended for chart timeframes up to and including daily.
• Designed for instruments with defined RTH sessions (such as equities and equity-based products).
• This script does not replace or modify the underlying daily SMA reference; it visualizes an intraday projection anchored to the RTH daily SMA.
Other notes
• Pine Script version: v6
• No future data access
• No historical repainting; only the active realtime bar updates until close

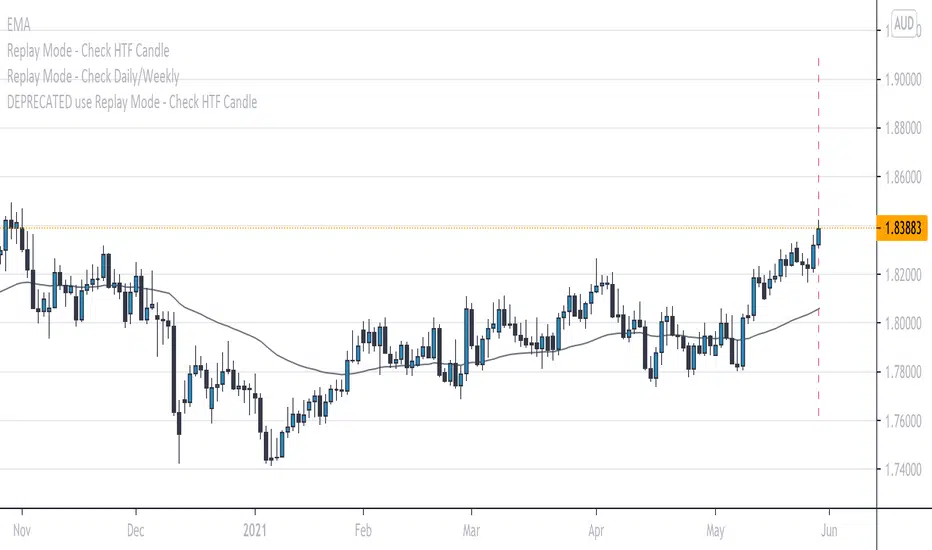
Replay Mode - Check Daily/WeeklyThis indicator is intended to be used while using Replay Mode.
It is similar to the built-in Session Breaks, but has the benefit of not needing to remove one candle before checking the Daily.
When on an intraday chart (timeframe less than Daily), a vertical line will be drawn when you can safely check the Daily or Weekly candle without seeing future price.
When the line is the color of your Daily settings, it is safe to check the Daily candle.
When the line is the color of your Weekly settings, it is safe to check both the Daily and Weekly candle.
Daily Volume Metrics BoxDaily Volume Metrics Box
A powerful tool for monitoring intraday trading metrics in real-time. This indicator provides a clean, customizable display of key market statistics that reset daily.
🔑 Key Features:
- Daily Volume Distribution - Track positive and negative volume separately
- Net Volume Analysis - Monitor the balance of buying vs selling volume
- Average Candle Size - Dynamic calculation of recent price movement magnitude
- Flexible Positioning - Place the metrics box in any corner of your chart
- Auto-Reset - All metrics automatically reset at the start of each trading day
- Current Date Display - Always know which day's data you're viewing
📊 Metrics Explained:
1. Avg Size: Average candle size over your specified lookback period
2. Pos Vol: Accumulated volume from up-moves during the current day
3. Neg Vol: Accumulated volume from down-moves during the current day
4. Net Vol: The difference between positive and negative volume (Pos Vol - Neg Vol)
⚙️ Customization Options:
- Number of candles for average (1-∞)
- Background color and transparency
- Text color
- Box position (Top/Bottom, Left/Right)
- Distance from chart edge (1-5 bars)
📌 Usage Tips:
- Use larger lookback periods for more stable average candle size
- Position the box where it won't interfere with your chart analysis
- Monitor net volume for potential trend strength confirmation
- Compare positive and negative volume for insight into price momentum
🔄 Daily Reset:
All volume metrics reset at the start of each trading day, ensuring you're always looking at current day data only.
Perfect for day traders, swing traders, and anyone who wants to monitor intraday market dynamics with clean, organized metrics.
Note: This indicator works best on intraday timeframes where volume data is available.

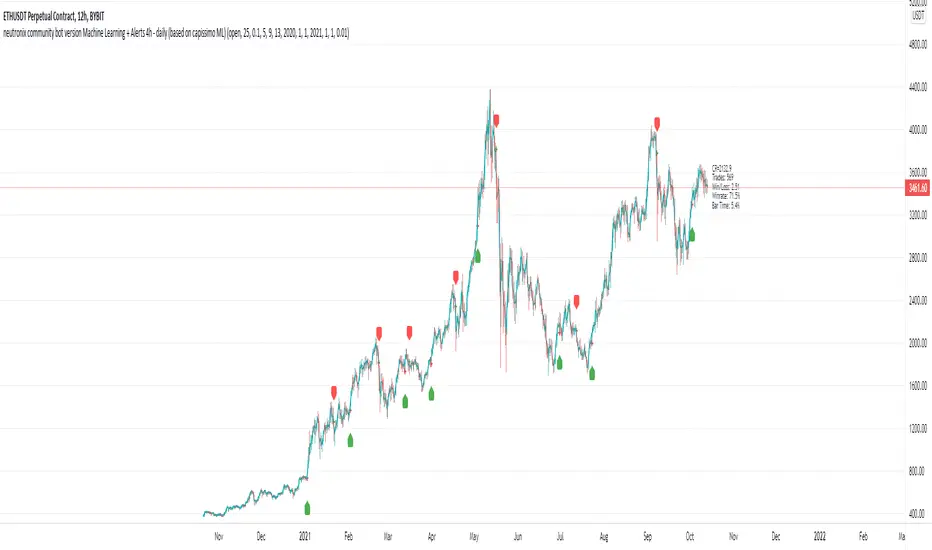
neutronix community bot ML + Alerts 4h-daily (mod. capissimo)Gm traders,
i have been a python programmer for some years studying artificial intelligence for general purpose; after some time i finally decided to have a look at some finance related stuff and scripts.
Moved by curiosity i've decided to make some but decisive modifications to a script i tried to use initially but without success: the LVQ machine learning strategy.
So after studying the charts and indicators, i have rewritten this script made by Capissimo and added heavy filtering thanks to vwap and vwma, then fixed repaint and other issues.
I hope you enjoy it and that it could increase your possibilities of success in trading.
HOW TO USE THE SCRIPT
Add the script to 3h+ charts like for example BTC 4h, 6h, 8h, 12h, daily. (In order for it to work on shorter timeframes charts you can try to change to lookback window but i dont advise it).
Change only rsi and volfilter(volume filtering) settings to try to find the best winrate. Leave dataset to open. Fyi the winrate isn't 100% accurate but can give you a raw vision of final results.
Use alerts included for trading and and in options click on 'Once per bar'. If you have checked 'Reverse Signals' in the control panel you have got more 'risky' signals so be advised if trading futures and stocks.
Exit trade signals not provided, so it is recommended the use of take profits and stop loss (1.5:1 ratio)
As always, the script is for study purposes. Do not risk more than you can spend!
Original LVQ-based strategy made by capissimo
Modified by gravisxv 13/10/2021
Daily Levels & MAs on intraday timeframeDaily Levels & MAs - Professional Key Level Tracker
📊 OVERVIEW
A comprehensive indicator that displays critical daily moving averages and key price levels all in one clean view. Perfect for traders who need to see support/resistance zones and trend indicators without cluttering their charts.
🎯 WHAT IT SHOWS
Seven essential reference levels:
- 50 SMA (Daily Simple Moving Average) - Yellow
- 21 EMA (Daily Exponential Moving Average) - Red
- 9 EMA (Daily Exponential Moving Average) - White
- Prior Day High (PDH) - Green
- Prior Day Low (PDL) - Purple/Magenta
- Premarket High (PM High) - Purple
- Premarket Low (PM Low) - Orange
✨ KEY FEATURES
✓ All lines extend to the right with clear price labels
✓ Daily moving averages calculated from daily timeframe data
✓ Prior Day High/Low tracks ONLY regular trading hours (9:30 AM - 4:00 PM)
✓ Premarket levels capture 4:00 AM - 9:30 AM price action
✓ Dotted line style keeps chart clean and readable
✓ Semi-transparent labels don't obstruct price action
✓ Works on ALL intraday timeframes
✓ Auto-updates throughout the day
🔧 TECHNICAL SPECIFICATIONS
- Lines start from beginning of current trading session
- Labels positioned 10 bars to the right of current price
- Max lines: 500 (efficient performance)
- No repainting - uses confirmed historical data
- Premarket lines remain visible during regular hours
📈 IDEAL FOR
- Day traders tracking intraday support/resistance
- Swing traders monitoring key daily trend levels
- Gap traders who need premarket reference points
- Breakout traders watching PDH/PDL violations
- Trend followers using EMA crossovers
💡 HOW TO USE
**Moving Averages:**
- 50 SMA: Long-term trend direction
- 21 EMA: Medium-term momentum
- 9 EMA: Short-term trend and quick reversals
**Price Levels:**
- PDH/PDL: Yesterday's trading range boundaries
- PM High/Low: Today's premarket extremes
- Watch for breaks above/below these levels for potential momentum
🎨 COLOR CODING
- Yellow: 50 SMA (major trend)
- Red: 21 EMA (medium trend)
- White: 9 EMA (fast trend)
- Green: Prior Day High
- Purple/Magenta: Prior Day Low
- Purple: Premarket High
- Orange: Premarket Low
⚙️ SMART FEATURES
- Prior Day calculations exclude premarket/afterhours noise
- Premarket levels reset daily at 4:00 AM
- All levels visible simultaneously without overlap confusion
- Labels show exact price values for precision entries/exits
- Lines automatically adjust length as trading day progresses
📊 TRADING STRATEGIES
**Breakout Trading:**
- Long above PDH with volume confirmation
- Short below PDL with momentum
**Mean Reversion:**
- Fade extremes back to moving averages
- Look for price rejections at PM High/Low
**Trend Following:**
- Buy pullbacks to 9 EMA in uptrends (price above 21/50)
- Sell rallies to 9 EMA in downtrends (price below 21/50)
**Gap Trading:**
- Compare open to PDH/PDL
- Use PM levels to gauge early sentiment
🔒 NO CONFIGURATION NEEDED
Simply add to your chart and start trading! The indicator automatically:
1. Calculates daily moving averages from higher timeframe
2. Tracks prior day regular hours high/low
3. Monitors current premarket session extremes
4. Displays everything with clear labels and prices
Perfect for professional traders who want institutional-grade levels without the complexity!
