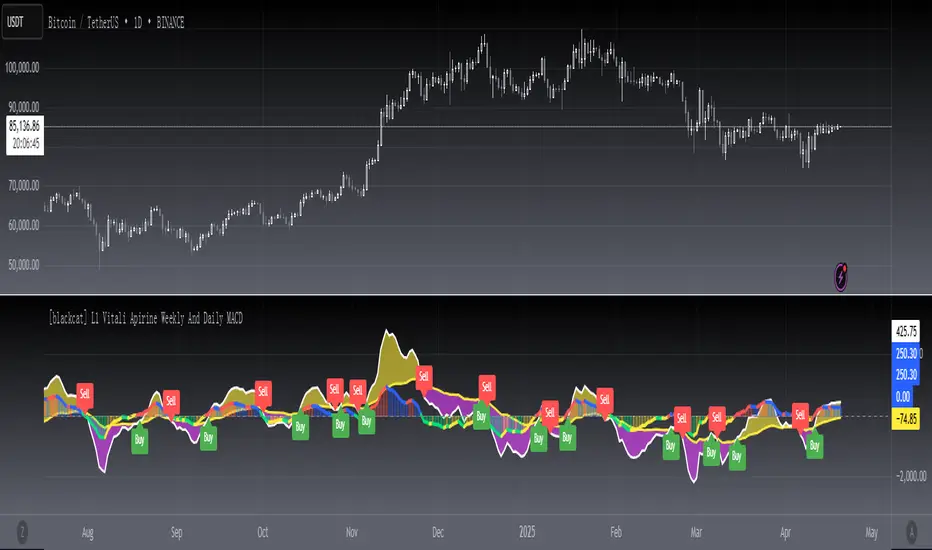
Daily Moving Average to Intraday Chart BradleyRUses Robertob's Script with Mike's colors for Warrior Pro Students.
Search in scripts for "daily"
BTC Swinger v1Daily interval swing trading algorithm based on momentum techniques using ATR Stops. Made by Kory Hoang from Stably.
Shout out to the Advanced Crypto Asset Trading crew! ;)
MY_CME eod OI vs CFTC eow OIDaily e-o-d Open Interest as published by CME.
As CFTC COT Open Interest relates to last Tuesday, here you can have an idea how things evolved day-by-day since then.
As CME total OI is not accessibl as data, here I sum OI of the next 9 outstanding contracts, which gives a fair idea of the trend in OI
MTF EMA Combo with Background ColorDaily/Weekly EMA combo for longer term trend direction, with combo background color for varying trend direction.
Daily Average True Range OverlayPlots the upper and lower average true range away from the previous days close on all time frames.
Daily Deviations (Lazy Edition)
Plots the standard deviation resistance/support lines.
Uses Previous days close and the VIX as the volatility factor.
credit to u/UberBotMan and u/Living_Granger for the idea and formulas
Daily Deviations (Self Input Version)
Plots the standard deviation resistance/support levels.
Input the previous settlement price and the implied volatility.
credit to u/UberBotMan and u/Living_Granger for the idea and formulas
(preview example is using settlement of 2420 and IV of 11)
Daily Returns & STDWhat happened last time when xx increased by xx%? - Start collecting some stats!
You can choose the ticker and the timeframe you're interested in
RSI Oversold/UndersoldThe study script will place GREEN BUY arrows BELOW oversold conditions and RED SHORT arrows ABOVE overbought conditions. You can configure the period
Most RSI(14) indicators use a 14-period, I prefer a 5-period. The period, overbought and oversold periods are settings that can easily be changed by adding this study to your chart and clicking the "gear" icon next to the study inside your chart.
Daily SMAThis pine script on intraday chart is exactly the same SMA as built-in MovingAverage on a 1Day chart (with the same lengths)
Position Size calculatorOverview
This indicator automatically calculates the average candle body size (|open − close|) for the current trading day and derives a position size (quantity) based on your fixed risk per trade (default ₹1000).
For example:
If today’s average candle body = ₹3.50 and risk = ₹1000 → Quantity = 285
How It Works:
The indicator calculates the absolute difference between open and close (the candle’s body) for every bar of the current day.
It averages those body sizes to estimate the average daily volatility.
Then it divides your chosen risk per trade by the average body size to estimate an appropriate quantity.
It automatically resets at the start of each new day.
Why Use It
While risk size can be derived manually or using TradingView’s built-in Long/Short Position Tool, this indicator provides a faster, more practical alternative when you need to make quick trade decisions — especially in fast-moving intraday markets .
It keeps you focused on execution rather than calculation.
Tip
You can still verify or fine-tune the quantity using the Long/Short Position Tool or a manual calculator, but this indicator helps you react instantly when opportunities appear.
Multi Timeframe Market Structure ContinuationOverview
This indicator identifies Break of Structure (BOS) and Change of Character (ChoCh) patterns using multi-timeframe (MTF) analysis to filter high-probability trade setups. By aligning lower timeframe signals with higher timeframe bias, it helps traders enter positions in the direction of the dominant trend while avoiding counter-trend traps.
Multi-Timeframe Analysis
The indicator analyzes market structure on two timeframes simultaneously:
Current Timeframe (CTF): Detects immediate BOS and ChoCh signals for entry timing
Higher Timeframe (HTF): Establishes the overall trend direction (default: 1H, customizable)
Signals only appear when the current timeframe structure aligns with the higher timeframe bias, ensuring you're trading with the momentum, not against it.
Break of Structure (BOS)
BOS signals indicate trend continuation - when price breaks a previous high in an uptrend or a previous low in a downtrend. These are reliable entries that confirm the trend is still active and strong.
Change of Character (ChoCh)
ChoCh signals mark early trend reversals - when market structure shifts from bearish to bullish (or vice versa). When captured in alignment with the higher timeframe trend, ChoCh entries can achieve exceptional risk-to-reward ratios as they allow entry near the beginning of a new impulse move.
Exit Signals
Exit signals are plotted when a ChoCh occurs in the opposite direction of the HTF trend. For example, if the HTF is bullish and a bearish ChoCh forms on the current timeframe, an orange "EXIT" signal appears - warning long traders that the lower timeframe structure is shifting against them. This provides an early warning system to protect profits or minimize losses before the HTF trend itself reverses.
Trading Strategy Recommendations
Trending Markets (Recommended)
In strong trending conditions, both BOS and ChoCh signals can be taken when aligned with the HTF bias. ChoCh entries are particularly powerful as they catch early reversals within the larger trend, offering entries with tight stop losses and extended profit targets.
Ranging Markets
During consolidation or choppy conditions, it's best to be selective and take only BOS entries. BOS signals confirm that the trend is continuing beyond the range, reducing false breakouts and whipsaw trades that are common with counter-trend ChoCh signals in sideways markets.
Customization
Pivot Length: Adjust the sensitivity of structure detection (default: 5). Lower values detect structure more frequently with earlier but potentially noisier signals. Higher values provide cleaner, more significant structural breaks but with some delay.
Higher Timeframe: Customize the HTF to suit your trading style. Day traders might use 1H HTF on 5m charts, while swing traders could use 4H or Daily HTF.
Alert System
Six alert conditions available:
Long BOS Entry / Long ChoCh Entry
Short BOS Entry / Short ChoCh Entry
Long Exit / Short Exit
All alerts fire only on confirmed candle closes to eliminate repainting and false signals.
Visual Features
Color-coded background showing HTF bias
Clear BOS/ChoCh labels with horizontal lines at structure levels
Orange "EXIT" signals when structure breaks against your position
Gray lines tracking current swing highs/lows
HTF trend indicator in the top-right corner
ADR % RangesThis indicator is designed to visually represent percentage lines from the open of the day. The % amount is determined by X amount of the last days to create an average...or Average Daily Range (ADR).
1. ADR Percentage Lines: The core function of the script is to apply lines to the chart that represent specific percentage changes from the daily open. It first calculates the average over X amount of days and then displays two lines that are 1/3rd of that average. One line goes above the other line goes below. The other two lines are the full "range" of the average. These lines can act as boundaries or targets to know how an asset has moved recently. *Past performance is not indicative of current or future results.
The calculation for ADR is:
Step 1. Calculate Today's Range = DailyHigh - DailyLow
Step 2. Store this average after the day has completed
Step 3. Sum all day's ranges
Step 4. Divide by total number of days
Step 5. Draw on chart
2. Customizable Inputs: Users have the flexibility to customize the script through various inputs. This includes the option to display lines only for the current trading day (`todayonly`), and to select which lines are displayed. The user can also opt to show a table the displays the total range of previous days and the average range of those previous days.
3. No Secondary Timeframe: The ADR is computed based on whatever timeframe the chart is and does not reference secondary periods. Therefore the script cannot be used on charts greater than daily.
This script is can be used by all traders for any market. The trader might have to adjust the "X" number of days back to compute a historical average. Maybe they only want to know the average over the past week (5 days) or maybe the past month (20 days).
Humble Student OB/OS Trifecta indicatorAfter reading Cam Hui's blog post about his "Trifecta" bottom spotting model I thought I'd try my hand at scripting it as an indicator. The results are pretty close to what he describes. Though the data TradingView feeds me doesn't seem to be identical to what he's using on StockCharts.com the results are close enough that I will call the effort a success worth publishing.
BTC Backwardation SearcherThis Pine Script code is a custom indicator named "BTC Backwardation Searcher" designed for the TradingView platform. The indicator aims to identify and visualize the price difference between two Bitcoin futures contracts: CME:BTC1! and CME:BTC2!.
Here's a breakdown of the code:
1. The script fetches the daily close prices of CME:BTC1! and CME:BTC2! using the security() function.
2. It calculates the percentage price difference between the two contracts using the formula: (btc1Price - btc2Price) / btc2Price * 100.
3. The script also calculates the price difference for the previous two days (2 days ago and 3 days ago) using the same formula.
4. Two conditions are defined:
(1) dailyGreenCondition: If the price difference is greater than or equal to 0.3% for three
consecutive days, including the current day and the previous two days.
(2) dailyRedCondition(commented): If the price difference is less than or equal to -1% for three consecutive days, including the current day and the previous two days.
(I commented it out because I don't think it's useful.)
5. The plotshape() function is used to display green triangles on the chart when the dailyGreenCondition is met, and red triangles when the dailyRedCondition is met. These triangles are displayed on the daily, weekly, and monthly timeframes.
The purpose of this indicator is to help traders identify potential trading opportunities based on the price difference between the two Bitcoin futures contracts. The green triangles suggest a bullish scenario where CME:BTC1! is significantly higher than CME:BTC2!, while the red triangles indicate a bearish scenario where CME:BTC2! is significantly lower than CME:BTC1!.
However, it's important to note that this indicator should be used in conjunction with other technical analysis tools and fundamental analysis. Traders should also consider their risk tolerance, investment goals, and market conditions before making any trading decisions based on this indicator.