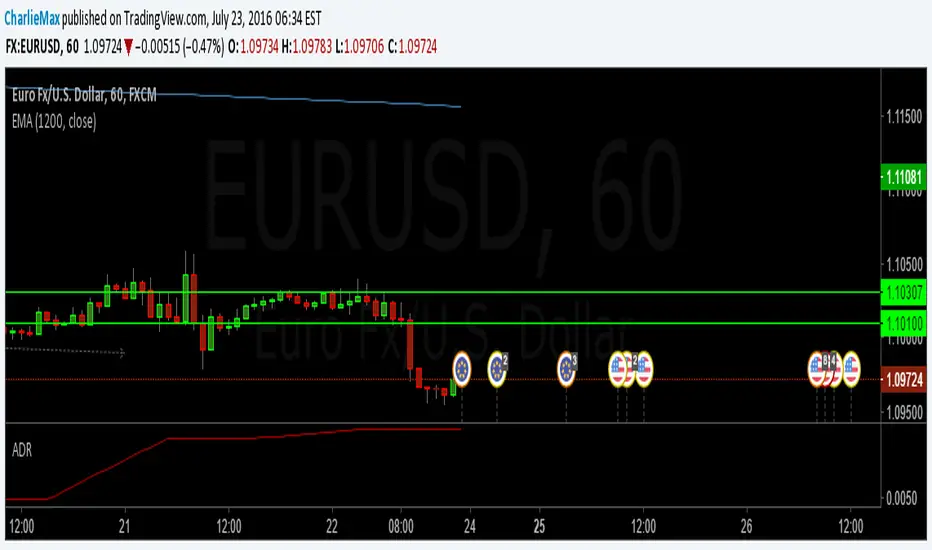
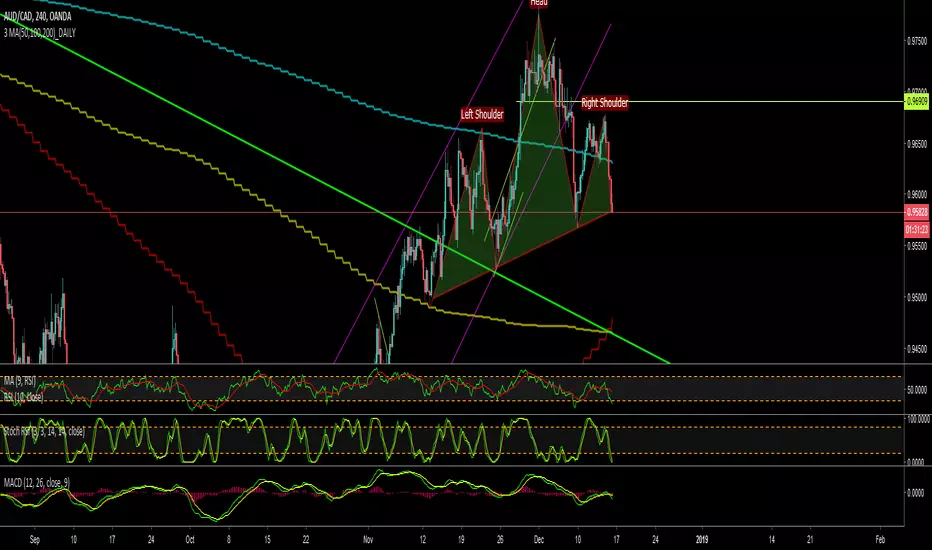
Code Plots - High, Low, Open, Close—Daily, Weekly, & Monthly!!!Custom Code Plots High, Low, Open, Close
Plots Today And/Or Previous Day
Daily, Weekly, & Monthly TimeFrames
Default Settings:
Green = High
Silver = Open
Fuchsia = Close
Red = Low
Current D-W-M = Circles as Plots
Previous D-W-M = Cross as Plots
By Default The Current Days High, Low, Open, Close Plots. There are Check boxes On The Inputs Tab To Turn All Options On And Off.
***Tip - For Intra-Day Trades…I Find It Useful To Plot Previous Days High, Low, Open, Close For Support/Resistance, & Breakout Levels. Plotting the Current Weekly and Monthly Levels Is Also Very Useful.
***If You Trade Daily Charts The Previous Months Levels Are Very Useful as Support/Resistance, & Breakout Levels….
Code For High, Low, Open, Close
pastebin.com
Video On Importing Custom Indicators from PasteBin:
videos.tradingview.com
Pine Script® indicator


