Daily 6 AM & 8 AM CST Linesit help so you can figure out 6am and 8am on cst time in americas very fast.
Search in scripts for "daily"


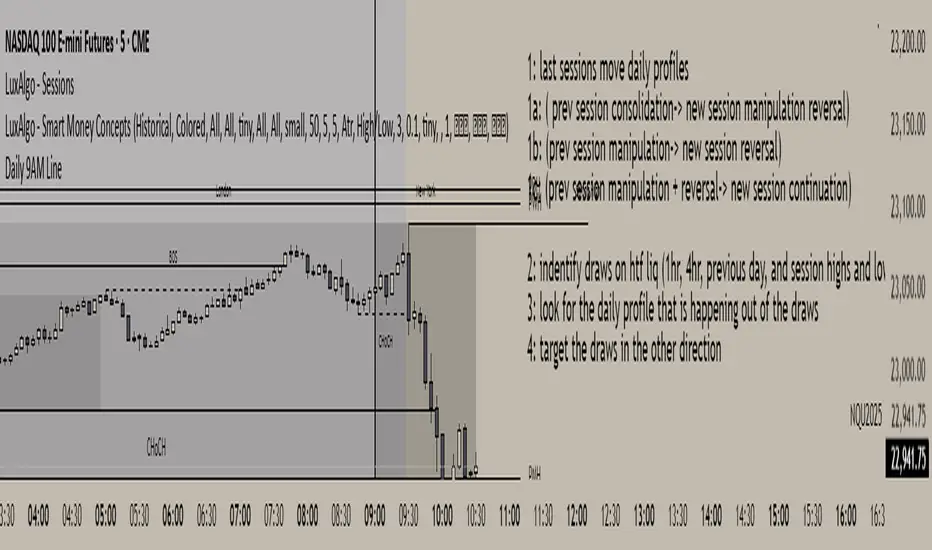
Daily 9AM Line
Draws a line at 9AM every day at market pre-open
Draws a line at 9AM every day at market pre-open
Draws a line at 9AM every day at market pre-open
Draws a line at 9AM every day at market pre-open
Daily Engulfing Zones Visually see engulfing candlestick pattern and capture explosive moves both up and down

Daily Moving Average to Intraday ChartPlaces 200D, 100D, 50D SMAs as well as the 20D EMA onto intraday charts. (Script v6)

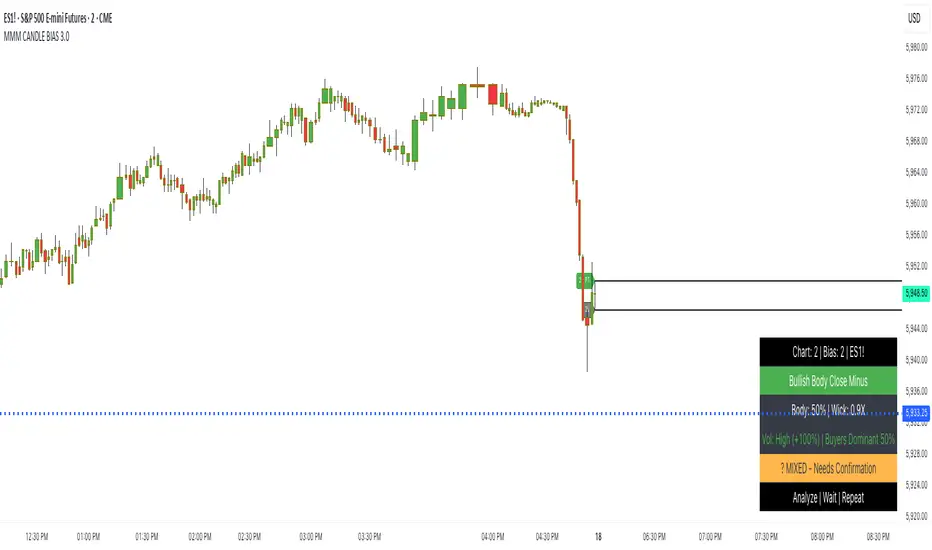
DAILY CANDLE PROFIT TARGET BIAS @MaxMaserati
Max Maserati Method for Candle Bias and effective price action Analysis
The MMM CANDLE BIAS 2.0 indicator, built on the proprietary Max Maserati Method, classifies candles to deliver clear, real-time market bias insights. It decodes price action, revealing institutional trading patterns often missed by retail traders.
The Six Core Candle Classifications: The Foundation of MMM Analysis
Master these six closing patterns, and you'll unlock the true language of price action. These are the building blocks of institutional trading behavior:
Bullish Body Close
Identification: Candle closes above the previous candle’s high.
Psychology: Strong buying pressure overcomes prior resistance.
Implication: Signals bullish trend continuation or reversal.
Bearish Body Close
Identification: Candle closes below the previous candle’s low.
Psychology: Intense selling pressure breaks past support.
Implication: Indicates bearish trend continuation or reversal.
Bullish Affinity
Identification: High tests or breaches previous low, but close stays within previous candle’s range.
Psychology: Buyers defend lower levels, rejecting downside.
Implication: Hidden bullish strength in consolidation.
Bearish Affinity
Identification: Low tests or breaches previous high, but close remains within previous candle’s range.
Psychology: Sellers cap upside attempts, gaining control.
Implication: Subtle bearish pressure despite failed breakout.
Seek & Destroy
Identification: Candle breaks both previous high and low, closing inside previous range.
Psychology: Institutions test liquidity on both sides before committing.
Implication: Direction depends on close—upper half (bullish affinity) or lower half (bearish affinity).
Close Inside
Identification: High and low stay within previous candle’s range.
Psychology: Consolidation with underlying directional bias.
Implication: Bias determined by close position relative to range.
Plus/Minus Strength System
Bullish Strength: Measures distance from low to close (buying pressure).
Bearish Strength: Measures distance from high to close (selling pressure).
Plus (+): Dominant strength significantly outweighs the other, indicating strong directional conviction.
Minus (-): Balanced strengths suggest a contested market, requiring caution.
Key Features
Automated Pattern Recognition: Instantly detects candle formations.
Color-Coded Bars: Green for bullish, red for bearish bias.
Dynamic Profit Targets: Projects targets based on higher timeframe high/low.
Real-Time Metrics: Displays bullish/bearish strength percentages and volume delta.
Customizable Table: Shows timeframe, symbol, bias, volume, and special note (“Analyze | Wait | Repeat”).
Bias Lines: Plots high/low lines on higher timeframe, with optional extension.
Labels: Customizable bias and profit target labels (Tiny, Small, Normal sizes).
Trading Advantages
Reveals institutional moves before retail traders react.
Detects reversals ahead of conventional indicators.
Enables precise entry timing with smart money.
Enhances risk management with clear strength signals.
Simplifies complex price action into actionable insights.
Profit Target Framework
Bullish Patterns: Target higher timeframe high.
Bearish Patterns: Target higher timeframe low.
Plus Strength: Expects direct move to target.
Minus Strength: Anticipates measured advance with potential pullbacks and/or violations.
Visual Implementation
Lines and Labels: High/low bias lines and profit target markers adapt to timeframe.
Table Display: Configurable position (top/middle/bottom, left/center/right) with key metrics.
Bar Coloring: Optional coloring based on bias or plus/minus strength.
Trader’s Mantra
"Analyze | Wait | Repeat" - Discipline turns market reading into consistent profits.
Elevate your trading with MMM CANDLE BIAS 2.0, where professional-grade analysis meets intuitive design.
Note: Based on the proprietary Max Maserati Method for educational and analytical use.
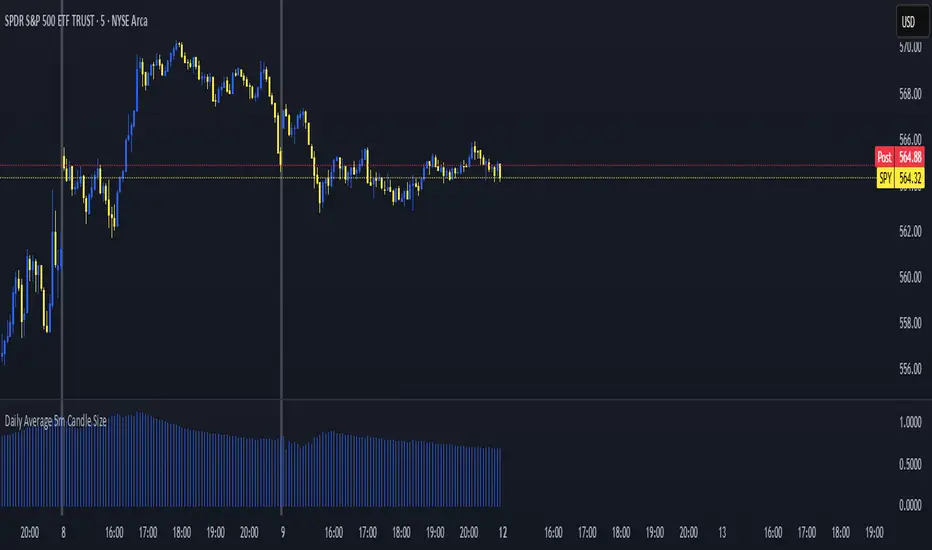
Daily Average 5m Candle SizeThis indicator measures the average size of each 5 min candle then works out the end of day average for you. Very important for profit targets and stops
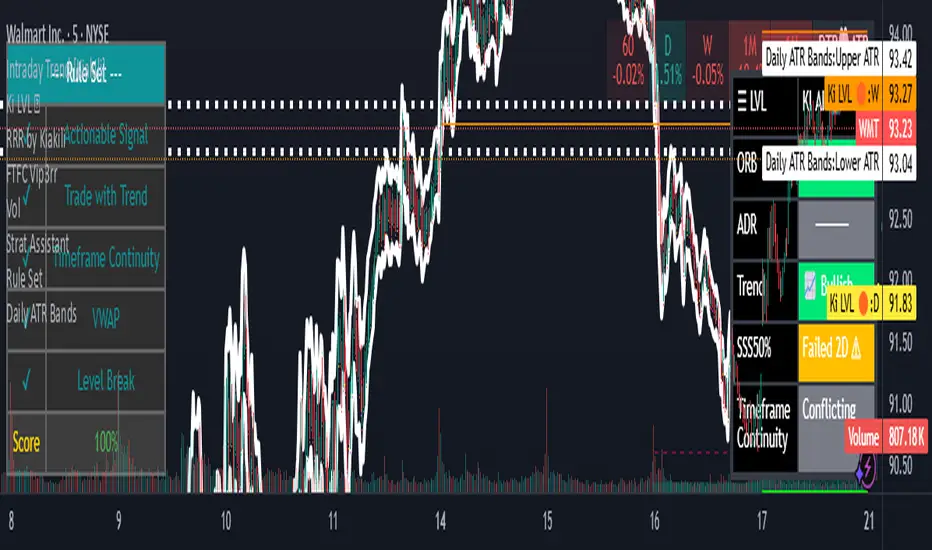
Daily ATR BandsATR Finder – Volatility Scanner for Smarter Trade Setups
The ATR Finder is a precision tool designed to help traders quickly identify high-volatility assets using the Average True Range (ATR) – a key metric in assessing market momentum and potential breakout zones. By automatically scanning and highlighting tickers or candles with elevated ATR values relative to their recent historical range, this indicator helps you filter for setups that are more likely to experience significant price moves.
Whether you're a day trader seeking intraday momentum or a swing trader looking for setups with strong follow-through potential, the ATR Finder cuts through the noise and visually signals which assets are "on the move." It can be paired with other indicators or price action tools to create a high-conviction trading strategy focused on volatility expansion.
Key Features:
Dynamic ATR Calculation over a user-defined period
Visual Alerts or Color-Coding for above-threshold volatility spikes
Supports Multiple Timeframes for both short- and long-term volatility analysis
Great for spotting breakout opportunities, gap continuations, or trend reversals
Use the ATR Finder to stay ahead of price action and build a watchlist that moves with purpose. Perfect for scalpers, breakout traders, and anyone who respects the power of volatility.
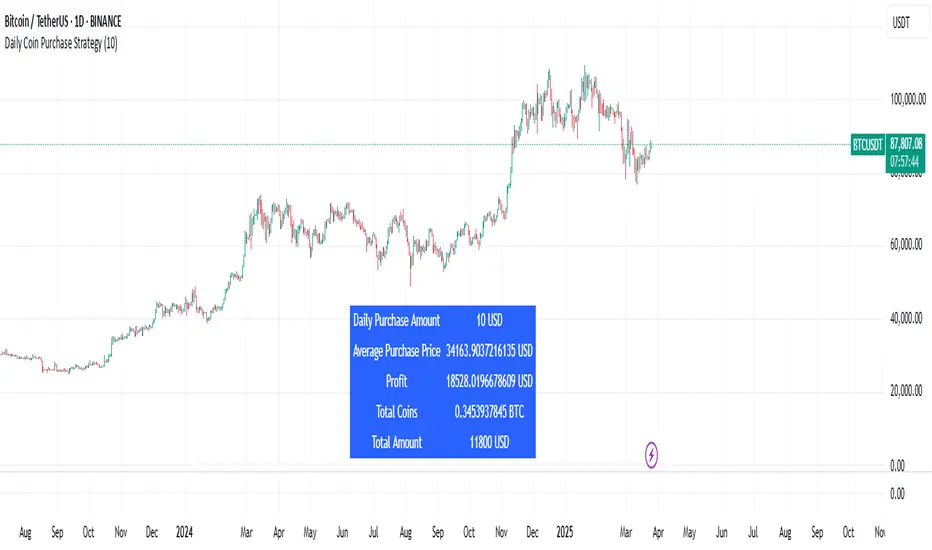
Daily Coin Purchase StrategyThis indicator helps investors track the profitability of their Dollar-Cost Averaging (DCA) strategy when buying crypto assets periodically over time. Users can customize the start date, purchase amount per cycle, and the frequency of purchases based on different timeframes (e.g., 15m, 1H, 4H, 1D).
Features:
✅ Flexible Configuration: Allows users to set the start date, purchase amount per cycle, and select the desired timeframe (15m, 1H, 4H, 1D, etc.).
✅ Automated Profit Calculation: Displays total investment, total coins accumulated, average cost per coin, and profit based on the current market price.
✅ Supports Multiple Timeframes: Users can choose to buy at intervals based on 15m, 1H, 4H, or 1D candlesticks.
✅ Helps Plan Investment Capital: Calculates the total capital needed to follow a DCA strategy over a given period, allowing for better financial planning.
✅ Visualizes Investment Profitability: Provides clear insights into the accumulation process and the overall performance of the strategy.
✅ Intuitive Charts: Displays the accumulation process and investment performance over time.
How to Use:
Set the start date for purchases.
Enter the desired amount to invest per cycle.
Select the timeframe for purchases (15m, 1H, 4H, 1D, etc.).
The indicator will automatically calculate the number of coins accumulated, the average cost per coin, and the overall profit.
🔹 Use Cases:
Monitor the effectiveness of the DCA strategy over time.
Compare profitability across different purchase intervals.
Optimize long-term asset accumulation strategies.
Plan financial resources effectively for long-term investment strategies.
This version keeps all the key details while ensuring clarity and accuracy. Let me know if you need any modifications! 🚀
Daily Open Rangethis indicator draw the open of the day with a box of high and low ( +1 and -1 ) automatically , you have the ability to select which hour you want to to draw from the inputs and you have the ability to change the style of the range as well
OANDA:XAUUSD

Daily ATR %Input parameters:
Number of bars for ATR (Y) - the number of bars to calculate the average ATR
Number of bars for median ATR (X) - the number of bars to calculate the median ATR, should be >= Number of bars for ATR
Stop ATK share in % - to calculate Stop Loss in % of ATR
Calculate the passed ATR from the previous day close - calculation of the passed ATR from:
True = closing prices of the previous day
False = from High/Low of the current day
The script calculates several parameters:
Decimal - the number of digits after the fractional part of the price
Close % - how much the previous day closed as a percentage of High/Low
Median - the median value for the X previous bars.
ATR is the average value for Y bars
C_ATR - passed ATR for the current day
C_ATR% - passed ATR in % excellent calculated
Stop - the calculated size of the Stop Loss from ATR
THE LOGIC OF CALCULATING THE ATR (the bar of the trading day is not taken into account):
1. Calculate the Median ATR for X previous bars.
2. We calculate the ATR for Y of the previous bars,
taking only those bars that fulfill the condition:
Median ATR * 50% < N < Median ATR * 200%
, i.e. we do not take into account bars that are less than the Median ATR by 2 times, and bars that are more than the Median ATR by 2 times

Anchor Buy Sell LevelsDaily Validity:
The indicator generates a single horizontal line (either a Buy Level or a Sell Level) that remains valid throughout the entire trading day.
Source of the Signal:
The level (buy or sell) is determined using candles that were generated before the day in question.
Selection Logic:
When determining the level, the indicator checks past candles in descending order (from the most recent backward).
The very first candle encountered that meets the respective logic (either the buy or sell condition) sets the level.
Buy and Sell Logic:
Buy Signal: Generated when a candle’s close is lower than both the previous candle’s close and the next candle’s close (i.e., a local minimum). The Buy Level is drawn at the low of that qualifying candle.
Sell Signal: Generated when a candle’s close is higher than both the previous candle’s close and the next candle’s close (i.e., a local maximum). The Sell Level is drawn at the high of that qualifying candle.
One Signal per Day:
For any given day, the indicator will display either a Buy Level or a Sell Level—not both. The decision is based on which qualifying candle (and its corresponding condition) is found first when scanning the historical data in descending order.

Daily Session Fibonacci LevelsPlots automatic Fibonacci retracement levels based on the current session high and low.
Levels for the prior and current session can be toggled on/off.
Optional: Toggle to show the Fibonacci Level labels.
Allows for customizable levels and colors; toggles for individual levels.

Daily Bubble Risk AdjustmentThis script calculates the ratio of the asset's closing price to its 20-week moving average (20W MA) and visualizes it as a color-coded line chart. The script also includes a customizable moving average (default: 111-day MA) to help smooth the ratio trend.
It identifies overbought and oversold conditions relative to the 20W MA, making it a valuable tool for long-term trend analysis.

Daily Directional Bias Indicator (S&P 500)This indicator is designed to help you be on the right side of the trade.
Most traders who struggle to know which way price may move are only looking at part of the picture. This Directional Bias Indicator uses both the Accumulation/Distribution Line and VIX for directional confirmation.
The Accumulation/Distribution Line
The Accumulation/Distribution (ACC) line helps us gauge market momentum by showing the cumulative flow of money into or out of an asset. When the ACC line is rising, it suggests that buying pressure is dominating, indicating a bullish market. Conversely, when the ACC line is falling, it suggests that selling pressure is stronger, indicating a bearish market. By comparing the ACC line with the VWAP, traders can see if the price is moving in line with the overall market sentiment. If the ACC line is above the VWAP, it suggests the market is in a bullish phase; if it's below, it indicates a bearish phase.
The VIX
The VIX (Volatility Index) is often referred to as the "fear gauge" of the market. When the VIX is rising, it typically signals increased market fear and higher volatility, which can be a sign of bearish market conditions. Conversely, when the VIX is falling, it suggests lower volatility and a more stable, bullish market. Using the VIX with the VWAP helps us confirm market direction, particularly in relation to the S&P 500.
VWAP
For both the ACC Line and VIX, we use a VWAP line to gauge whether the ACC line or the VIX is above or below the average. When the ACC line is above the VWAP, we view it as a sign that price will go up. However, because the VIX has an inverse relationship, when the VIX falls below the VWAP, we take that as a sign to go long.
How to use
The yellow line represents the ACC Line.
The red line represents the VWAP based on the ACC line.
The triangles at the bottom simply show when the ACC line is above or below the VWAP.
The triangles at the top show whether the VIX is bullish or bearish.
If both triangles (top or bottom) are bullish, this confirms that the price of an asset like the S&P 500 will likely go up. If both triangles are pointing down, it suggests that price will fall.
As always, test for yourself.
Happy trading!

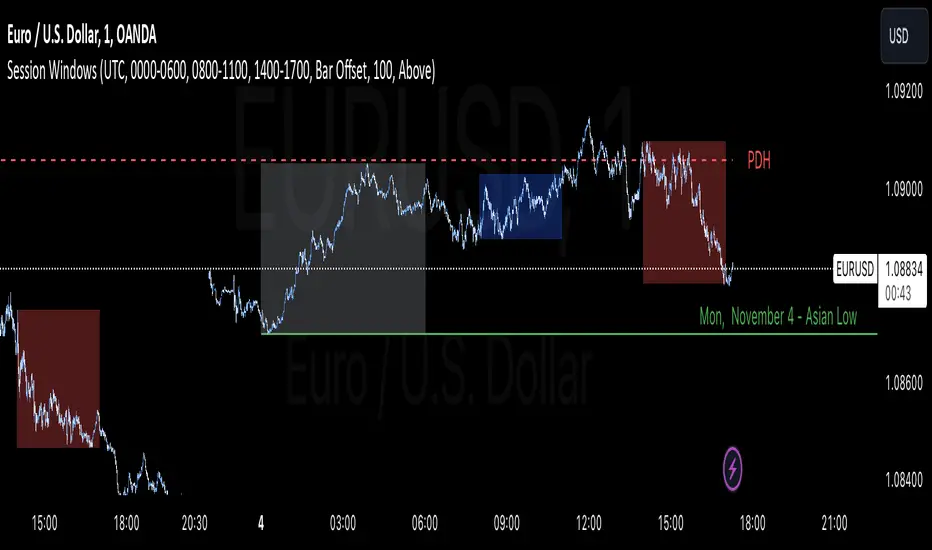
Daily Structure Cycles - Session - PDH/PDLDescription:
The Session Windows indicator visualizes predefined trading sessions on the chart, highlighting key price ranges with customizable background colors and labels. Designed to track session-specific high and low levels, this tool provides visual guidance for analyzing market behavior across different trading windows. It includes three customizable sessions—Asian, Window 1, and Window 2—that can be toggled on or off.
How It Works:
Each session is marked with a colored box, representing the high and low range for that session. Border colors and box transparency can be customized, allowing for easy visual differentiation.
The indicator also displays the high and low levels of the previous day, marked as PDH (Previous Day High) and PDL (Previous Day Low). When the current price crosses these levels, the line style changes, signaling potential support or resistance levels.
Labels for each session high and low are positioned based on the user-defined offset and alignment options, providing easy-to-read markers at the end of each session.
Usage: This indicator helps traders observe price behavior within distinct trading sessions and how the current price interacts with previous day’s highs and lows, which may offer insight into support/resistance zones. Traders can use this tool to spot breakout or reversal points as price moves through session highs/lows or crosses the previous day’s levels.
Customization Options:
Session Settings: Choose session times for Asian, Window 1, and Window 2.
Color Settings: Set different colors for session background and border lines.
Label Positioning: Adjust label offset and vertical position for high/low markers.
PDH/PDL Levels: Toggle lines for previous day’s high and low, with color and line style options.
Limitations: This indicator is designed for visualization purposes and is best used alongside other tools for confirmation, as it does not provide standalone buy or sell signals.
Daily Volatility Limit Channel
Hello, this is the simplest yet most powerful tool I have discovered regarding volatility. Using the ATR17 value based on a 4-hour timeframe, this tool displays the most significant volatility thresholds for the day, clearly showing when strong trends occur as these boundaries are breached. Once a boundary is crossed, the price of Bitcoin (as well as other actively traded asset classes like stocks and futures) tends to continue moving in the direction of the breakout. If the price reaches a boundary but fails to break through, this point often becomes the lowest point of pullback or correction, effectively serving as a pivot point and the optimal entry for buying.
The indicator features color and arrow options, enhancing your trading experience. The arrows appear below the candles when the trend changes to an upward impulse and above the candles when it shifts to a downward impulse. This visual aid allows traders to quickly identify trend reversals and make informed decisions.
In summary, this tool effectively highlights volatility limits and trend reversals, making it a valuable asset for any trader looking to navigate the market efficiently.
This indicator is recommended for use on 2-hour or 4-hour candlestick charts. These timeframes allow for clearer visualization of volatility and help effectively identify strong trends and volatility boundaries.
안녕하세요. 이것은 변동성에 관해 제가 발견한 것 중 가장 심플하고도 강력한 툴입니다. 4시간 기준의 ATR17값을 사용한 이 툴은 당일의 가장 강력한 변동성 한계점을 보여주며, 이 변동성 경계가 돌파될 때 강한 추세가 일어나는 것을 명확히 보여줍니다. 한 번 경계가 돌파되면 비트코인 가격(그리고 주식, 선물 등 다른 대부분의 모든 가격을 가지고 활발하게 거래되는 자산군)은 해당 돌파 쪽의 트렌드로 계속 움직이는 경향이 있습니다. 만약 가격이 경계에 도달한 채로 이 경계를 돌파하지 못할 때는 이 자리가 눌림과 조정의 최저점, 즉 피봇 포인트가 되어 매수의 최적 지점이 되는 것을 보실 수 있습니다.
지표에는 컬러 옵션과 화살표 옵션이 있어 거래 경험을 향상시킵니다. 트렌드가 상승 임펄스로 변경될 때 화살표가 캔들 아래에 나타나고, 하락 임펄스로 변경될 때는 캔들 위에 나타납니다. 이 시각적 도구는 트렌드 반전을 빠르게 식별할 수 있도록 도와주어, 거래자들이 정보에 기반한 결정을 내리는 데 유용합니다.
요약하자면, 이 툴은 변동성 한계와 트렌드 반전을 효과적으로 강조하여, 시장을 효율적으로 탐색하려는 모든 거래자에게 가치 있는 자산이 될 것입니다.
이 지표는 2시간 또는 4시간 캔들 차트에서 사용하는 것이 권장됩니다. 이러한 시간대는 지표의 변동성을 보다 명확하게 시각화하며, 강한 추세와 변동성 한계점을 효과적으로 식별하는 데 도움을 줍니다.

Daily Bias Engine | PDH/PDL Range This program is designed to track the previous day range and interactions with the mean threshold on the following day.
The bias strategy is simple:
If you create new range highs over a PDH, you will lean towards calls.
If you create new range lows over a PDL, you will learn towards puts.
If neither event happens, no bias can be determined and therefore no trades taken.
If by 12:00pm there still is no bias determined, it will show moderate strength based on the trend.
Remember, use this strategy to outline your bias and find a cheap entry model to take advantage of.

Daily Levels Percentual [TOLK] Settings Crypto and ForexPercentage zones refer to specific areas or bands on the price chart of a financial asset that are bounded by percentages of change relative to a reference point, such as the opening price or a reference value from a previous move.
These zones are useful for identifying support and resistance levels, predicting possible price reversals, or setting price targets. For example, on a price chart, you can create percentage zones to observe how the price behaves when it reaches 1%, 2%, 5%, 10%, etc., above or below a certain point.
These zones can be used in conjunction with other technical analysis tools, such as Fibonacci, moving averages, or volume analysis, to improve decision-making in trading strategies.
The default indicator levels are as follows:
SETTINGS Crypto:
Crypto Level 1 > 1.0%
Crypto Level 2 > 1.618%
Crypto Level 3 > 2.0%
Crypto Level 4 > 2.618%
Crypto Level 5 > 3.618%
Crypto Level 6 > 4.618%
Crypto Level 7 > 5.0%
Crypto Level 8 > 7.618%
Crypto Level 9 > 10.0%
Crypto Level 10 > 12.618%
Crypto Level 11 > 13.618%
Crypto Level 12 > 15%
Crypto Level 13 > 17.618%
Crypto Level 14 > 20%
SETTINGS Forex:
Forex Level 1 > 0.10%
Forex Level 2 > 0.1618%
Forex Level 3 > 0.20%
Forex Level 4 > 0.2618%
Forex Level 5 > 0.3618%
Forex Level 6 > 0.4618%
Forex Level 7 > 0.50%
Forex Level 8 > 0.7618%
Forex Level 9 > 1.0%
Forex Level 10 > 1.2618%
Forex Level 11 > 1.3618%
Forex Level 12 > 1.50%
Forex Level 13 > 1.7618%
Forex Level 14 > 2.0%
Percentage Levels This approach helps identify critical price levels where the asset may encounter support or resistance, making it easier to make trading decisions based on price movement patterns.

Daily Data1. Purpose:
This indicator visualizes higher timeframe data on lower timeframe charts, facilitating multi-timeframe analysis. It recreates and extends the functionality of the MQL indicator of the same name in PineScript.
2. Key Features:
a. Higher Timeframe Candle Display:
- Displays monthly data by default, but users can select any timeframe.
- Customizable candle colors (bullish/bearish), wick, and body sizes.
- Adjustable offset to change display position on the chart.
b. Price Range Box:
- Shows the high and low range of the higher timeframe as a semi-transparent box.
- Customizable background color.
c. Fibonacci Levels:
- Displays 7 Fibonacci levels within the higher timeframe price range (0, 23.6%, 38.2%, 50%, 61.8%, 78.6%, 100%).
- Uses different colors for each level and shows level values as labels.
- Can be toggled on/off.
d. Information Labels:
- Remaining Time Display: Countdown to the end of the current higher timeframe candle.
- Delta Display: Shows price change from the open of the current higher timeframe.
- Distance from High/Low: Displays the difference between current price and high/low.
- Each label can be customized for visibility and color.
3. Special Features:
- Displays "MARKET IS CLOSED" when the market is not open.
- Time display format includes months, days, hours, minutes, and seconds, abbreviated as needed.
- Delta and distance values change color based on positive/negative values and are displayed with up/down arrows.
4. Customizability:
- Extensive input options allow users to fine-tune appearance and functionality.
- Individual settings for colors, sizes, offsets, and display items.
Daily data infoThis indicator can:
- Indicate on which day of the week created the High or Low
- Based on the bars you set, sum the times in which (The day of the week you want to test makes the Weekly High or Low)
- Has the option to Sum or calculate the %

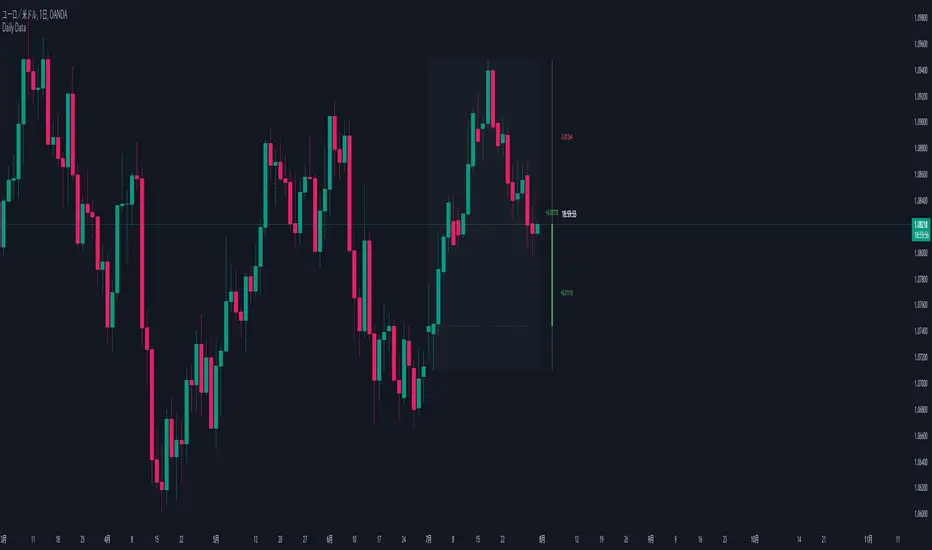
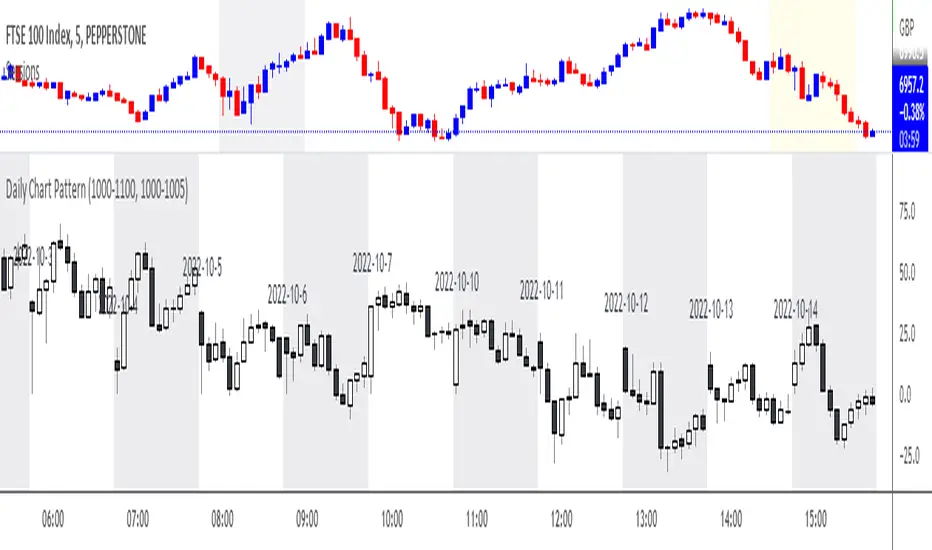
Daily Chart PatternWill automatically print all the candle pattern on the time range set, and move it to the right side for easy learning and simulation
daily high low close Levelsits different its day high and low indicator idgcaiucvai fUEFIFBIUE FWEFHEFBSD FSFHUFSIISDJHS DSDHSDINSDVJSD9 SDHSDVJNSDVSJDVH8S9DY SEFGSU BSIDVJBSDVIU S8DOHSDIVNSDV
