Search in scripts for "donchian"

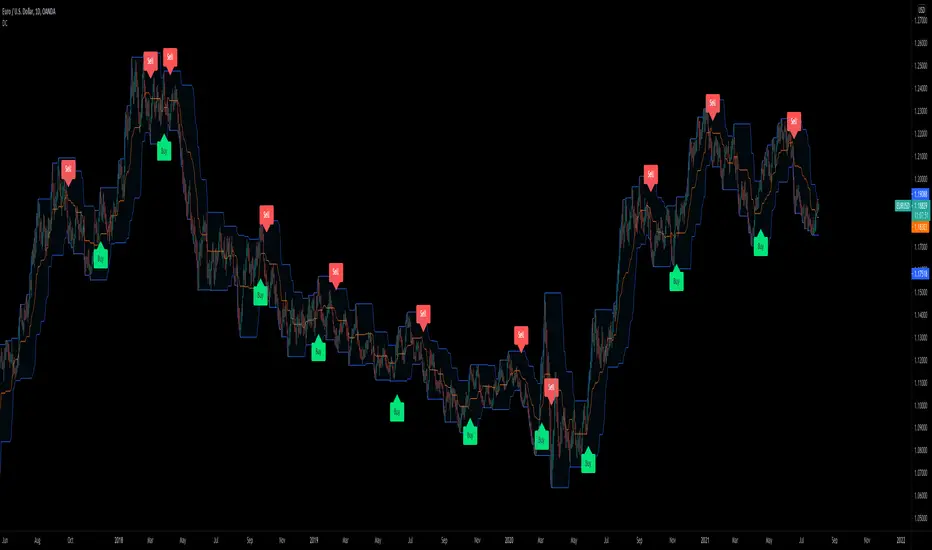
Donchian Fibonacci Trading ToolDONCHIAN FIBONACCI TRADING TOOL
This indicator is based on a Donchian Channel with Fibonacci zones I published before. Features are added which enable trading decisions, it suggests when to open either a long or a short position, it provides suggestions for a stop loss level and suggests a take profit level, the calculation of the take profit suggestion can be altered in the inputs. The user should devise a trading strategy on his own, several strategies are possible, but as a Donchian Channel is used, these must come down to refinements in the classical Turtle Trading system.
NO LAGGING
Donchian Channels have no lagging, this tool being based on these, has none as well. The only added feature with a little lagging is the Hull MA, all other features work at once and report right now the historical context of the present bar or candle even while it is developping.
ANY TIME FRAME
This indicator works in any time frame. However, when the user sets the prediction calculation to percent, then in small intraday time frames the result will be relatively huge.
FALSE SIGNALS
Fibonacci retracement levels are based on inclinations which exist in nature and which also exist in the financial markets. The expectations, labeled ‘DFT: expect’, based on these levels, are usually correct. The take profit levels otoh, labeled ‘DFT: predict’, are usually incorrect. The trader should take care and needs proper ‘gut feeling’ in using these
FEATURES TRIGGERED BY THE MARKET ENTERING OR LEAVING ZONES
1. REACTIVE COLORS
The zone in which the close is, is brighter coloured.
2. ENTRY AND EXIT MARKERS NEAR UP- OR DOWN TREND ZONES
If the close enters the Up Trend or Down Trend zone, coming from another zone, a triangle is placed just outside the channel border. If it leaves the zone, an X cross is placed.
3. MARKET SITUATION EXPECTATION LEVELS (OFFSET)
The indicator can report four market situations which may be valid for the last candle:
3.1. Market is in up trend: a blue dot is placed in an offset (=future) position of the High Border,
expect levels are placed offset of High Border and the Highest Fibonacci line,
3.2. Market is in down trend: a red dot is placed offset the Low Border, also expect levels offset the Low Border and the Lowest Fibonacci line.
3.3. Market is high ranging, i.e. last break out was at High Border and market is not in up- or down trend. A green dot is placed offset the Center High Fibonacci line and expect levels offset the Highest and Center Low Fibonacci lines.
3.4. Market is low ranging, i.e. last break out was at Low Border and market is not in up- or down trend. A brown dot is placed offset the Center Low Fibonacci line and expect levels offset the Center High and Lowest Fibonacci lines.
FEATURES TRIGGERED BY AN ATTEMPT TO BREAK OUT OF THE CHANNEL BORDERS
4. SWING LINE
When the High Border is touched, the Swing Line changes its level to the Highest Fibonacci line and changes its color to blue. When the Low Border is touched, the Swing Line changes its level to the Lowest Fibonacci line and changes its color to red. This way you can see whether the general trend is up- or down and also if and when the line has been crossed.
5. DIAMOND MARKERS (OFFSET)
These markers flash when the last bar or candle or the one before that, touches a channel border, the offset is equal to the expect levels.
6. PREDICTION LEVEL (OFFSET)
The prediction level flashes in the same situation as the diamond marker. The default level is 1 Average True Range. Most are in fact false signals. One can switch the prediction level off by setting the added amount to 0, then only the Diamond Markers will flash
OTHER FEATURES
7. HULL MOVING AVERAGE
Its direction provides an indication of the price dynamics.
8. SUPPRESSION OF PLOTTING SOME LAST VALUES
Quite a few lines stop before the last bar or candle. This way the last candle seem free loating and the chart reports only the values the user needs.
Enjoy, Eykpunter.

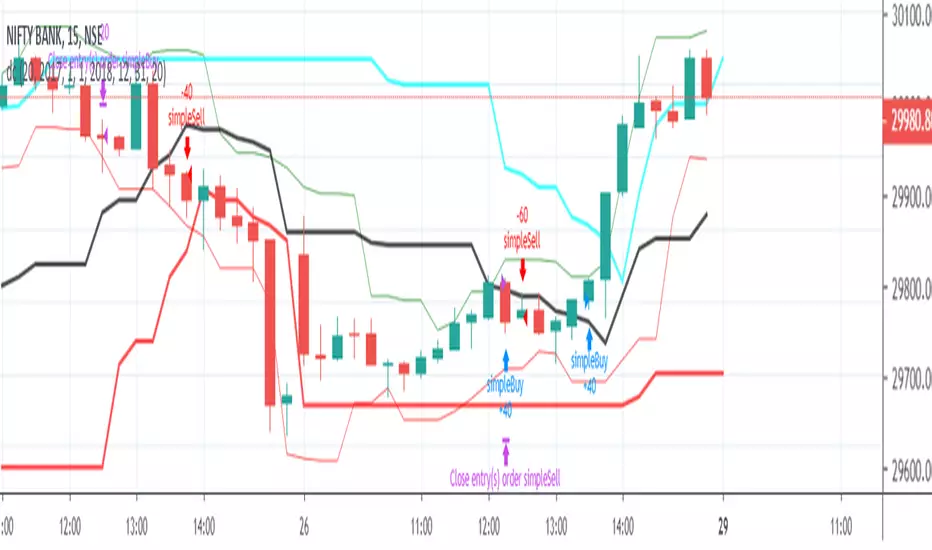
Donchian 1Based on the donchian bollinger that made before , then we can build signal by the channel
with alerts , take profit and stop loss
Donchian Channels Alert SystemThis time I was using an script/indicator that was originally written by ChrisMoody on 12-14-2014, as turned it an Alert System to know whether the price breaks above or below the donchian channel of 20 periods.
I would like to show you how easy is to use it and configure it to receive this alerts in your phone.
Here's a page about what Donchian Channels are for the ones that don't know already: www.investopedia.com
This simple indicator prints a green alert when the close price crosses above the upper band of the DC, and a red alert when the price crosses the lower band of the DC.
When these conditions are met, the indicator throws an alertcondition signal. You can personalize your Trading View alerts using this information.
Create new alert, In the condition select "DC Alert System" and below select "Break Above" or "Break Below" depending on the case you're looking for. Save the Alert and voila.
Simply as that.
The Donchian Channel period is set to 20 by default, but you can update it to what suit best for you.
Hope this is a +1 to your trade alert system.
Have a good day!
If you like this script please give me a like and comment below.

Donchian Reversal Signals with LabelsOverview:
This indicator is designed to identify potential reversal signals based on price action relative to two Donchian Channels. It plots **"BUY"** and **"SELL"** labels on the chart when specific conditions are met, helping traders spot potential trend reversals.
---
Key Features:
1. Dual Donchian Channels:
- The indicator uses two Donchian Channels with user-defined lengths (`length1` and `length2`).
- The upper band of each channel is the highest high over the specified period.
- The lower band of each channel is the lowest low over the specified period.
2. Reversal Signals:
- A yellow "BUY" label appears below a green (bullish) candle if:
- The previous candle is red (bearish).
- The previous red candle touches or breaches either of the lower Donchian Channels.
- A green "SELL" label appears above a red (bearish) candle if:
- The previous candle is green (bullish).
- The previous green candle touches or breaches either of the upper Donchian Channels.
3. Visual Clarity:
- The labels are placed above or below the candles for easy visibility.
- The use of colors (yellow for buy, green for sell) makes it intuitive to interpret the signals.
---
How It Works:
1. Donchian Channel Calculation:
- The upper and lower bands of the two Donchian Channels are calculated using the highest high and lowest low over the specified periods (`length1` and `length2`).
2. Candle Color Detection:
- The script identifies whether the current and previous candles are bullish (green) or bearish (red) based on their open and close prices.
3. Signal Conditions:
- For a **"BUY" signal**:
- The current candle must be green.
- The previous candle must be red and touch or breach either of the lower Donchian Channels.
- For a **"SELL" signal**:
- The current candle must be red.
- The previous candle must be green and touch or breach either of the upper Donchian Channels.
4. Label Placement:
- The labels are plotted using `shape.labelup` and `shape.labeldown` for clear visibility.
---
Input Parameters:
- **Donchian Channel Length 1 (`length1`)**: The period for the first Donchian Channel (default: 20).
- **Donchian Channel Length 2 (`length2`)**: The period for the second Donchian Channel (default: 34).
---
How to Use:
1. Add the indicator to your chart.
2. Adjust the lengths of the Donchian Channels if needed.
3. Look for **"BUY"** and **"SELL"** labels on the chart:
- A **yellow "BUY" label** below a green candle suggests a potential bullish reversal.
- A **green "SELL" label** above a red candle suggests a potential bearish reversal.
4. Use these signals in conjunction with other technical analysis tools for confirmation.
---
Example Use Case:
- If the price touches the lower Donchian Channel and forms a red candle, followed by a green candle, a **"BUY" label** will appear, indicating a potential upward reversal.
- If the price touches the upper Donchian Channel and forms a green candle, followed by a red candle, a **"SELL" label** will appear, indicating a potential downward reversal.
---
Customization:
- You can modify the lengths of the Donchian Channels to suit your trading style.
- The colors and text of the labels can also be adjusted in the script if desired.
---
Disclaimer:
This indicator is designed to assist traders in identifying potential reversal signals. However, it should not be used in isolation. Always confirm signals with additional analysis and risk management strategies.
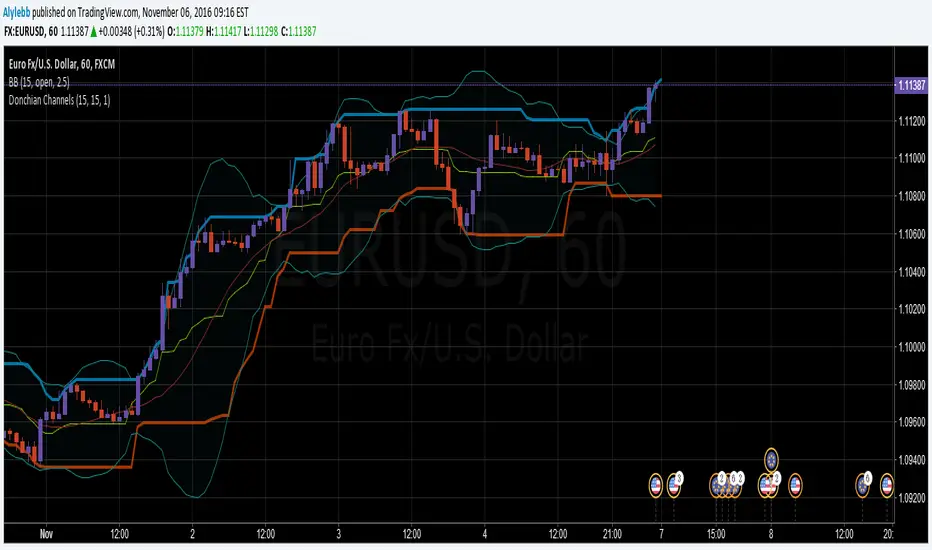
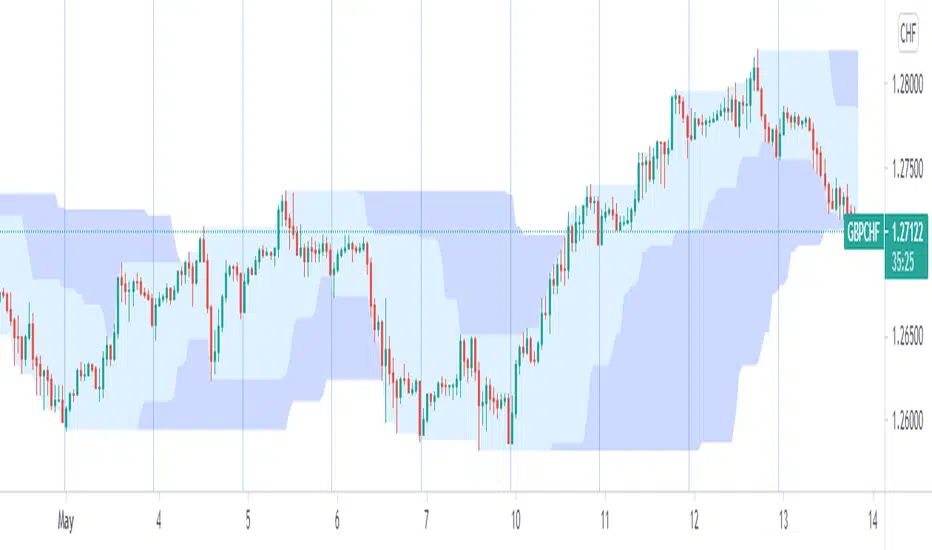
Donchian as bollingerThis indicator give as a donchian channel as bollinger
when the coin bellow the median the asset is bearish zone and opposite when its above the median
you can change the time frame=now on 1440 min
and the standart deviation of the donchian as you wish
so this model try to make the donchian channel to be more flexible like bollinger to some extent

Donchian Channels Multitimeframe JaimeSimple indicador with Donchian channels multitimeframe but you can see a cloud similar to ichimoku with the middle of the donchain channels between the actual timeframe and the upper one.

Donchian Channels strategy with backtestHere's another trading strategy for you. This one is based on the standard Donchian Channels.
This one will - by default - wait for 2 consecutive higher highs (or lower lows) before taking a position. This can be disabled so the script will take a new trade without waiting for the 2nd high or low.
This is useful to avoid getting into a trade when market makers are aiming for a swing-failure pattern (= taking out stop/losses below the last low or above the last high)
For people who don't like to short, there's also the option to exclude shorts.
Enjoy!
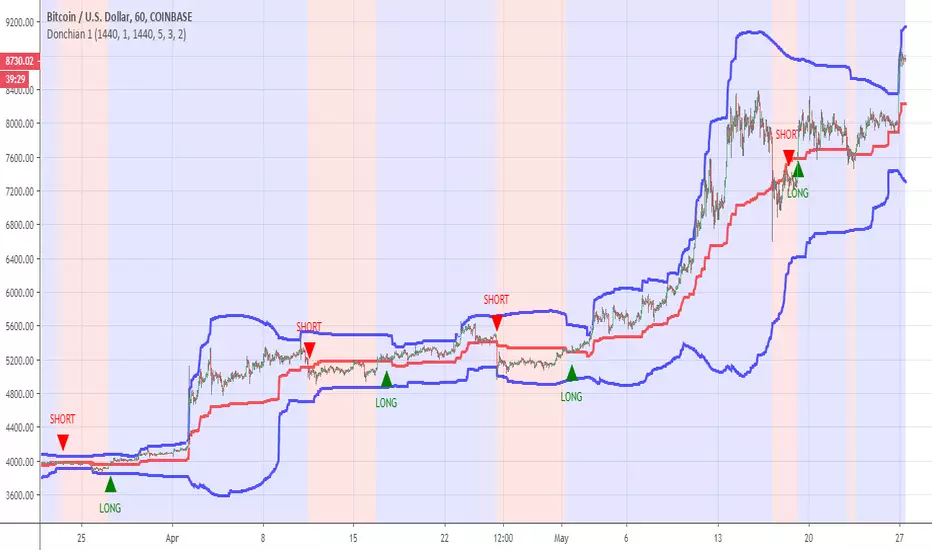
Donchian Strat EXMOThis is simple test of Turtle Trading strategy by Richard Dennis. The script meant to place orders on Donchian Channel borders. It's best to test and use on mid-term charts like 1H and more.
I've chosen Kraken XBT/USDT chart because this market opened in december 2019. The main problem of crypto trading strategy testing is the bullish market of 2017 year. That enormous growth gives unrealisting expectations to all trend-following strategies tested.

Donchian resistance and sup MTFThis model has Donchian channel support and resistance levels
if you want to buy and sell according to it then you need to activate the HIGH (resistance =sell) , LOW= support =buy
as you can make signal once they occur
It has MTF so you can see it in different time frame on your graph

donchian channelssimple donchian channels strategy. can be modified for long or short, futures / equities / crypto / forex
Donchian Channels [Gu5]█ OVERVIEW
I changed the design of the classic indicator "Donchian Channels", for easy reading.
█ CONCEPTS
Donchian Channels is an indicator made up of upper and lower bands around a mid-band or Basis.
The upper band marks the highest price of a security for N periods, while the lower band marks the lowest price of a security for N periods. The area between the upper and lower bands.
In this version, when there are new Higher High (HH), the trend is Bullish and the channel is painted green.
When there are new Lower Low (LL), the trend is Bearish and the channel is painted Red
█ OTHER SECTIONS
A plus in this script: When there are no new highs or new lows, there is no certain trend
The channel is painted yellow
www.tradingview.com
• HOW TO USE
Menu "Display"
• '■ Basis On/Off': Shows the midline Basis
• '■ Alert On/Off': Shows alerts labels
• '■ Fill On/Off': Paint the entire channel the color of the trend
• '■ Bar Color On/Off': Paint the candle the color of the trend
• '■ Close Alert On/Off': Shows alerts end of trend
• NOTES:
This code was written using the recommendations from the Pine Script™ User Manual's Style Guide
• RAMBLINGS:
You can use the "Basis" line as Trailing Stop.
• THANKS:
Donchian Channels developed by Richard Donchian
and many MANY thanks to @PineCoders

Donchian Channels Strategy - Long Term TrendFor Educational Purposes. Results can differ on different markets and can fail at any time. Profit is not guaranteed.
This only works in a few markets and in certain situations. Changing the settings can give better or worse results for other markets. This is a longer term trend following strategy that uses Donchian Channels for trend following and uses the upper and lower bands to find price breakouts to enter the market and then uses the middle band as a trailing stop to exit. DCs are known as the original trend following strategy made by Richard Donchian.
Usually the middle band uses the same length of the upper and lower bands in its calculation but I included the default option of using a middle band that is double the length of the other bands, but also an option to use the regular input length that most Donchian strategies use if needed. If long term trends are somehow found, this longer middle band lets the profits run longer and lets you see where the long trends were at if the market had any. The double lengthed middle band looks surprisingly very similar to a 3x ATR trailing stop, which is the recommended setting Wilder suggested for trend following. If a good ATR stop or other trailing stop can't be found, this longer middle band can act as a substitute for it.
For some reason I can't seem to find anything related to Donchian strategies on here despite the popularity and simplicity of it, not even a single working one to my liking, so I made my own. It seems this strategy only works in trending markets. I intentionally handpicked a market that the backtest does well on to illustrate the potential it might have for other markets where trending following strategies might work on and what to expect the results in those might be. Trend following strategies are said to have high profits but at the same time lower accuracy due to the failure rate of being able to catch the right trend. If you all got any suggestions or feedback please let me.

donchian diff [LM]Hello traders,
I would like to present you Donchian diff script. The idea behind this script is that as in Ichimoku I consider base line as equilibrium so I calculate percentages between base line and current price and calculate percentage between base line and conversion line and use them as a filter. For signals I used also that candle has to be highest or lowest in x(configurable) consecutive candles.
It has following setting:
Base line setting
Conversion line setting
buy/sell signal setting - here you can setup buy/sell condition
filter setting - here you can set up percentages of the distances
Hope you will enjoy it,
L

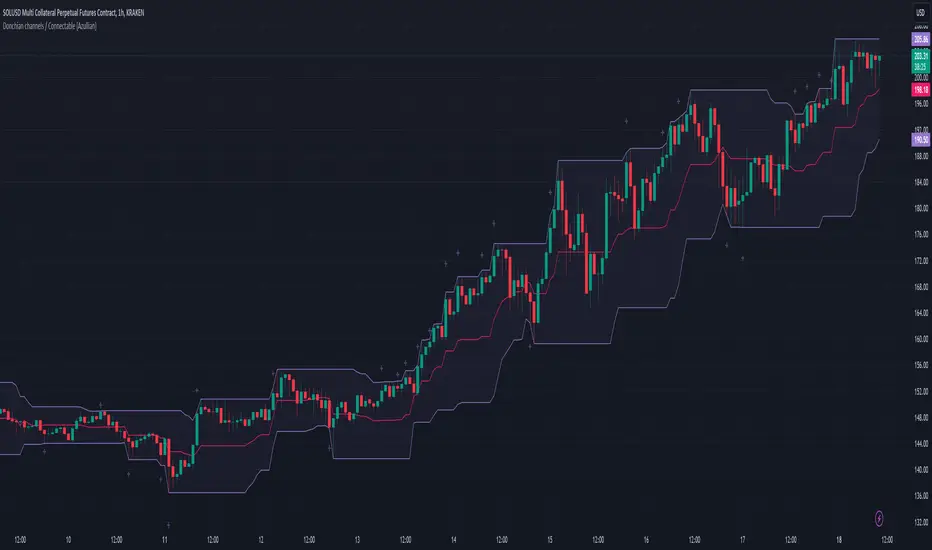
Donchian channels / Connectable [Azullian]Refine your breakout trading techniques with Donchian Channels. Accurately pinpoint significant highs and lows, enhancing your capacity to detect and react to key market movements.
This connectable Donchian channels indicator is part of an indicator system designed to help test, visualize and build strategy configurations without coding. Like all connectable indicators , it interacts through the TradingView input source, which serves as a signal connector to link indicators to each other. All connectable indicators send signal weight to the next node in the system until it reaches either a connectable signal monitor, signal filter and/or strategy.
█ UNIFORM SETTINGS AND A WAY OF WORK
Although connectable indicators may have specific weight scoring conditions, they all aim to follow a standardized general approach to weight scoring settings, as outlined below.
■ Connectable indicators - Settings
• 🗲 Energy: Energy applies an ATR multiplier to the plotted shapes on the chart. A higher value plots shapes farther away from the candle, enhancing visibility.
• ☼ Brightness: Brightness determines the opacity of the shape plotted on the chart, aiding visibility. Indicator weight also influences opacity.
• → Input: Use the input setting to specify a data source for the indicator. Here you can connect the indicator to other indicators.
• ⌥ Flow: Determine where you want to receive signals from:
○ Both: Weights from this indicator and the connected indicator will apply
○ Indicator only: Only weights from this indicator will apply
○ Input only: Only weights from the connected indicator will apply
• ⥅ Weight multiplier: Multiply all weights in the entire indicator by a given factor, useful for quickly testing different indicators in a granular setup.
• ⥇ Threshold: Set a threshold to indicate the minimum amount of weight it should receive to pass it through to the next indicator.
• ⥱ Limiter: Set a hard limit to the maximum amount of weight that can be fed through the indicator.
■ Connectable indicators - Weight scoring settings
▢ Weight scoring conditions
• SM – Signal mode: Enable specific conditions for weight scoring
○ All: All signals will be scored.
○ Entries only: Only entries will score
○ Exits only: Only exits will score.
○ Entries & exits: Both entries and exits will score.
○ Zone: Continuous scoring for each candle within the zone.
• SP – Signal period: Defines a range of candles within which a signal can score.
• SC - Signal count: Specifies the number of bars to retrospectively examine and score.
○ Single: Score for a single occurrence
○ All occurrences: Score for all occurrences
○ Single + Threshold: Score for single occurrences within the signal period (SP)
○ Every + Threshold: Score for all occurrences within the signal period (SP)
▢ Weight scoring direction
• ES: Enter Short weight
• XL: Exit long weight
• EL: Enter Long weight
• XS: Exit Short weight
▢ Weight scoring values
• Weights can hold either positive or negative scores. Positive weights enhance a particular trading direction, while negative weights diminish it.
█ Donchian channels - INDICATOR SETTINGS
■ Main settings
• Enable/Disable Indicator: Toggle the entire indicator on or off.
• S - Source: Choose an alternative data source for the Donchian channels calculation.
• T - Timeframe: Select an alternative timeframe for the Donchian channels calculation.
• LE - Length: Determine the period the Donchian channels are calculated on
• Enable/Disable plotting: Toggle the plotting of the Donchian channels
• U: Choose a color for the upper band
• B: Choose a color for the basis
• L: Choose a color for the lower band
• BG: Choose a color for Donchian channels background
■ Scoring functionality
• The Donchian channels score long entries when the current low price is equal to lower band.
• The Donchian channels score long exits when the current high price is equal to the upper band.
• The Donchian channels score long zones the entire time the current low price is equal to the lower band.
• The Donchian channels score short entries when the current high is equal to the upper band.
• The Donchian channels score short exits when the current low is equal to the lower band.
• The Donchian channels score short zones the entire time the current high price is equal to the upper band.
█ PLOTTING
• Standard: Symbols (EL, XS, ES, XL) appear relative to candles based on set conditions. Their opacity and position vary with weight.
• Conditional Settings: A larger icon appears if global conditions are met. For instance, with a Threshold(⥇) of 12, Signal Period (SP) of 3, and Scoring Condition (SC) set to "EVERY", a Donchian channels signaling over two times in 3 candles (scoring 6 each) triggers a larger icon.
█ USAGE OF CONNECTABLE INDICATORS
■ Connectable chaining mechanism
Connectable indicators can be connected directly to the signal monitor, signal filter or strategy , or they can be daisy chained to each other while the last indicator in the chain connects to the signal monitor, signal filter or strategy. When using a signal filter you can chain the filter to the strategy input to make your chain complete.
• Direct chaining: Connect an indicator directly to the signal monitor, signal filter or strategy through the provided inputs (→).
• Daisy chaining: Connect indicators using the indicator input (→). The first in a daisy chain should have a flow (⌥) set to 'Indicator only'. Subsequent indicators use 'Both' to pass the previous weight. The final indicator connects to the signal monitor, signal filter, or strategy.
■ Set up this indicator with a signal filter and strategy
The indicator provides visual cues based on signal conditions. However, its weight system is best utilized when paired with a connectable signal filter, signal monitor, or strategy .
Let's connect the Donchian channels to a connectable signal filter and a strategy :
1. Load all relevant indicators
• Load Donchian channels / Connectable
• Load Signal filter / Connectable
• Load Strategy / Connectable
2. Signal Filter: Connect the Donchian channels to the Signal Filter
• Open the signal filter settings
• Choose one of the three input dropdowns (1→, 2→, 3→) and choose : Donchian channels / Connectable: Signal Connector
• Toggle the enable box before the connected input to enable the incoming signal
3. Signal Filter: Update the filter signals settings if needed
• The default settings of the filter enable EL (Enter Long), XL (Exit Long), ES (Enter Short) and XS (Exit Short).
4. Signal Filter: Update the weight threshold settings if needed
• All connectable indicators load by default with a score of 6 for each direction (EL, XL, ES, XS)
• By default, weight threshold (TH) is set at 5. This allows each occurrence to score, as the default score in each connectable indicator is 1 point above the threshold. Adjust to your liking.
5. Strategy: Connect the strategy to the signal filter in the strategy settings
• Select a strategy input → and select the Signal filter: Signal connector
6. Strategy: Enable filter compatible directions
• Set the signal mode of the strategy to a compatible direction with the signal filter.
Now that everything is connected, you'll notice green spikes in the signal filter representing long signals, and red spikes indicating short signals. Trades will also appear on the chart, complemented by a performance overview. Your journey is just beginning: delve into different scoring mechanisms, merge diverse connectable indicators, and craft unique chains. Instantly test your results and discover the potential of your configurations. Dive deep and enjoy the process!
█ BENEFITS
• Adaptable Modular Design: Arrange indicators in diverse structures via direct or daisy chaining, allowing tailored configurations to align with your analysis approach.
• Streamlined Backtesting: Simplify the iterative process of testing and adjusting combinations, facilitating a smoother exploration of potential setups.
• Intuitive Interface: Navigate TradingView with added ease. Integrate desired indicators, adjust settings, and establish alerts without delving into complex code.
• Signal Weight Precision: Leverage granular weight allocation among signals, offering a deeper layer of customization in strategy formulation.
• Advanced Signal Filtering: Define entry and exit conditions with more clarity, granting an added layer of strategy precision.
• Clear Visual Feedback: Distinct visual signals and cues enhance the readability of charts, promoting informed decision-making.
• Standardized Defaults: Indicators are equipped with universally recognized preset settings, ensuring consistency in initial setups across different types like momentum or volatility.
• Reliability: Our indicators are meticulously developed to prevent repainting. We strictly adhere to TradingView's coding conventions, ensuring our code is both performant and clean.
█ COMPATIBLE INDICATORS
Each indicator that incorporates our open-source 'azLibConnector' library and adheres to our conventions can be effortlessly integrated and used as detailed above.
For clarity and recognition within the TradingView platform, we append the suffix ' / Connectable' to every compatible indicator.
█ COMMON MISTAKES, CLARIFICATIONS AND TIPS
• Removing an indicator from a chain: Deleting a linked indicator and confirming the "remove study tree" alert will also remove all underlying indicators in the object tree. Before removing one, disconnect the adjacent indicators and move it to the object stack's bottom.
• Point systems: The azLibConnector provides 500 points for each direction (EL: Enter long, XL: Exit long, ES: Enter short, XS: Exit short) Remember this cap when devising a point structure.
• Flow misconfiguration: In daisy chains the first indicator should always have a flow (⌥) setting of 'indicator only' while other indicator should have a flow (⌥) setting of 'both'.
• Hide attributes: As connectable indicators send through quite some information you'll notice all the arguments are taking up some screenwidth and cause some visual clutter. You can disable arguments in Chart Settings / Status line.
• Layout and abbreviations: To maintain a consistent structure, we use abbreviations for each input. While this may initially seem complex, you'll quickly become familiar with them. Each abbreviation is also explained in the inline tooltips.
• Inputs: Connecting a connectable indicator directly to the strategy delivers the raw signal without a weight threshold, meaning every signal will trigger a trade.
█ A NOTE OF GRATITUDE
Through years of exploring TradingView and Pine Script, we've drawn immense inspiration from the community's knowledge and innovation. Thank you for being a constant source of motivation and insight.
█ RISK DISCLAIMER
Azullian's content, tools, scripts, articles, and educational offerings are presented purely for educational and informational uses. Please be aware that past performance should not be considered a predictor of future results.
Donchian Channel - trend filterTrend filter created based on donchian channel. I am using my custom donchian channel as base for this indicator:
Concept is simple.
We count how many times price is hitting donchian channel top or bottom without hitting the other side and keep counter for both. Thus:
upCount is the number of times price hits donchian channel top without hitting bottom
downCount is the number of times price hits donchian channel bottom without hittin top
trendCountLimit is the minimum value of upCount or downCount to call it uptrend or downtrend.

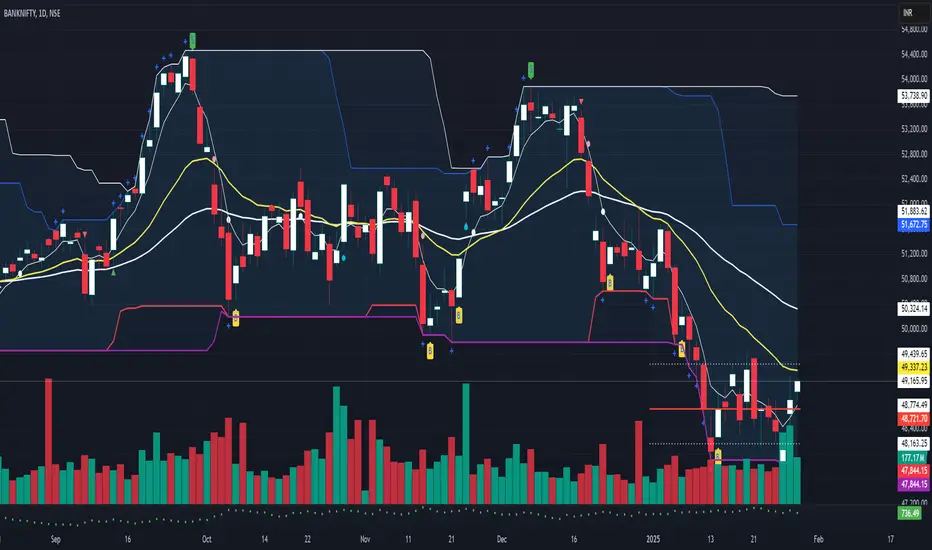
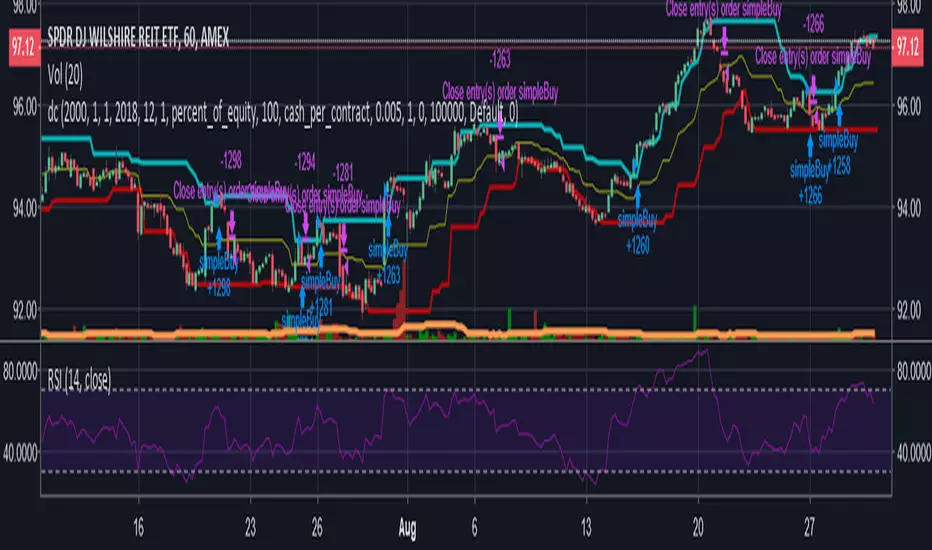
Donchian BlasterRelease Note:
Keeping in mind of getting full potential of Donchian Channels, As part of this script, Linear Regression is used as primary source to identify trend and execute the trades.
Hull Moving Average given as alternative option in place of Linear regression.
Linear Regression:
Linear regression used to identify trend, trade setup, and stop. Based on this, Color fillings on Donchian channels is updated. That will give clear idea of strength or weakness in any trading instruments.
HMA:
HMA used as alternative to identify trend, trade setup, and stop. Based on this, Color fillings on Donchian channels is updated. That will give clear idea of strength or weakness in any trading instruments.
Donchian Channels:
As it is one of the oldest trend riding system, combined here with differentiation in color will help to go with the trend.
Inputs:
Input periods can be changed by users/traders as per their understanding and observations.
//Disclaimer: Idea of publishing this script is to identify the strength of the instrument using multiple confirmation.
//Disclaimer: Using this indicator, changing inputs, and trading decisions are up to the users/traders.
//Courtesy: Thanks to Richard Donchian, Alan Hull, and author of LSMA as this indicator/script inspired by Donchian Channels, Hull Moving Average, and LSMA
Donchian Channel - Pivot High-LowCombining Pivot High Low and Donchian Channel - both of which are useful indicators for trend following.
Donchian Channel shows highest and lowest prices for X number of bars.
Pivot High-Low identifies when price made new Highs and Lows
Applying Donchian Channel on Pivot High-Low channel, we are plotting highest and lowest pivots formed in X bars.
In this indicator, we have 3 options for Channel Base :
Price : This is regular Donchian channel based on High-Low Price
Pivots : This is Donchian channel based on pivot points.
Combined : Combines both. Takes highest of Price and Pivots for plotting high, lowest of Price and Pivots for plotting low

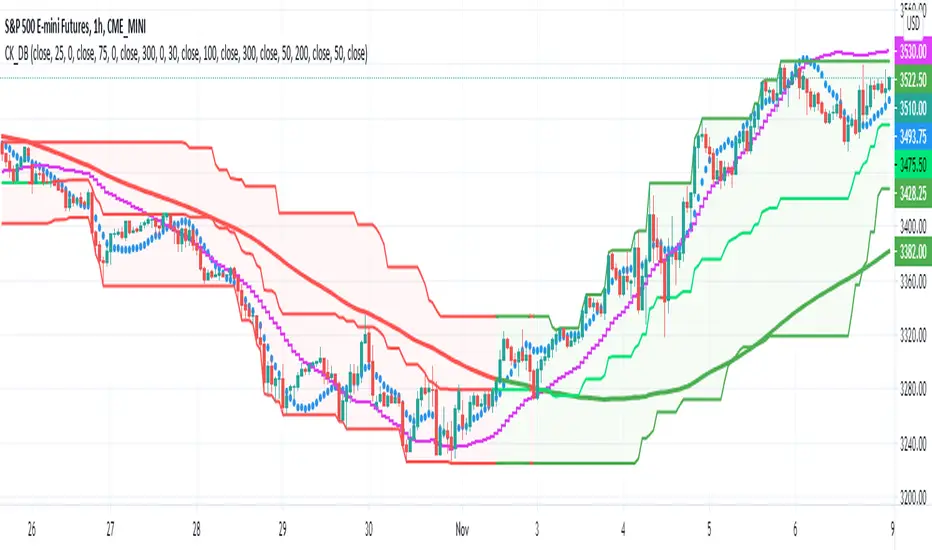
Donchian Trend RibbonHello Traders,
I think you all know Donchian Channels. so I am not going to write about it.
With this indicator I tried to create Donchian Trend Ribbon by using Donchian Channels.
How it works ?
- it calculates main trend direction by using the length that is user-defined. so you can change it as you wish
- then it calculates trend direction for each 9 lower lengths. if you set the length = 20 then the lengths are 19, 18,...11
- and it checks if the trend directions that came from lower lengths is same or not with main trend direction.
- it changes the trend color of the ribbon.
-
Warning: Entry points may also represents trend reversal. So you should use stoploss line if you decide to take buy/sell positions.
P.S. I didn't backtest it, it's non-repainting, it should be used educational purposes only.
Published by user request. You may want to see following one:
Enjoy!

Donchian Channel - CustomThis is an extension to Donchian Channel - Pivot High Low indicator. Creating new version as the new type added isn't related to pivot high/low.
New type added is based on moving average. Instead of using highest and lowest of n bars, here, we are using lowest and highest of moving average of highs and lows for n bars.
Previous version of Donchian channel pivot points can be found here:
