Search in scripts for "elliott"

Elliott Wave - OscillatorWaves3: Indicated in RED Line(Upwards) and Green Line(Downwards)
- Detects wave greater than SMA
Waves4: Maximum height indicated in yellow Line
- Detects when wave greater than SMA (Wave 3 or 5) approaches wave 4 regression point
Waves5: Indicated in White Line
- Detects divergence in oscilator and price, meaning end of trend
Appreciate any suggestions, collaboration, comments or ideas.
Detects Waves 3 , 4 and 5
Alerts for Waves 3, 4 and 5(red, green and white)

EWO Breaking Bands & XTLElliott Wave Principle, developed by Ralph Nelson Elliott , proposes that the seemingly chaotic behaviour of the different financial markets isn’t actually chaotic. In fact the markets moves in predictable, repetitive cycles or waves and can be measured and forecast using Fibonacci numbers. These waves are a result of influence on investors from outside sources primarily the current psychology of the masses at that given time. Elliott wave predicts that the prices of the a traded currency pair will evolve in waves: five impulsive waves and three corrective waves. Impulsive waves give the main direction of the market expansion and the corrective waves are in the opposite direction (corrective wave occurrences and combination corrective wave occurrences are much higher comparing to impulsive waves)
The Elliott Wave Oscillator ( EWO ) helps identifying where you are in the 5 / 3 Elliott Waves , mainly the highest/lowest values of the oscillator might indicate a potential bullish / bearish Wave 3. Mathematically expressed, EWO is the difference between a 5 period and 35 period moving average. In this study instead 35-period, Fibonacci number 34 is implemented for the slow moving average and formula becomes ewo = sma (HL2, 5) - sma (HL2, 34)
The Elliott Wave Oscillator enables traders to track Elliott Wave counts and divergences. It allows traders to observe when an existing wave ends and when a new one begins. Included with the EWO are the breakout bands that help identify strong impulses.
The Expert Trend Locator ( XTL ) was developed by Tom Joseph (in his book Applying Technical Analysis) to identify major trends, similar to Elliott Wave 3 type swings.
Blue bars are bullish and indicate a potential upwards impulse.
Red bars are bearish and indicate a potential downwards impulse.
White bars indicate no trend is detected at the moment.
Added "TSI Arrows". The arrows is intended to help the viewer identify potential turning points. The presence of arrows indicates that the TSI indicator is either "curling" up under the signal line, or "curling" down over the signal line. This can help to anticipate reversals, or moves in favor of trend direction.

zSph x Larry Waves Wave Zone ForecastElliott Waves and Fibonacci Ratio Lengths have a strong correlated relationship when observing the general strength and termination of both Impulse (Motive) Waves and Corrective Waves.
There are certain Fibonacci levels that are highly reactive when applying it from a Wave Analysis perspective and being aware of the current wave sequence is required.
Often, those beginning their Elliott Wave journey and studies are unsure what Fibonacci levels are relevant and how to apply it to the wave structure that is being observed – this tool removes that ambiguity on placement.
Being aware of the predisposed levels that have a high rate of reaction can assist in managing trades from a scalp intra-day approach, a day trading approach, and a swing trading approach.
# Concept
This tool helps with identifying zones that are relevant to the wave that is currently in progression upon the market and visualize important Fibonacci levels where reactions often occur from an Elliott Wave perspective such as:
Wave 2
Wave 3
Wave 4
Wave 5
Wave B Zigzag
Wave B Flat
Wave X Zigzag
Wave X Flat
Wave C
Wave Y
This helps remove almost all the manual labor of updating fib levels, selecting certain fib levels, and manually moving the fib levels as price continues to print while autonomously providing the levels visually.
# Correct Usage
Wave 3 / Wave C / Wave Y
Once a clear impulse/motive structure has been identified for a Wave 1, Wave A or Wave W, apply the indicator to the structure.
Anchor 1 is the beginning of the impulse for Wave 1 or A or W.
Anchor 2 is the end of the impulse for Wave 1 or A or W.
The result is the standard zones for Wave 3, Wave C and Wave Y.
BINANCE:LINKUSD
Wave 4
Once a clear impulse/motive structure has been identified for Wave 3, apply the indicator to the structure.
Anchor 1 is the beginning of Wave 3 (or the end of Wave 2)
Anchor 2 is the end of Wave 3 (or the beginning of Wave 4)
The result is the standard zone for Wave 4.
LINKUSD
Wave B / Wave X / Wave C / Wave Y
Once a clear 3-wave corrective has been identified for a potential Corrective pattern, apply the indicator to the structure.
- Anchor 1 is the end of beginning of Wave A or Wave W
- Anchor 2 is the end of Wave A or Wave W
The result is the standard zones Waves B / X and Waves C / Y for Zigzags, Flats and Combos.
BINANCE:LINKUSD
# Settings
"Show Labels" will toggle on and off the labels for each fib zone, each fib line, and invalidation ticks that are in the 2/3 – B/C option to help with calculating risk management quickly.
"Use Log Scale" will allow you to toggle on/off the log scale for log fibs
"Extend Lines" will allow you to extend the fib lines to current price action from the Elliott Wave Zones to see reactions off the fib levels.
“Extend Zones” will allow you to extend the overall zone for the fibs to current price action from the Elliott Wave Zones to see reactions off the zone. There is also user customization of color use for the zones/.
“Fib Levels” will allow you to customize the lines and colors of the fibs lines.
“X-Axis Offset” will increase or decrease the position of the fibs of the zones (not the extension boxes)..

zSph x Larry Waves Wave Degree TimingElliott Waves are fractal structures governed by time. The categorization of time in relation to Elliott Wave is named ‘Wave Degree’.
All waves are characterized by relative size called degree. The degree of a wave is determined by its size and position relative to lesser waves (smaller time and size), corresponding waves (similar time and size) and encompassing waves (greater time and size).
Elliott named 9 degrees (Supercycle – Subminuette).
Elliott also stated the Subminuette degree is discernable on the HOURLY chart.
# Concept
BINANCE:BTCUSDT
Degree is governed by Time yet it is not based upon time lengths (or price lengths), rather it is based on form and structure – a function of both price and time.
The precise degree may not be identified in real time, yet the objective is to be within +/- 1 standard deviation of the expected degree to be aware of the overall market progression.
Understanding degree helps in the identification of when an impulse or a correction is nearing completion and to be aware of the major pivot in price action to occur as a result of the completion of a major expansion or major retracement and be aware of when major pivots in price relating to major expansions and major retracements by managing expectations from a time perspective.
*Important to understand* : If price is currently in a Wave Degree Extension or a Very Complex Correction, the wave degree timings will be distorted (extended in time).
Example: A Cycle typically lasts a few years - yet can last a decade(s) in an Extension.
It’s best to keep the analysis on the Minute/Minuette timeframe to manage timing expectations yet always refer back to the Higher Time Frame Structure.***
# Correct Usage
BEFORE PLACING THE ANCHOR TO DISPLAY ZONES:
Completion of prior wave structure should be completed and there needs to be confirmation the next wave structure is in progression, such as a change in market structure.
Anchor :
Best to anchor on the higher time frame to ensure you always have the anchor point defined when you scale down/move down in the timeframes.
Ensure the anchor point is placed at the termination of a structure/beginning of a new structure (Generally they will be price extremes – extreme highs and lows)
Zones :
Minimum Zones : The minimum amount of time of completion for a single wave structure to complete for a degree.
Average Zones : The average amount of time of completion for a single wave structure to complete for a degree.
Maximum Zones : The general maximum amount of time of completion for a single wave structure to complete for a degree.
Wave Degree Timeframe Analysis :
Higher-Level Degrees (Primary, Intermediate, Minor) - Utilize on H4+ timeframe
Lower-Level Degrees (Minute, Minuette, Subminuette) – Utilize on 15M to H4 timeframe
Micro-Level Degrees (Micro and Submicro) – Utilize on timeframes less than 15M
(There is a chart in the settings you can toggle on/off that reiterates this as well.)
# Settings
Y-Axis Offset :
It is a scale relative to the asset being viewed. Example:
- If using on Bitcoin, Bitcoin moves on average $1,000 of dollars up or down (on the Y-Axis), therefore it would be relevant to use values with 4 nominal values to offset it correctly to view easier on the chart as needed.
- If using on SP500, SP500 moves on average $50-100 of dollars up or down (on the Y-Axis), therefore it would be relevant to use values with 2 or 3 nominal values to offset it correctly to view easier on the chart as needed.
Extend :
This option allows to extend lines for the borders of the zones towards price action.
ElliotElliott Wave Oscilator, indicating possible waves 3, 4 and 5
Waves3: Indicated in RED Line(Upwards) and Green Line(Downwards)
- Detects wave greater than SMA
Waves4: Maximum height indicated in yellow Line
- Detects when wave greater than SMA (Wave 3 or 5) approaches wave 4 regression point
Waves5: Indicated in White Line
- Detects divergence in oscilator and price, meaning end of trend
////Working on Elliott wave projections with PRICE
Appreciate any suggestions, collaboration, comments or ideas.

Elliott Wave 3 FinderThis script will attempt to find the location of the third wave in the Elliot Wave Theory. The bars will become highlighted when possible wave 3 criteria is met. Multiple bars in a row may have a painted background. The point at which the bars are no longer painted will potentially be at or near the end of wave 3.
The background paints a baby blue for wave 3s in an overall uptrend, and pink for downtrends.


BullTrading Chaos Trend WaveHave you ever wonder how the Elliott Wave looks like?
If you trade with price action you are going to love this stuff... It is based on the same Mandelbrot Chaos Theory principles in order to trade with Bill Williams fractals. Chaos Trend Wave indicator displays in your chart the different Elliott wave layers making price action trading very intuitive.
The standard settings are 126, 1, 5, 21 displaying the immediate bigger wave from your current layer, display settings for your current layer and "balance point" are: 126, 1, 3, 13. Use Fib sequence in the last two numbers in order to correctly change between wave layers: 126, 1, 8, 34 and 126, 1, 13, 55 (This is the higher setting, it is very useful to spot and trade trending markets).

Elliott Wave Principle Pro - Frost & Prechter [abusuhil]الوصف العربي اسفل الوصف الإنجليزي .
✅ Professional Description (English)
Elliott Wave Principle Pro – Frost & Prechter Edition
A complete, professional-grade Elliott Wave detection and trading system designed for traders who want to identify market structure with precision and execute trades based on confirmed wave completion signals — without repainting.
This indicator combines the classical Elliott Wave rules from Frost & Prechter’s “Elliott Wave Principle” with modern algorithmic detection, Fibonacci validation, ZigZag pivot systems, and fully automated entry/exit levels.
⭐ Core Features
1. Automatic Elliott Wave Detection
Detects Impulse Waves (5-3-5-3-5)
Detects Corrective Waves (ABC) including:
• Zigzag
• Flat
• Expanded Flat
Supports multiple wave degrees (Cycle → Minuette)
2. Strict Elliott Rule Engine
All major EW rules are applied:
Wave 2 never retraces beyond Wave 1
Wave 4 must not overlap Wave 1
Wave 3 is never the shortest
Wave relationships validated using Fibonacci ratios
You can choose Strict / Standard / Flexible rule modes.
⭐ 3. Non-Repainting Confirmation System
Waves are confirmed only after pivot completion
Signals never change once displayed
Historical signals remain stable
Fully resistant to repainting
⭐ 4. Automated Trading Signals
Every completed structure triggers:
BUY Signals
End of Wave C
End of bearish Impulse (Wave 5)
SELL Signals
End of Wave 5 in bullish impulse
End of bullish ABC correction
Each signal includes:
Entry Line
Stop Loss (3 methods: Wave / ATR / Fixed)
TP1 – TP2 – TP3 (Fibonacci-based or Wave Projected)
Optional PRZ (Potential Reversal Zone)
You may show only the latest signal for clarity.
⭐ 5. Advanced Visual Tools
Wave numbers (1–5 / A–B–C)
Wave lines
Channels
Projection levels
Degree colors
Customizable labels and signal shapes (Box / Arrow / No Text)
A clean Simple Mode is available to hide all waves and show signals only.
⭐ 6. Informational Table (Optional)
Displays:
Last detected structure
Direction (Bullish / Bearish)
Active signal status (Buy / Sell / Wait)
⭐ How Traders Benefit
This tool helps traders:
Understand the full Elliott Wave context instantly
Know exactly when a wave cycle has completed
Enter trades with predefined, optimized levels
Avoid emotional decisions and subjective wave counting
Rely on a non-repainting analytical engine
Identify high-probability reversal zones
Improve trade timing and risk management
Perfect for swing trading, intraday trading, and wave practitioners.
🇸🇦 الوصف الاحترافي (العربية)
Elliott Wave Principle Pro – نسخة فروسـت وبريشتـر
مؤشر احترافي متكامل لتحليل موجات إليوت واكتشاف البُنى السعريّة بشكل آلي ودقيق، مع إعطاء إشارات تداول مؤكدة عند اكتمال الموجات — بدون إعادة رسم (Non-Repainting).
يجمع هذا المؤشر بين قواعد مدرسة إليوت الكلاسيكية من كتاب “Elliott Wave Principle” وبين خوارزميات حديثة تعتمد على الـ ZigZag، والفيبوناتشي، والتحقق الرياضي من صحة الموجة.
⭐ أهم المزايا
1. اكتشاف آلي كامل لموجات إليوت
اكتشاف الموجات الدافعة Impulse 5-3-5-3-5
اكتشاف الموجات التصحيحية ABC بما يشمل:
• Zigzag
• Flat
• Expanded Flat
دعم جميع درجات الموجة من Cycle حتى Minuette
⭐ 2. محرك قواعد إليوت الاحترافي
يطبق المؤشر جميع القواعد الأساسية لموجات إليوت، مثل:
الموجة 2 لا تتجاوز بداية الموجة 1
الموجة 4 يجب ألا تتداخل مع الموجة 1
الموجة 3 ليست الأقصر
تأكيد العلاقات باستخدام نسب فيبوناتشي
مع إمكانية اختيار نمط القواعد: صارم / قياسي / مرن.
⭐ 3. نظام تأكيد بدون إعادة رسم
لا يتم تأكيد الموجة إلا بعد اكتمالها فعليًا
لا يتم حذف أي إشارة بعد ظهورها
جميع النتائج ثابتة وغير قابلة للتغيير
مقاوم لإعادة الرسم 100%
⭐ 4. إشارات تداول تلقائية
يصدر المؤشر إشارات شراء وبيع عند اكتمال التركيبات التالية:
إشارات BUY
نهاية موجة C
نهاية موجة 5 الهابطة (انعكاس صاعد)
إشارات SELL
نهاية موجة 5 الصاعدة
نهاية تصحيح ABC الصاعد
وتتضمن الإشارة:
مستوى الدخول
وقف الخسارة (Wave / ATR / نسبة ثابتة)
الأهداف TP1 – TP2 – TP3
منطقة انعكاس محتملة PRZ (اختيارية)
ويمكن عرض آخر إشارة فقط لسهولة القراءة.
⭐ 5. أدوات بصرية متقدمة
ترقيم الموجات 1–5 و A–B–C
خطوط الموجات
قنوات Elliott
مستويات الإسقاط
ألوان الدرجات
تخصيص شكل الإشارة (مربع / سهم / بدون نص)
كما يمكن تفعيل الوضع البسيط لإظهار الإشارات فقط.
⭐ 6. جدول معلومات الاختياري
يعرض:
نوع آخر موجة مكتشفة
اتجاهها (صاعد / هابط)
حالة الإشارة الحالية (شراء / بيع / انتظار)
⭐ فوائد استخدام المؤشر للمتداول
هذا المؤشر يساعدك على:
فهم بنية موجات إليوت دون قراءة الشارت يدويًا
اكتشاف نقاط الانعكاس القوية قبل حدوثها
الدخول في صفقات محسوبة مسبقًا (Entry + SL + TP)
تقليل التشتت والتقدير الشخصي في العدّ
تحسين إدارة المخاطر
تعزيز دقة التوقيت في بداية الاتجاهات الجديدة
دراسة السوق بطريقة احترافية تعتمد على قاعدة علمية واضحة
مثالي للمضارب اليومي، المتداول المتأرجح، ولممارسي مدرسة إليوت.

Elliott Wave (𝐒𝐓𝐄𝐄𝐋 𝐂𝐈𝐓𝐘 𝐂𝐑𝐄𝐀𝐓𝐎𝐑𝐒)This indicator provides a rules-based helper for visually identifying potential Elliott Wave patterns — including 1–5 impulse structures and optional A–B–C corrective moves. It automatically detects pivot highs/lows using the user-defined left/right swing settings and connects them with a ZigZag line filtered by either ATR or percentage change to reduce market noise.
When a valid 5-wave impulse structure is found (either bullish or bearish), the indicator labels waves 1–5 on the chart. After completion of the fifth wave, it optionally monitors for an A–B–C corrective pattern and labels those points when detected. Alerts are generated when an impulse or correction is confirmed.
Features
✅ Automatic pivot detection using configurable left/right swing bars.
✅ ATR or %-based swing filter to avoid small fluctuations.
✅ ZigZag plotting to visualize price structure.
✅ Automatic labeling of potential Elliott impulse waves (1–5).
✅ Optional A–B–C correction detection after wave 5.
✅ Alerts when impulses and corrections complete.
✅ Customizable visuals (colors, sensitivity, pivot length).
✅ Works on all symbols and timeframes.
Usage Tips
For best results, use larger timeframes (e.g., 1H–1D) where Elliott structures are cleaner.
Adjust Pivot Left/Right and ATR Multiplier for your chart’s volatility.
Remember: Elliott Wave theory is interpretive — this tool provides objective swing logic to assist manual analysis, not a guaranteed automatic wave count.

Elliott Wave Universal PRO ImpulseElliott Wave Universal PRO Impulse
Elliott Wave Universal PRO Impulse is a powerful and versatile Pine Script indicator designed for traders who utilize Elliott Wave theory to analyze market trends and forecast price movements. This indicator automates the plotting of various impulse wave patterns, enabling users to visualize and analyze market structures with precision and ease.
Key Features
Multiple Impulse Patterns: Choose from a wide range of impulse wave patterns, including Classic Impulse, Leading and Ending Diagonals, Extended Waves, Truncated Waves, and more, catering to diverse market scenarios.
Customizable Ratios: Supports Standard, Minimal, and Maximal Fibonacci-based ratios for wave projections, allowing traders to adapt to different market conditions.
Interactive Inputs: Define key points (0 and A) by selecting time and price directly on the chart, ensuring accurate wave construction tailored to your analysis.
Visual Customization: Adjust line styles (Solid/Dotted) and colors for Standard, Minimal, and Maximal patterns to enhance chart clarity and align with your trading preferences.
Overlay Display: Plots wave patterns directly on the price chart with labeled points and color-coded lines, making it easy to interpret wave structures.
How It Works
Select an impulse pattern from the dropdown menu (e.g., "Classic Impulse (5-3-5)", "Extended 3rd Wave Impulse").
Set the starting point (0) and wave 1 endpoint (A) using time and price inputs.
The indicator calculates and plots the subsequent waves (2, 3, 4, and 5) based on Fibonacci ratios and the selected pattern.
Toggle Standard, Minimal, and Maximal projections to visualize potential wave targets with distinct styles and colors.
Use Cases
Trend Analysis: Identify and confirm impulse wave structures to anticipate market trends and reversals.
Trade Planning: Use projected wave targets to set entry, exit, and stop-loss levels.
Risk Management: Assess wave validity and potential failure points (e.g., Truncated or Failed Waves) to refine trading strategies.
Settings
Impulse Pattern: Select from over 30 predefined Elliott Wave patterns.
Build Points: Input time and price for points 0 and A to anchor the wave structure.
Display Options: Enable/disable Standard, Minimal, and Maximal projections.
Style Options: Customize line styles (Solid/Dotted) and colors for each projection type.
Notes
Ensure proper placement of points 0 and A to align with significant market highs/lows for accurate projections.
Best used in conjunction with other technical tools to confirm wave patterns and market signals.
Optimized for all timeframes and asset classes, including stocks, forex, crypto, and commodities.
Elevate your Elliott Wave analysis with Elliott Wave Universal PRO Impulse and gain a deeper understanding of market dynamics!
Complete catalog of Elliott impulse patterns:
Classic Impulse (5-3-5) - Sequential - Классический импульс с последовательной структурой.
Classic Impulse (5-3-5) - Template - Классический импульс с шаблонными пропорциями.
Extended 1st Wave Impulse - Импульс с удлиненной первой волной.
Extended 3rd Wave Impulse - Импульс с удлиненной третьей волной.
Extended 5th Wave Impulse - Импульс с удлиненной пятой волной.
Symmetrical Impulse - Симметричный импульс.
Leading Diagonal (5-3-5-3-5) - Ведущая диагональ с подволнами 5-3-5-3-5.
Leading Diagonal (3-3-3-3-3) - Ведущая диагональ с подволнами 3-3-3-3-3.
Ending Diagonal (3-3-3-3-3) - Завершающая диагональ с подволнами 3-3-3-3-3.
Expanding Diagonal (3-3-3-3-3) - Расширяющаяся диагональ.
Expanding Impulse - Расширяющийся импульс.
Truncated Impulse - Усеченный импульс.
Failed 5th Wave Impulse - Импульс с неудачной пятой волной.
Extended 1st and 3rd Waves Impulse - Импульс с удлиненными первой и третьей волнами.
Running Correction Wave 2 Impulse - Импульс с бегущей коррекцией во второй волне.
Running Correction Wave 4 Impulse - Импульс с бегущей коррекцией в четвертой волне.
Extended 1st and 5th Waves Impulse - Импульс с удлиненными первой и пятой волнами.
Extended 2nd Wave Impulse - Импульс с удлиненной второй волной.
Double Truncated 5th Wave Impulse - Импульс с дважды усеченной пятой волной.
Converging Diagonal - Сходящаяся диагональ.
Running Flat Wave 2 Impulse - Импульс с плоской бегущей коррекцией во второй волне.
Running Flat Wave 4 Impulse - Импульс с плоской бегущей коррекцией в четвертой волне.
Double Extended 1st and 3rd Waves Impulse - Импульс с двойным удлинением первой и третьей волн.
Double Extended 3rd and 5th Waves Impulse - Импульс с двойным удлинением третьей и пятой волн.
Leading Diagonal with Failed 5th Wave - Ведущая диагональ с неудачной пятой волной.
Complex Correction Wave 2 (Double Zigzag) Impulse - Импульс с комплексной коррекцией во второй волне (двойной зигзаг).
Complex Correction Wave 4 (Triangle) Impulse - Импульс с комплексной коррекцией в четвертой волне (треугольник).
Terminal Impulse - Терминальный импульс.
Extended 4th Wave Impulse - Импульс с удлиненной четвертой волной.
Diagonal with Overlap - Диагональ с перекрытием.
Nested Extension Wave 3 Impulse - Импульс с вложенным удлинением третьей волны.
Failed Wave 1 Impulse - Импульс с неудачной первой волной.
Double Running Correction Impulse - Импульс с двойной бегущей коррекцией.
Converging Impulse - Сходящийся импульс.
Expanding Leading Diagonal - Расширяющаяся ведущая диагональ.
Truncated Ending Diagonal - Усеченная завершающая диагональ.
Irregular Wave 2 Impulse - Импульс с нерегулярной второй волной.
Sharp Wave 4 Impulse - Импульс с резкой четвертой волной.
Diagonal Impulse Variant - Вариант диагонального импульса.
Extended Symmetrical Impulse - Удлиненный симметричный импульс.

Elliott Wave - Impulse + Corrective Detector (Demo) เทคนิคการใช้
สำหรับมือใหม่
ดูเฉพาะ Impulse Wave ก่อน
เทรดตาม direction ของ impulse
ใช้ Fibonacci เป็น support/resistance
สำหรับ Advanced
ใช้ Corrective Wave หาจุด reversal
รวม Triangle กับ breakout strategy
ใช้ Complex correction วางแผนระยะยาว
⚙️ การปรับแต่ง
ถ้าเจอ Pattern น้อยเกินไป
ลด Swing Length เป็น 3-4
เพิ่ม Max History เป็น 500
ถ้าเจอ Pattern เยอะเกินไป
เพิ่ม Swing Length เป็น 8-12
ปิด patterns ที่ไม่ต้องการ
สำหรับ Timeframe ต่างๆ
H1-H4: Swing Length = 5-8
Daily: Swing Length = 3-5
Weekly: Swing Length = 2-3
⚠️ ข้อควรระวัง
Elliott Wave เป็น subjective analysis
ใช้ร่วมกับ indicators อื่นๆ
Backtest ก่อนใช้เงินจริง
Pattern อาจเปลี่ยนได้ตลอดเวลา
🎓 สรุป
โค้ดนี้เป็นเครื่องมือช่วยวิเคราะห์ Elliott Wave ที่:
✅ ใช้งานง่าย
✅ ตรวจจับอัตโนมัติ
✅ มี confidence scoring
✅ แสดงผล Fibonacci levels
✅ ส่ง alerts เรียลไทม์
เหมาะสำหรับ: Trader ที่ต้องการใช้ Elliott Wave ในการวิเคราะห์เทคนิค แต่ไม่มีเวลานั่งหา pattern เอง
💡 Usage Tips
For Beginners
Focus on Impulse Waves first
Trade in the direction of impulse
Use Fibonacci as support/resistance levels
For Advanced Users
Use Corrective Waves to find reversal points
Combine Triangles with breakout strategies
Use Complex corrections for long-term planning
⚙️ Customization
If You See Too Few Patterns
Decrease Swing Length to 3-4
Increase Max History to 500
If You See Too Many Patterns
Increase Swing Length to 8-12
Turn off unwanted pattern types
For Different Timeframes
H1-H4: Swing Length = 5-8
Daily: Swing Length = 3-5
Weekly: Swing Length = 2-3
⚠️ Important Warnings
Elliott Wave is subjective analysis
Use with other technical indicators
Backtest before using real money
Patterns can change at any time
🔧 Troubleshooting
No Patterns Showing
Check if you have enough price history
Adjust Swing Length settings
Make sure pattern detection is enabled
Too Many False Signals
Increase confidence threshold requirements
Use higher timeframes
Combine with trend analysis
Performance Issues
Reduce Max History setting
Turn off unnecessary visual elements
Use on liquid markets only
📈 Trading Applications
Entry Strategies
Wave 3 Entry: After Wave 2 completion (61.8%-78.6% retracement)
Wave 5 Target: Equal to Wave 1 or Fibonacci extensions
Corrective Bounce: Trade reversals at C wave completion
Risk Management
Stop Loss: Beyond pattern invalidation levels
Take Profit: Fibonacci extension targets
Position Sizing: Based on pattern confidence
🎓 Summary
This code is an Elliott Wave analysis tool that offers:
✅ Easy to use interface
✅ Automatic pattern detection
✅ Confidence scoring system
✅ Fibonacci level display
✅ Real-time alerts
Perfect for: Traders who want to use Elliott Wave analysis but don't have time to manually identify patterns.
📚 Quick Reference
Pattern Hierarchy (Most to Least Reliable)
Impulse Waves (90% confidence)
Expanded Flats (85% confidence)
Zigzags (80% confidence)
Triangles (75% confidence)
Complex Corrections (70% confidence)
Best Practices
Start with higher timeframes for main trend
Use lower timeframes for precise entries
Always confirm with volume and momentum
Don't trade against strong fundamental news
Keep a trading journal to track performance
Remember: Elliott Wave is an art as much as a science. This tool helps identify potential patterns, but always use your judgment and additional analysis before making trading decisions.

Elliott Wave Noise FilterElliott Wave Noise Filter
Overview
The Elliott Wave Noise Filter is a specialized indicator for TradingView, designed to solve one of the biggest challenges in Elliott Wave analysis on lower timeframes: the identification of market noise. By combining multiple advanced filtering techniques, this indicator helps distinguish meaningful price action from random fluctuations.
The Problem
On lower timeframes—especially below 15 minutes—Elliott Wave analysis is significantly impacted by excessive market noise. This noise can lead to misinterpretation of wave structures, making it difficult to execute reliable trading decisions.
The Solution
The Elliott Wave Noise Filter utilizes four powerful methods to detect and filter noise:
ATR-Based Volatility Analysis: Identifies price movements too small to be structurally meaningful
Volume Confirmation: Filters out price moves that occur with insufficient volume
Trend Strength Measurement (ADX): Detects periods of weak trend activity, where noise tends to dominate
Fractal Pattern Recognition: Marks significant turning points that could be relevant for Elliott Wave analysis
Features
Visual Indicators
Background Coloring: Red indicates noise; green signifies a clear signal
Hull Moving Average: Smooths price action and highlights the prevailing trend
Fractal Markers: Triangles mark significant highs and lows
Status Panel: Displays current noise status and ADX value
Customization Options
ATR Period: Adjust the lookback period for ATR calculations
Noise Threshold: Defines the percentage of ATR below which a movement is considered noise
Volume Filter: Can be enabled or disabled
Volume Threshold: Sets the ratio to average volume for a move to be deemed significant
Hull MA Display and Length: Configure the moving average settings
ADX Parameters: Adjust trend strength sensitivity
Use Cases
For Elliott Wave Analysis
Eliminate noise to identify cleaner wave structures
Use fractal markers as potential wave endpoints
Reference the Hull MA for determining the broader trend
For General Trading
Identify high-noise periods to avoid low-quality setups
Spot clearer market phases for better entries
Assess price action quality through visual cues
Multi-Timeframe Approach
Apply the indicator across different timeframes for a comprehensive view
Prefer trading when both higher and lower timeframes align with consistent signals
Optimal Settings
For Very Short Timeframes (1–5 minutes)
Higher Noise Threshold (0.4–0.5)
Longer ATR Period (20–30)
Higher Volume Threshold (1.0–1.2)
For Medium Timeframes (15–60 minutes)
Medium Noise Threshold (0.2–0.3)
Standard ATR Period (14)
Standard Volume Threshold (0.8)
For Higher Timeframes (4h and above)
Lower Noise Threshold (0.1–0.2)
Shorter ATR Period (10)
Lower Volume Threshold (0.6–0.7)
Conclusion
The Elliott Wave Noise Filter is an essential tool for any Elliott Wave analyst or trader working on lower timeframes. By reducing noise and emphasizing significant market movements, it enables more precise analysis and potentially more profitable trading decisions.
Note: As with any technical indicator, the Elliott Wave Noise Filter should be used as part of a broader trading strategy and not as a standalone signal for trade execution.

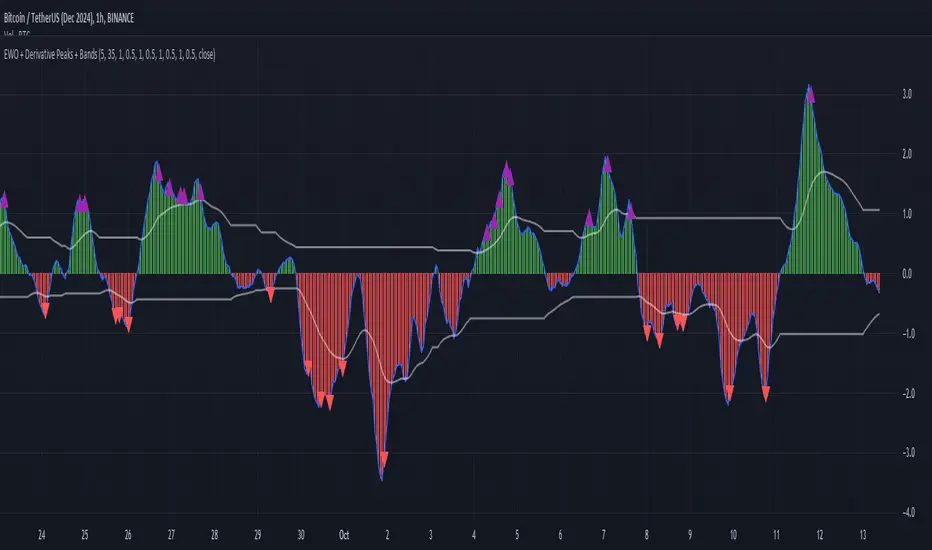
Elliott Wave Oscillator with Peak DetectionThe Elliott Wave Oscillator with Derivative Peak Detection and Breakout Bands is a technical indicator that blends traditional Elliott Wave theory with modern derivative-based peak detection and breakout bands for a clearer view of market trends.
Key Components:
Elliott Wave Oscillator (EWO):
The core of the indicator is based on the difference between two simple moving averages (SMA): a short-term SMA (default length: 5) and a long-term SMA (default length: 35).
This difference is expressed either as an absolute value or a percentage of the current price, depending on the user’s input.
Smoothing:
The EWO is smoothed using an Exponential Moving Average (EMA) to filter out noise and provide a clearer trend direction.
The smoothing length is adaptive based on the current chart's timeframe (e.g., longer smoothing for daily charts).
Derivative Peak Detection:
The smoothed EWO is analyzed for peaks (positive) and troughs (negative) by calculating the derivative (rate of change) between consecutive values.
Peaks are detected when the derivative transitions from positive to negative, while troughs are identified when the derivative switches from negative to positive.
Tolerance levels are adjustable and vary by timeframe to avoid false signals.
Breakout Bands:
Upper and lower breakout bands are dynamically generated based on the smoothed EWO.
The bands help to filter significant peaks and troughs, only highlighting those that occur beyond the breakout levels.
Users can choose to display these bands and use them to filter out less significant peaks and troughs.
Visualization:
The original, unsmoothed EWO is plotted as a histogram, with positive values in green and negative values in red.
The smoothed EWO is plotted as a blue line, providing a clearer view of the underlying trend.
The breakout bands, if enabled, are plotted as white lines to visualize the upper and lower bounds of the oscillator's movement.
Positive peaks and negative troughs that meet the filtering criteria are marked with purple triangles (for peaks) and red triangles (for troughs) on the chart.
Customization Options:
Timeframe-based Smoothing and Tolerance: Different smoothing lengths and tolerance levels can be set for daily, hourly, and 5-minute charts.
Breakout Bands: Users can toggle the display of breakout bands and adjust their visual properties.
Peak Filtering: Peaks and troughs can be filtered based on whether they break out beyond the bands, or all peaks can be shown.
This indicator provides a unique blend of trend detection through the Elliott Wave Oscillator and derivative analysis to highlight significant market reversals while offering breakout bands as a filtering mechanism for false signals.
Elliott Wave Theory [Alerts]This indicator may be one of the first to provide signals & alerts for the Elliott Wave Theory Pattern. Unfortunately, there are few, if any, indicators that are public which allow the Elliott Wave Theory to be plotted+with alerts.
Because this is experimental, I'm going to offer access to it free of charge. Send me a direct message requesting access.
Elliott Wave Theory is a complex chart pattern to learn, and even harder to master. It requires being able to identify the wave lengths of price history and using various tools to plot and assess the price structure in order to find the wave counts. Whilst there are many ways to compute the waves apart of the pattern, there is no universal method that everyone would agree upon. For this indicator, I am using the traditional method.
The different colors represent different cycle types. Using it on a higher timeframe is strongly encouraged for best results.
This version currently provides alerts for the final wave, wave 5. I WILL BE ADDING MORE TO THIS INDICATOR SHORTLY, SEE BELOW:
-Will be adding the other counts to display all the waves
-Will be adding 'correction wave' alerts
-Will be adding 'inverse' pattern alerts
-Will be improving the the labels to include their cycle type
This is not a buy & sell indicator.. This is a TOOL to help analyze the market using Elliott Wave Theory.
The indicator should be used for the following:
-Aiding with EWT analysis
-Helping find potential exit points
-Assist with learning EWT by using this as a template
-Timing trades and improving risk management
-Plotting the overall market

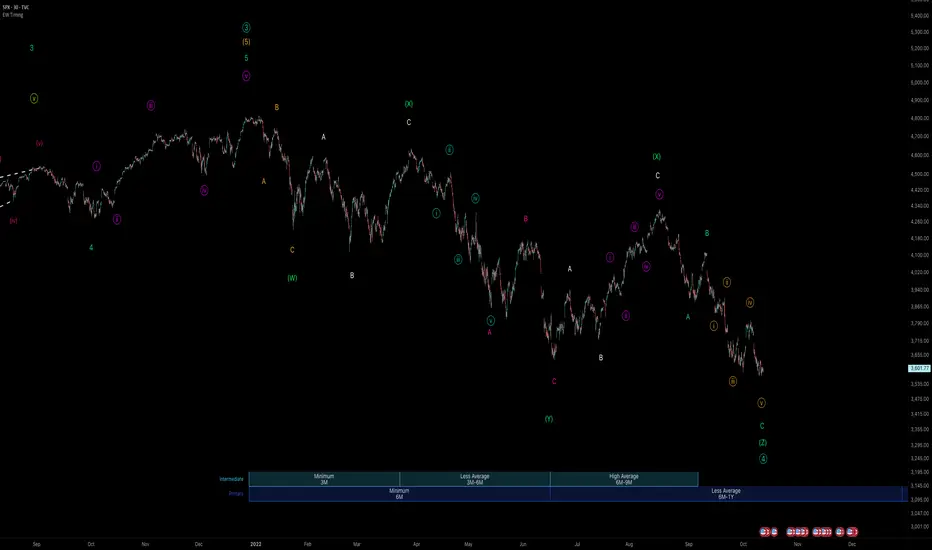
Elliott Wave AnalysisInitially, Elliott wave analysis is designed to simplify and increase the objectivity of graph analysis using the Elliott method. Probably, this indicator can be successfully used in trading without knowing the Elliott method.
The indicator is based on a supertrend. Supertrends are built in accordance with the Fibonacci grid. The degree of waves in the indicator settings corresponds to a 1-hour timeframe - this is the main mode of working with the indicator. I also recommend using weekly (for evaluating large movements) and 1-minute timeframes.
When using other timeframes, the baseline of the indicator will correspond to:
1 min-Submicro
5 minutes-Micro
15 minutes-Subminuette
1 hour-Minuette
4 hours-Minute
Day-Minor
Week-Intermediate
Month-Primary
Those who are well versed in the Elliott method can see that the waves fall on the indicator almost perfectly. To demonstrate this, I put the markup on the graph

MACD Divergence MultiTimeFrame [FantasticFox]This is a MACD divergence on 3 time-frames, 1h, 4h and 1D.
Please insert the indicator into a 1h chart, otherwise change the lengths' inputs.
you will see H1,H2, H3, R1, R2 and R3 in green and maroon colors.
H means hidden divergence, 1 regards to 1h, 2 to 4h, and 3 to 1D. If the color is green, its bullish, and if its maroon the divergence is bearish.
Gray circles on 4h macd is for those traders who want to check the confirmation on Elliott wave changes.
*Thanks to RicardoSantos MACD divergence.

Elliott Wave Multi-Level (Micro/Main)**Title Suggestion:**
Elliott Wave Multi-Level Strategy (Micro/Main)
**Short Description (for TradingView):**
This strategy detects Elliott Waves on two levels — **Micro** (short-term swings) and **Main** (higher-level structures) — and uses them for fully automated long and short trading.
Main Impulse waves (1–5) and ABC corrections are identified using pivot logic, ATR-based movement filters, volume confirmation, and an optional EMA trend filter. Micro Impulse waves serve as confirmation for Main structures, creating a multi-level validation system that significantly reduces false signals.
Entries are taken either:
* **with the trend**, after confirmed Main Impulse waves, or
* optionally as **reversal trades** at the completion of ABC corrections.
Stop-loss and take-profit levels are dynamically calculated using ATR multipliers, allowing the strategy to adapt to different volatility environments. All parameters (pivots, filters, confirmations, risk settings) are fully customizable to fit various markets and timeframes (e.g., 1m–15m).

Elliott Wave - Wave 3 Entry EngineThis indicator is a Wave 3 entry engine built on top of an Elliott Wave–style 1-2-3 structure. It automatically finds potential Wave 3 trades, manages a simple R-multiple target/stop model, and marks outcomes directly on the chart.
What the indicator does
At a high level, the script:
Detects swing points on three “degrees”
Small (S) – fast, local swings
Medium (M) – broader swings
Large (L) – higher-timeframe context only
Looks for a 3-pivot pattern (W0 → W1 → W2)
Bullish setup: Low → High → Higher Low (L-H-L)
Bearish setup: High → Low → Lower High (H-L-H)
Checks whether that pattern is a valid Wave 1–2 structure
Using multiple rules:
Wave 2 retraces Wave 1 by a configurable fraction
Wave 1 is strong enough (percentage move + slope)
Wave 2 doesn’t overshoot Wave 0 too far
Trend direction and swing “consensus” across S/M/L degrees line up
Scores the setup (Pre-W3 Score)
The script calculates a 0–1 score based on:
How “nice” the Wave 2 retracement is vs the ideal level
How much stronger Wave 1’s slope is vs Wave 2’s pullback
How much consensus there is across the swing engine (S/M/L)
Only setups above your chosen minimum Pre-W3 score and that pass alignment checks become Wave 3 candidates.
Waits for breakout → creates a Wave 3 “entry”
For longs: price breaks above the Wave 1 high (plus an optional tick buffer)
For shorts: price breaks below the Wave 1 low (minus buffer)
When triggered, the indicator:
Stores entry price (close at breakout)
Sets a stop beyond Wave 2 (with optional extra ticks)
Calculates a target based on a fixed R multiple (e.g., 2R)
Tracks the trade until exit or timeout
For each open W3 trade, it monitors:
Target hit → marks “W3 ✅”
Stop hit → marks “W3 ❌”
Bar where both could have hit → conservative loss “W3 ?/❌”
Time-based expiry (too many bars in trade) → “W3 ⏰”
Candidates that never get a breakout within your chosen max bars from W2 can also be marked as timeout (⏰).
Visual elements on the chart
The script can plot several helpful visuals:
Swing connector lines (Small/Medium/Large)
Small = blue
Medium = purple
Large = orange
These show the detected swings at each degree
Pre-W3 labels at Wave 2 (optional)
Signals :
"Pre-W3 Long XX%" or"Pre-W3 Short XX%"
Placed at the Wave 2 pivot
Colored yellow, with the % score rounded to an integer
W3 Entry labels (optional)
"W3 Long Entry" below the bar for longs (green)
"W3 Short Entry" above the bar for shorts (red)
Outcome labels (optional)
W3 ✅ – target hit
W3 ❌ – stop hit
W3 ?/❌ – both hit on same bar, treated as loss
W3 ⏰ – candidate or trade timed out
All these can be toggled in the “Wave 3 Engine (Pre-W3 + Entries + Outcomes)” group.
Input groups & how to use them
Swing Detection (Small / Medium / Large)
These groups control how the script finds swing highs/lows using a multi-parameter pivot scan:
Left Min / Left Max / Right Min / Right Max
Define the pivot “strength” ranges (how many bars to the left/right the high/low must dominate).
Minimum swing % (post-aggregation)
Ensures that, once swings are merged and cleaned up, each swing is at least this % move from the prior opposite swing.
Loop Filters (Small/Medium/Large loop min % change)
Extra gating inside the pivot-search loop, so small noise pivots can be ignored even before final swing construction.
Practical use:
Tighten % thresholds or increase left/right bars to reduce noise.
Loosen them to get more swings and more potential W3 setups.
Wave 3 Logic
Wave 2 depth
W2 min / max retracement of W1 (fraction)
Example: 0.30–0.80 means W2 must retrace 30–80% of W1.
Ideal W2 retracement (for scoring)
Often set around 0.618 (classic fib). The closer W2 is to this, the higher the retracement part of the score.
Max W2 beyond W0 (%)
How far W2 may push past W0 (in %) before the setup is invalid. Set to 0 to disable this filter.
Wave 1 strength
Min W1 move (%)
Ensures Wave 1 itself is meaningful.
Min |W1 slope| / |W2 slope|
Wave 1 must be “steeper” than Wave 2’s correction.
Slope ratio for max score
Above this, extra slope advantage doesn’t improve the score further.
Scoring & Trend Alignment
Min Pre-W3 score (0..1)
Hard gate: anything below this won’t become a W3 candidate.
Trend alignment (S/M/L)
Options:
None – ignore swing directions, purely pattern/score based
Majority – at least 2 of S/M/L must point in the W3 direction
AllThree, S+M, S+L, M+L – stricter alignment variants
Alignment uses the latest swing direction (up or down) for each degree.
Max W3 candidates to track
Limits how many candidates + trades are stored. Old, already-closed items are pruned first; open trades are never pruned.
This is an indicator, not an order engine**:** it doesn’t place trades; it only marks hypothetical Wave 3 entries and outcomes based on your settings. Always validate on historical data and combine with your own analysis and risk management before using it in live trading.

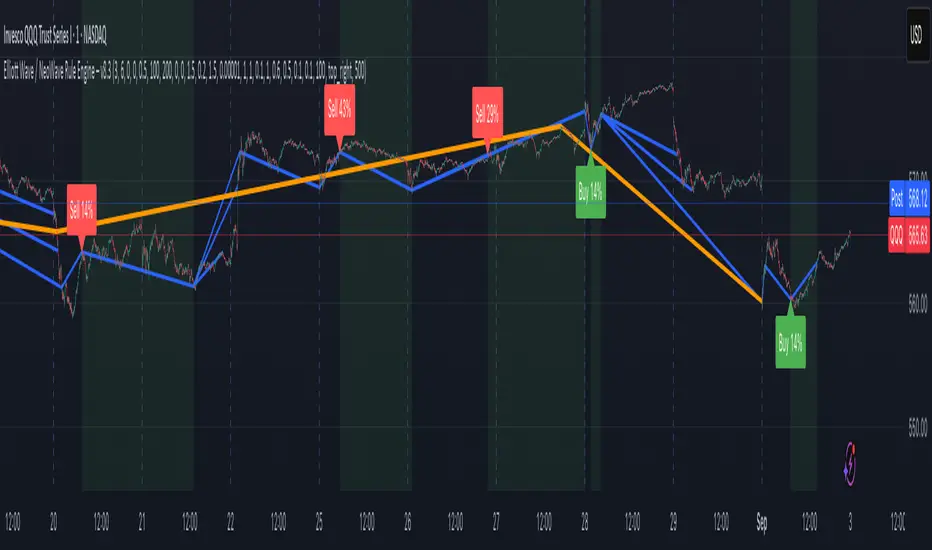
Elliott Wave Rule EngineWhat this tool does
The indicator scans price for two concurrent swing structures—a Small (shorter-degree) and a Large (higher-degree) set—then applies an Elliott/NeoWave rule engine to the most recent 5-swing motive (1-2-3-4-5) or 3-swing corrective (A-B-C). It produces:
Blue lines for Small swings and Orange lines for Large swings.
A rule dashboard (optional) showing PASS/FAIL/WARN for core rules & guidelines.
Buy/Sell labels when (a) a valid motive completes and (b) loop “consensus,” alignment, and scoring gates are satisfied.
Reading the chart
Small swings: thin blue segments, built from your Small settings.
Large swings: thicker orange segments, from your Large settings.
Background tint: faint green when a motive (impulse/diagonal) is valid right now on Small.
Labels (if enabled):
“1…5” or “A-B-C” markers on the latest detected structure.
Buy/Sell label at the last pivot when all gates pass; text may include a score %.
How it works
For both Small and Large degrees the script:
- Loops over all (left, right) combinations you specify (e.g., Small Left = 3..6, Right = 0..0) and calls ta.pivothigh/low.
- Aggregates the results:
- Keeps the most extreme pivot found in the loop (highest high or lowest low) that’s newer than the last accepted swing.
- Gates acceptance by minimum % change versus the last opposite swing (inside the loop) and a post-aggregation filter (Small Minimum swing %, Large Minimum swing %).
- Merges back-to-back same-type swings (HH or LL) by keeping only the more extreme one.
- Keeps only the last N=lookbackWaves swings (default 100).
- Consensus (used for signals) comes from the loop counts:
- sBuyConsensus = small L-count / total-combos (bullish bias)
- sSellConsensus = small H-count / total-combos (bearish bias)
(and the same for Large). This is a data-driven “how many combos agreed” measure.
2) Rule engine (Impulse/Diagonal vs. Corrective)
When there are at least 6 Small swings, the engine tests 1-2-3-4-5:
Hard rules (must pass for an Impulse):
- Wave-2 not > 100% of Wave-1 (no retrace beyond start of W1).
- Wave-3 not the shortest among 1,3,5.
- Wave-4 doesn’t overlap Wave-1 (if it does, structure may be a Diagonal).
- Diagonal eligibility: Rules 1 & 2 pass but Rule 3 fails ⇒ eligible as a Diagonal (
Guidelines (7 checks, count toward a threshold you set):
- W2 retraces a Fib level (within ±fibTol).
- W4 retraces a Fib level (within ±fibTol).
- W3 strongest momentum (speed = |Δprice| / bars).
- Alternation: W2 vs W4 have meaningfully different “sharpness” (price per bar), threshold altSlopeThr.
- Proportion (Price): |W1| and |W3| within propTolP× each other.
- Proportion (Time): W1W3 and W2W4 durations within propTolT×.
- W5 weaker than W3 (momentum divergence proxy).
A Motive is valid if:
- Impulse: all 3 hard rules pass and guideline passes ≥ Min guideline passes.
- Diagonal: diagonal-eligible and guideline passes ≥ Min guideline passes.
- if motive fails, the engine still evaluates ABC as Zigzag and Flat to populate the table:
- Zigzag: B shallower than ~0.618A; C ≈ A or 1.618A (±fibTol).
- Flat: B ≥ ~0.9A; expanded flat if B > 1.0A and C in *A; “running” note if C < A.
3) Signal logic (consensus-gated & scored)
Signals fire only on new Small pivots and only if a Small motive just validated:Direction comes from the motive’s W1 (up = bull, down = bear).
Consensus checks (from the loop):
Use Sell consensus if the last pivot is a High, or Buy consensus if it’s a Low.Require it ≥ Min SMALL loop consensus and ahead of the opposite side by at least Min consensus margin.If you also require Large quality: check the corresponding Large consensus ≥ Min LARGE loop consensus.
Alignment: If Require small/large directional alignment is ON, Small and Large directions must match (or the Large motive must be complete).
Score:
- If Large not required: finalScore = smallConsensus × smallQuality.
- If Large required: finalScore = smallConsensus × smallQuality × largeQuality.
- Need finalScore ≥ Min final score.
When all gates pass, you’ll see “Buy xx%” or “Sell xx%” at the pivot.
Inputs (explained):
- Smaller Wave Swing Detection (Looped)
- Small Left Min / Max (default 3..6): ta.pivot* left widths to scan.
- Small Right Min / Max (default 0..0): right widths to scan (0 = earliest confirmation).
- Small Minimum swing % (post-aggregation) (0.3%): filters out tiny swings after the loop.
- Larger Wave Swing Detection (Looped)
- Large Left Min / Max (100..200) and Right Min/Max (0..0): higher-degree scan (defaults are big; adjust for intraday).
- Large Minimum swing % (post-aggregation) (1.5%).
- Loop Filters (inside the loop)
- Small loop min % change (0.20%): a candidate pivot counts only if move vs. last opposite Small swing ≥ this.
- Large loop min % change (1.50%): same idea for Large.
Rule Engine Tolerances
- Fibonacci tolerance (±%) (0.05 = 5%): closeness to Fib levels.
-Same-degree TIME proportion max (x) (2.00×) and PRICE proportion max (x) (3.00×).
- Alternation slope ratio threshold (0.10): higher = stricter alternation.
- Min guideline passes (0–7) (5): threshold for motive validity.
- Signal Probability (Loop Consensus)
- Min SMALL loop consensus (0.60).
- Min LARGE loop consensus (0.50) (used only if Large validation matters).
- Min consensus margin vs opposite (0.10): e.g., 0.60 vs 0.45 fails (margin 0.15 passes).
Require LARGE 1–5 valid (or diagonal) for signal (off by default).
Min final score (0.20): gate on the composite score.
Annotate label with score % (on).
WARN (orange): guideline not met—pattern can still be valid if total passes ≥ Min guideline passes.
FAQ
Q: Why did I get a diagonal instead of an impulse?
A: Wave-4 overlapped Wave-1 (Rule 3). If Rules 1 & 2 pass and guidelines meet your minimum, it’s eligible as a Diagonal.
Q: Where do Buy/Sell labels come from?
A: Only after a valid Small motive at a new pivot, and only if consensus, alignment, and final score gates pass (per your settings).
Q: It “missed” a wave in hindsight.
A: Pivots require right bars to confirm; extremely tight settings can filter that swing; adjust Small min % or ranges.
Q: Are there repaints?
A: No, It uses standard pivot confirmation; until a pivot is confirmed, recent swings can evolve. After confirmation, lines/labels are stable.
Limitations & disclaimers
Elliott/NeoWave rules are heuristics; markets are messy. Treat outputs as structured context, not certainty.
Consensus is pattern-scan agreement, not probability of profit Not investment advice; always couple with risk management.

Elliott Wave / NeoWave Rule Engine – v6.9This script functions as a "rule engine" that automatically identifies significant price swings and then tests them against a comprehensive set of Elliott Wave rules and guidelines.
The goal is to filter out low-probability setups and identify valid motive (impulse and diagonal) waves by applying user-defined tolerances. The script plots swings on the chart and can display a real-time dashboard that shows which rules are passing or failing. When a valid motive wave is detected, it can generate buy or sell signals.
User Settings
The script's behavior is controlled by a set of user inputs, organized into four main groups.
Swing / ZigZag Detection
These settings control how the script identifies the price swings that form the basis of the wave patterns.
Pivot Left Bars & Pivot Right Bars: These two values determine the sensitivity of the swing detection. A pivot point (a high or low) is only identified if it is the highest or lowest price within the specified number of bars to its left and right. Increasing these numbers will result in fewer, larger swings.
Minimum swing % (filter micro noise): This is a crucial filter. It ignores swings that are too small to be considered significant, helping to clean up the chart and prevent the engine from analyzing "noise." For example, a value of 0.3 means any swing that is less than 0.3% of the price range will be ignored.
Rule Engine Tolerances
This group allows you to define how strict the validation rules are.
Fibonacci tolerance (±%): This sets the acceptable margin of error for Fibonacci relationships (e.g., a 0.618 retracement). A value of 0.001 means a retracement between 0.617 and 0.619 will be considered a valid match.
Same-degree TIME proportion max (x): This sets the maximum time difference allowed between waves of the same degree (e.g., Wave 1 and Wave 3) to still be considered "proportional." A value of 1 means Wave 3's duration can be up to 1 time longer than Wave 1's duration, and vice-versa.
Same-degree PRICE proportion max (x): Similar to the time tolerance, this sets the maximum price difference allowed between waves of the same degree to still be considered proportional.
Alternation slope ratio threshold: This is a key NeoWave guideline. It checks if Wave 2 and Wave 4 have different "sharpness" (price change per bar). A higher value makes the alternation rule stricter.
Min guideline passes for motive validation (0–7): This is the gating feature. Even if a pattern passes all the hard Elliott Wave rules (e.g., no overlap, Wave 3 isn't the shortest), you can still require it to pass a minimum number of guidelines (like Fibonacci relationships, alternation, etc.) before a signal is generated. A value of 7 means every guideline must be met.
Momentum / Volume Guidelines
These are additional checks for pattern validation.
Momentum length: This setting controls a proxy for momentum, which is calculated based on the speed of price movement.
Use volume checks: This is a placeholder for future functionality. It does not currently affect the script's behavior.
UI / Debug
These settings control the visual aspects of the script on your chart.
Max swings to keep/evaluate: This determines how far back the script looks to find and analyze swings. A larger number will analyze more historical patterns but may impact performance.
Show detected labels: Toggles the display of numerical (1-2-3-4-5) and letter (A-B-C) labels on the detected waves.
Show rule PASS/FAIL dashboard: Toggles the on-chart table that provides a detailed breakdown of which rules and guidelines are met.
Table Position: Controls where the rule dashboard is located on your chart.
Print debug info to Data Window: If you are a developer or want to see the underlying data, this will print information to TradingView's Data Window.
Show Buy/Sell Signals: Toggles the display of Buy/Sell signals. These signals are only generated when a pattern passes all the hard rules and your minimum guideline pass requirement.
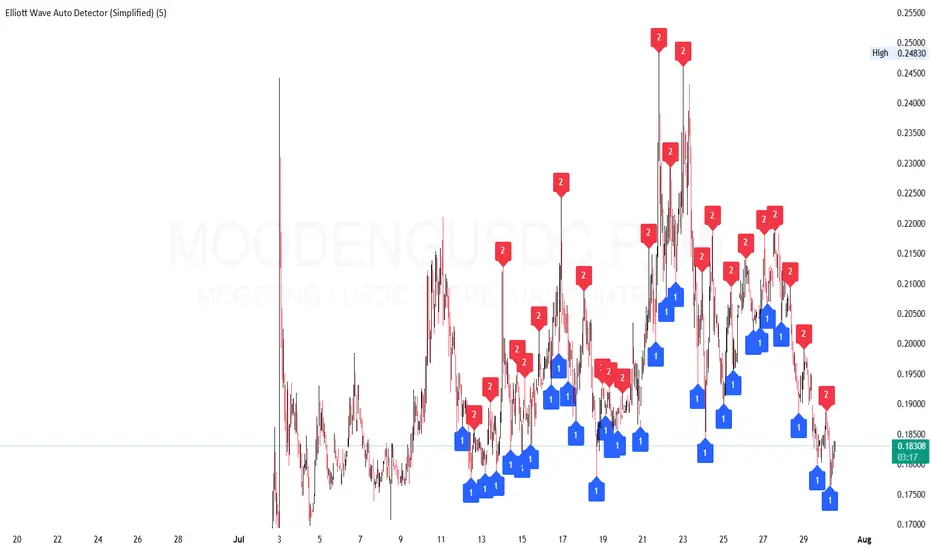
Elliott Wave Auto Detector (Simplified)How to Use the Detector
Identify Structure: Look for sequences like 1-2-1-2...
These may show a forming or ongoing Elliott wave pattern.
Validate Trend: Multiple red 2’s at lower highs suggests a bearish trend; the reverse with blue 1’s at higher lows is bullish.
Trading Zones:
Consider buying near clusters of blue 1’s (support zones).
Consider selling or shorting near clusters of red 2’s (resistance zones).
Look for Breakouts: If price breaks out of the descending channel, trend may reverse or accelerate.