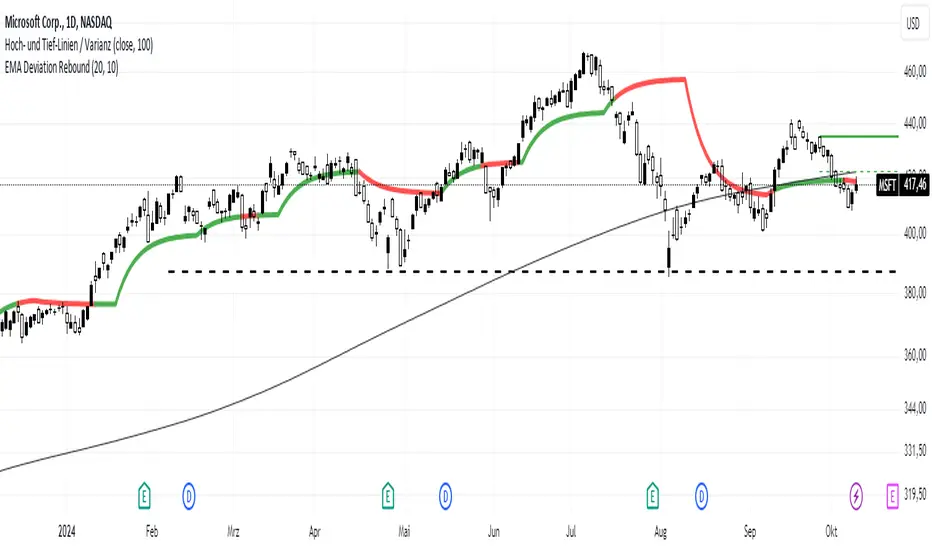
EMA Deviation ReboundThe " EMA Deviation Rebound " indicator I've created utilizes calculations involving the standard deviation of closing prices and exponential moving averages (EMA) to generate a line. The color of this line changes based on whether the EMA value is above or below the current closing price. This can be interpreted as an indicator for potential buy or sell signals:
Buy Signal: If the price crosses the indicator from bottom to top, this can be considered a buy signal. This could indicate that the price has overcome a resistance and a potential upward movement may be forthcoming.
Sell Signal: If the price crosses the indicator from top to bottom, this could serve as a sell signal. This might suggest that the price has broken a support downward and possibly indicates an impending downward movement.
The indicator is named "EMA Deviation Rebound" because I use it to identify potential resistance and support levels. When the price rebounds at the indicator, this could signify a price movement in the opposite direction.
It's important to use such indicators in conjunction with other analysis techniques and market information to make informed trading decisions.
Pine Script® indicator