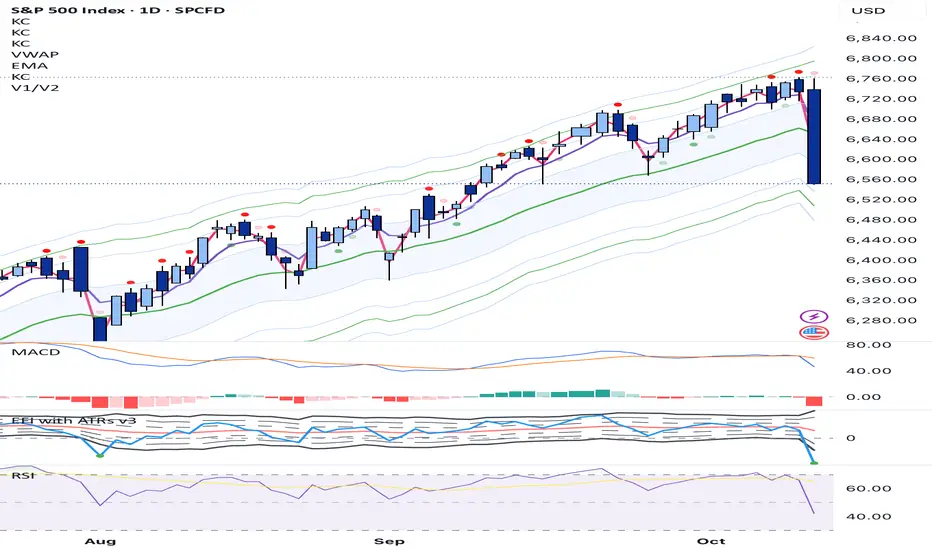
Kerry Lovvorn Spiketrade V1 and V2 Entry TriggersKerry Lovvorn (Spiketrade) V1 and V2 entry triggers.
Long entry triggers
V1 entry = green dot below price bar.
V2 entry = light green dot below price bar.
Short entry triggers
V1 entry = red dot above price bar.
V2 entry = light red dot above price bar.
Search in scripts for "entry"
Alt buy signal 1H Entry + 4H Confirm (MACD + Stoch RSI + HMA)This indicator is a multi-timeframe (MTF) analysis tool designed for the ALT trading , capturing entry signals on the 1-hour (1H) timeframe and confirming trends on the 4-hour (4H) timeframe. It combines MACD, Stoch RSI, and Hull Moving Average (HMA) to identify precise buy opportunities, particularly at reversal points after a downtrend or during trend shifts. It visually marks both past and current BUY signals for easy reference.
Key Features:
1H Entry Signal (Early Ping): Triggers on a MACD golden cross (below 0) combined with a Stoch RSI oversold cross (below 20), offering an initial buy opportunity.
4H Trend Confirmation (Entry Ready): Validates the trend with a 4H MACD histogram rising (in negative territory) or a golden cross, plus a Stoch RSI turn-up (above 30).
Past BUY Display: Labels past data points where these conditions were met as "1H BUY" or "FULL BUY," facilitating backtesting.
HMA Filter: Optional HMA(16) to confirm price breakouts, enhancing trend validation.
Purpose: Ideal for short-term scalping and swing trading. Supports a two-step strategy: initial partial entry on 1H signals, followed by additional entry on 4H confirmation.
Usage Instructions
Installation: Add the indicator to an IMX/USDT 1H chart on TradingView.
Signal Interpretation:
lime "1H BUY": 1H conditions met, consider initial entry (stop-loss: 3-5% below recent low).
green "FULL BUY": 1H+4H conditions met, confirm trend for additional entry (take-profit: 10% below recent swing high).
Customization: Adjust TF (1H/4H), MACD/Stoch RSI parameters, and HMA usage via the input settings.
Alert Setup: Enable alerts for "ENTRY READY" (1H+4H) or "EARLY PING" (1H only) conditions.
Advantages
Accuracy: Reduces false signals by combining MACD golden cross below 0 with Stoch RSI oversold conditions.
Dual Confirmation: 1H for quick timing and 4H for trend validation, improving risk management.
Visualization: Past BUY points enable easy backtesting and pattern recognition.
Flexibility: 4H confirmation mode adjustable (histogram rise or golden cross).
Limitations
Timeframe Dependency: Optimized for 1H charts; may not work on other timeframes.
Market Conditions: Potential whipsaws in sideways markets; additional filters (e.g., RSI > 50) recommended.
Manual Management: Stop-loss and take-profit require user discretion.

ICT Entry Models (Riz)The ICT Entry Models Indicator is a complete framework built to help traders visualize and apply multiple Institutional concepts on a single chart. Instead of relying on one entry technique, this tool combines 14+ ICT entry models and evaluates them under a unified structure. Each model is detected independently but filtered through a multi-factor confluence engine that considers liquidity, higher-timeframe structure, premium/discount zones, and session context. This ensures only high-probability setups are highlighted.
What This Indicator Does
⦁ Detects and plots ICT-based entry models such as: Fair Value Gaps, Order Blocks, Breakers, Liquidity Grabs, Stop Hunts, Asian Range Breakouts, Silver Bullet setups, Power of Three, Judas Swing, Unicorn model, Market Maker models, Previous Day High/Low breaks, and others.
⦁ Automatically validates entries using higher timeframe confirmation and confluence filters.
⦁ Provides risk management tools with structural stop-loss, ATR-based SL, TP1/TP2 targets, and R:R calculations.
⦁ Displays visual trade labels showing direction, strength, and expected risk/reward.
⦁ Includes a performance dashboard that tracks win rates, session stats, and risk outcomes.
How It Works
Each entry model is activated through custom detection logic. The script checks for key conditions like displacement, imbalance, BOS/CHoCH, liquidity sweeps, and premium/discount zones. When multiple models align, the indicator assigns a signal strength rating.
⦁ Weak setups: Highlighted but marked lower confidence.
⦁ Strong setups: Require confluence of liquidity, structure, and time-based filters (e.g., killzones).
⦁ The indicator then calculates a safe stop-loss placement (always on the correct side of price) and take-profit levels based on Goldbach ratios and volatility expansion.
Inputs
⦁ Model Toggles: Enable/disable individual entry models (e.g., FVG only, OB only, or full confluence).
⦁ Confluence Filters: Higher-timeframe structure, premium/discount zones, volatility thresholds.
⦁ Risk Management Settings: ATR multiplier, fixed SL/TP options, R:R target adjustments.
⦁ Dashboard & Visuals: Choose which stats, labels, and levels appear on chart.
How to Use
1. Apply the indicator to any forex, crypto, or index chart.
2. Select your timeframe. For scalping, use 1–5m with HTF confirmation. For day/swing trades, use 15m–1H with HTF overlays.
3. Toggle your preferred entry models (e.g., FVG + Liquidity Sweep) or enable all for confluence.
4. Watch for strong confluence signals: entry marker + calculated SL/TP + dashboard confirmation.
5. Use the signals as decision support not as automated buy/sell triggers.
Notes & Tips
Best used in liquid markets (Majors, Gold, Indices, BTC/ETH).
HTF confirmation greatly improves accuracy e.g., align 1m entries with 15m structure.
Combining time-based models (Silver Bullet, Killzones) with structural models improves precision.
Disclaimer
This tool is for educational and research purposes only. It is not financial advice, nor does it guarantee profitability. All trading involves risk, and users should test thoroughly before applying live.

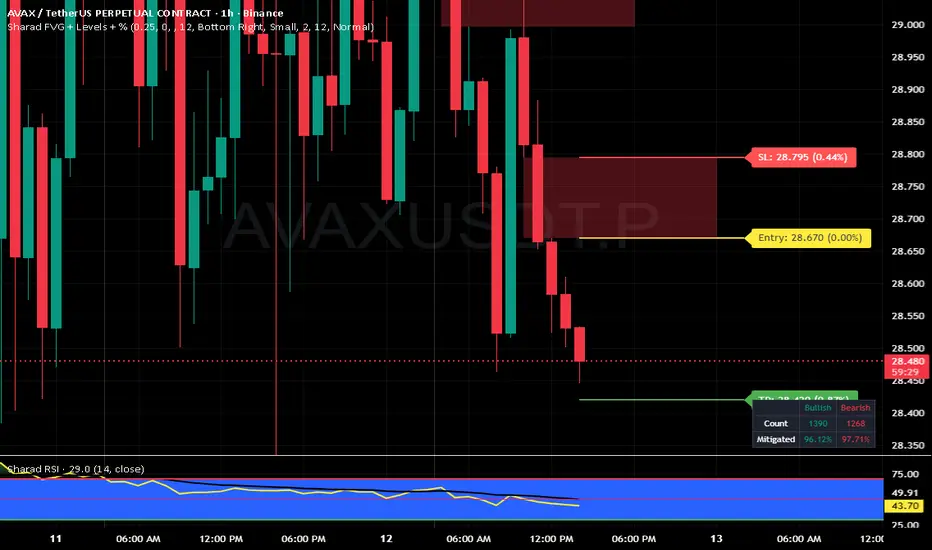
Sharad FVG (Last FVG SL/TP + Entry + % + Label Size)Sharad Fair Value Gap — Last FVG Entry, SL & TP (with % Labels)
What it is
A streamlined Fair Value Gap (FVG) tool that plots exact trading levels for the latest unmitigated FVG only:
Entry (yellow)
Stop-Loss (red)
Target (green) computed from a configurable Risk:Reward
Price and percentage distance printed on the right of each line
Optional dashboard and optional visualization of recent unmitigated/mitigated FVGs
The goal is simple: find the newest valid imbalance and give you just three actionable levels—no clutter.
How it detects FVGs
The script uses the standard 3-candle FVG logic (inspired by LuxAlgo’s implementation):
Bullish FVG forms when:
low > high and close > high and the gap size exceeds the Threshold filter.
The bullish gap is between high (lower bound) and low (upper bound).
Bearish FVG forms when:
high < low and close < low and the gap size exceeds the Threshold filter.
The bearish gap is between low (lower bound) and high (upper bound).
Threshold % filters small/weak gaps. You can also enable Auto, which estimates a dynamic threshold from recent candle ranges, so tiny imbalances don’t spam your chart in low-volatility regimes.
You may set Timeframe to detect FVGs on the chart timeframe or any higher/lower TF via request.security.
“Latest FVG only” levels (the core feature)
From the most recent unmitigated FVG (bullish or bearish), the script draws:
Entry
Bullish FVG → Entry = higher side of the gap (the gap max)
Bearish FVG → Entry = lower side of the gap (the gap min)
Stop-Loss (SL) = the opposite side of that same gap
Target (TP) = Entry + (Risk × R:R) for bulls, Entry − (Risk × R:R) for bears
where Risk = |Entry − SL| and R:R is your input (default 1:2)
Each line shows the price and its absolute % distance from Entry in parentheses—like TradingView’s long/short tool.
Alerts included
These are carried over from the base logic so you can build workflows:
Bullish FVG – when a new bullish gap is detected
Bearish FVG – when a new bearish gap is detected
Bullish FVG Mitigation – when a bullish gap is filled
Bearish FVG Mitigation – when a bearish gap is filled
Credits & License
Inspiration & base logic: LuxAlgo’s “Fair Value Gap ”.
This script: modified and extended by Sharad (Entry/SL/TP for latest FVG, price/% labels, label sizing, decluttered drawing).
License: This derivative keeps the original CC BY-NC-SA 4.0 license.
Attribution: Credit LuxAlgo for the original FVG approach and detection logic.
Non-Commercial: You may not use this for commercial purposes.
Share-Alike: If you remix/redistribute, you must use the same license and provide attribution.
Disclaimer:
Educational use only. Nothing in this script or its description is financial advice or a recommendation to buy/sell any asset. Markets involve substantial risk. Past performance and historical fill rates do not guarantee future results. You are solely responsible for your trading decisions and risk management. Data feeds, broker routing, spreads, slippage, and TradingView’s real-time behavior (especially with MTF) can affect outcomes. Test thoroughly on a demo account and consider multiple forms of confirmation before risking capital.
CIAN - Breakout Auto Entry v2.0📌 Indicator Description — CIAN - Breakout Auto Entry
CIAN - Breakout Auto Entry is a script designed to automatically detect entry opportunities during breakouts from consolidation zones, based on professional technical criteria used by momentum and breakout traders. This tool clearly visualizes the entry level, Stop Loss (SL) and Take Profit (TP) zones, helping you maintain a structured and disciplined trading plan.
🧠 What does this indicator do?
It detects breakouts from prior bases when the following key conditions are met:
Price is above the 8, 21, and 50 EMAs.
Volume is above the average (i.e. greater than the 20-period SMA).
Candle closes above the high of the last 10 days.
It then automatically draws:
📦 Green TP zone (based on configurable R/R).
📦 Red SL zone (set at the previous candle’s low).
📘 Precise entry level at the breakout point.
It also deletes previous boxes when a new signal appears, keeping the chart clean.
Includes an integrated alert that notifies you as soon as a valid breakout is detected.
🛠️ Configurable Parameters:
Fast, medium, and slow EMAs (default: 8, 21, 50).
Risk/Reward Ratio (TP/SL), default value: 1.2.
Visual duration of boxes (default: 5 bars).
🎯 Ideal for:
Swing Traders
Breakout Traders
Users of 1D or 4H timeframes as their main setup

ICT Sweep + FVG Entry (v6) • Antoine📌 ICT Sweep + FVG Entry (Antoine)
This indicator is designed for price action traders who follow ICT concepts and want a mechanical tool to spot liquidity sweeps, fair value gaps (FVGs), and precise entry signals.
🔎 Key Features
Liquidity Pools (HTF)
• Automatically plots recent swing highs/lows from a higher timeframe (5m/15m).
• These act as Buy Side Liquidity (BSL) and Sell Side Liquidity (SSL) levels where stop orders accumulate.
Sweep Detection
• Identifies when price breaks a pool (BSL/SSL) but closes back inside → a classic liquidity grab.
• Plots a triangle on the chart when a sweep is confirmed.
Fair Value Gap (FVG) Highlighting
• Detects bullish and bearish FVGs on the execution timeframe (ideal for 1m).
• Option to display active FVG zones with shaded boxes.
Entry Signals
• A signal (cross) appears when:
A liquidity sweep occurs.
An FVG forms in the direction of the rejection.
Price retests the FVG (entry at the 50% mid-level or edge).
Alerts Ready
• Get alerted for sweeps (bullish/bearish) and for entry confirmations (long/short FVG retests).
🎯 How to Use
Choose your HTF (5m or 15m) → The indicator maps major liquidity pools.
Drop to LTF (1m) → Wait for a sweep signal at one of the pools.
Confirm with FVG → If an FVG appears in the sweep’s direction, the indicator waits for a retest.
Entry → Enter on the retest of the FVG (edge or 50%).
Risk Management
Stop loss: just beyond the sweep’s wick.
Target: opposite liquidity pool.
Minimum recommended R:R: 1:2.
✅ Why this helps
This tool makes it easier to trade ICT-style setups without missing opportunities:
No need to manually draw every swing high/low.
Automatic FVG detection saves time.
Clear sweep + FVG + retest logic keeps your entries mechanical and disciplined.
⚠️ Disclaimer: This script is for educational purposes only. It does not guarantee profits. Always use proper risk management.

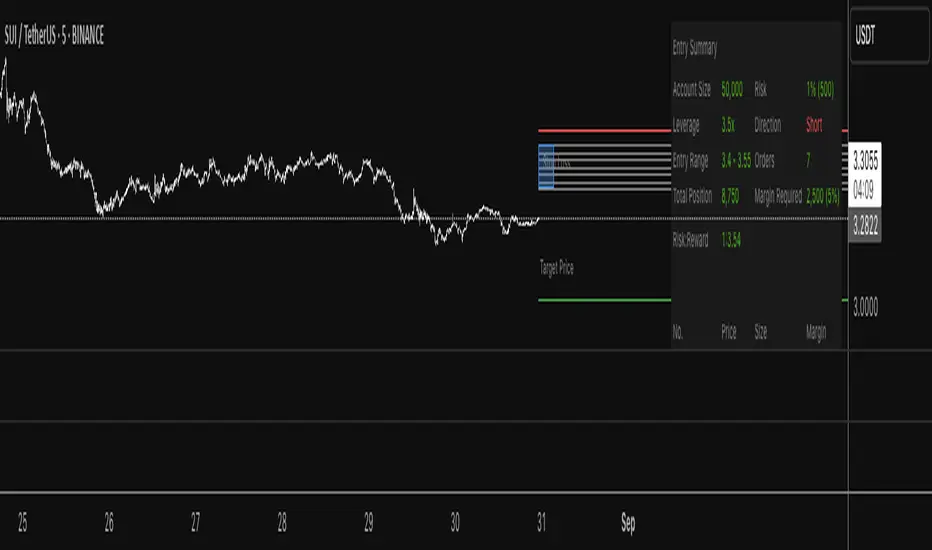
Progressive Entry Position Sizer v3Progressive Entry Position Sizer (PEPS) - DEVELOPMENT VERSION
⚠️ IMPORTANT DISCLAIMER: This indicator is currently in development and should NOT be relied upon for trading accuracy. Use at your own risk and always verify calculations independently before making any trading decisions.
Overview:
The Progressive Entry Position Sizer (PEPS) is a risk management tool designed to help traders plan multiple entry positions with progressive scaling. This indicator calculates position sizes and margin requirements across multiple entry levels while maintaining consistent risk exposure.
Key Features:
Progressive Risk Scaling: Uses a token-based system (1, 2, 3, 4, 5...) to progressively increase position sizes at each entry level
Leverage Support: Accommodates leverage up to 50x with proper margin calculations
Dollar-Based Position Sizing: Displays position values in dollar amounts rather than share quantities
Visual Entry Planning: Shows entry zones, target, and stop loss levels with extended lines
Comprehensive Risk Table: Detailed breakdown of each entry with position values and margin requirements
How It Works:
Set your account balance, risk percentage, and leverage
Define primary entry, final entry, target, and stop loss prices
Choose number of limit orders (2-8)
The indicator calculates evenly distributed entry prices with progressive position sizing
Each subsequent entry receives more "risk tokens" resulting in larger position sizes
Use Cases:
Planning DCA (Dollar Cost Averaging) strategies
Risk management for leveraged positions
Visualizing multi-entry trading setups
Educational purposes for understanding progressive scaling
⚠️ Development Status:
This script is actively being developed and may contain bugs or calculation errors. Always:
Verify all calculations manually
Test thoroughly on paper trades first
Consult with financial professionals
Never risk more than you can afford to lose
Feedback Welcome:
As this is a development version, user feedback and suggestions for improvements are greatly appreciated.
This indicator is for educational and planning purposes only. Not financial advice.
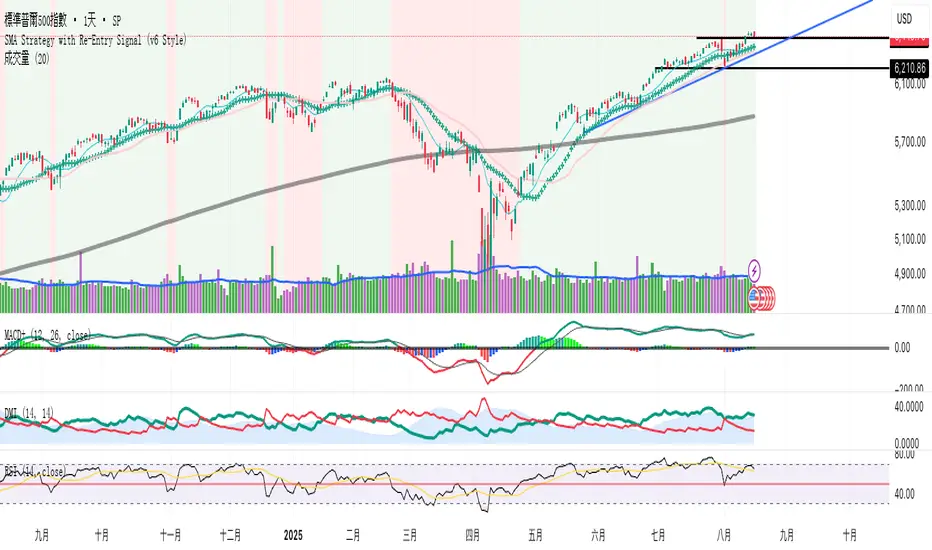
SMA Strategy with Re-Entry Signal (v6 Style)*SMA Trend Strategy with Re-Entry Signal (v6 Edition)*
This indicator is based on a classic moving average trend-following system, enhanced with re-entry signals designed for medium to short-term traders.
---
### 📈 Key Features:
1. *Trend Detection Logic:*
- The 30-period SMA (SMA30) is used as the trend filter.
- When the closing price is above the SMA30, the market is considered to be in an uptrend.
2. *Re-Entry Signal:*
- While in an uptrend, if the closing price crosses above the SMA20, a re-entry (add position) signal is triggered.
- These signals are shown with green upward arrows below the bars.
3. *Background Highlighting:*
- Green background: indicates an uptrend.
- Red background: indicates a break below SMA30, suggesting weakening momentum.
4. *Multi-SMA Visualization:*
- Five SMAs are displayed: SMA10, SMA20, SMA30, SMA60, and SMA250.
- This helps visualize both short-term and long-term trend structures.
---
### 🔍 Usage Tips:
- Use this script directly on your main chart to monitor trend direction and wait for re-entry signals during pullbacks.
- Combine with other tools like volume, price action, or candlestick patterns to confirm entries.
---
### ⚠️ Disclaimer:
- This indicator is for educational and informational purposes only. It does not constitute financial advice or a buy/sell signal.
- Avoid relying solely on this script for trading decisions. Always manage your own risk.
---
👨💻 *Developer’s Note:*
This script is 100% manually developed, not copied or auto-generated. It is an original implementation based on my personal trading logic. Suggestions and feedback are welcome!
Scalper SMA-RSI-MACD – Entry/Exit Signals v2Scalper SMA–RSI–MACD Strategy (Intraday) – Indicator Version
This is an intraday scalping and short-term trading tool designed for manual trading. It provides entry and exit signals based on a combination of trend, momentum, and volatility-based risk management.
Core Components
Trend Filter (Optional)
Uses an EMA (default 200) and an SMA ribbon (5/8/13) to identify the primary trend direction.
Only allows long trades in uptrend and short trades in downtrend (can be turned off for more signals).
Entry Conditions
RSI Pullback: Detects oversold (for long) or overbought (for short) conditions based on a short RSI (default length = 4).
MACD Momentum Turn: Detects bullish or bearish MACD crossovers or momentum shifts.
Both conditions must occur within a specified lookback period (default = last 3 bars).
Stop Loss (SL) Placement
SL is placed at a fixed multiple of the ATR (Average True Range) from the entry price (default = 1.5 × ATR).
Adjusting the multiplier changes how far the SL is placed.
Take Profit (TP) Levels
Two targets: TP1 and TP2, each based on R-multiples of the SL distance.
Default: TP1 = 1 × risk (1:1 R/R), TP2 = 2 × risk (1:2 R/R).
Exit Modes (Selectable)
TP1 or SL
TP2 or SL
Opposite signal (exit when the opposite entry condition appears)
Session Filter (Optional)
Can restrict trading signals to specific market hours (default off for more signals).
Signals and Alerts
Displays LONG and SHORT arrows for entries.
Plots SL and TP levels on the chart.
Marks exits as TP, SL, or opposite signal.
Built-in alertcondition() allows creating TradingView alerts for all entry and exit events.
Typical Usage
Works best on 1-minute to 5-minute charts for scalping; can be adapted to higher timeframes for swing trading.
Ideal for manual execution — the trader sees the signal, checks market conditions, and decides whether to enter.
Can be tuned for more or fewer signals by adjusting RSI thresholds, MACD lookback, and trend filter settings.

Ayman Entry Signal – Ultimate PRO (Scalping Gold Settings)1. Overview
This indicator is a professional gold scalping tool built for TradingView using Pine Script v6.
It combines multiple price action and technical filters to generate high-probability Buy/Sell signals with built-in trade management features (TP1, TP2, SL, Break Even, Partial Close, Stats tracking).
It is optimized for XAUUSD but can be applied to other assets with proper setting adjustments.
2. Key Features
Multi-Condition Trade Signals – EMA trend, Break of Structure, Order Blocks, FVG, Liquidity Sweeps, Pin Bars, Higher Timeframe confirmation, Trend Cloud, SMA Cross, and ADX.
Full Trade Management – Auto-calculates lot size, SL, TP1, TP2, Break Even, Partial Close.
Dynamic Chart Drawing – Entry lines, SL/TP lines, trade boxes, and real-time PnL.
Statistics Panel – Tracks wins, losses, breakeven trades, and total PnL over selected dates.
Customizable Filters – All filters can be turned ON/OFF to match your strategy.
3. Main Inputs & Settings
Account Settings
Capital ($) – Total trading capital.
Risk Percentage (%) – Risk per trade.
TP to SL Ratio – Risk-to-reward ratio.
Value Per Point ($) – Value per pip/point for lot size calculation.
SL Buffer – Extra points added to SL to avoid stop hunts.
Take Profit Settings
TP1 % of Full Target – Fraction of TP1 compared to TP2.
Move SL to Entry after TP1? – Activates Break Even after TP1.
Break Even Buffer – Extra points when moving SL to BE.
Take Partial Close at TP1 – Option to close half at TP1.
Signal Filters
ATR Period – For SL/TP calculation buffer.
EMA Trend – Uses EMA 9/21 crossover for trend.
Break of Structure (BoS) – Requires structure break confirmation.
Order Block (OB) – Validates trades within OB zones.
Fair Value Gap (FVG) – Confirms trades inside FVGs.
Liquidity Sweep – Checks if liquidity zones are swept.
Pin Bar Confirmation – Uses candlestick patterns for extra confirmation.
Pin Bar Body Ratio – Controls strictness of Pin Bar filter.
Higher Timeframe Filters (HTF)
HTF EMA Confirmation – Confirms lower timeframe trades with higher timeframe trend.
HTF BoS – Confirms with higher timeframe structure break.
HTF Timeframe – Selects higher timeframe.
Advanced Filters
SuperTrend Filter – Confirms trades based on SuperTrend.
ADX Filter – Filters out low volatility periods.
SMA Cross Filter – Uses SMA 8/9 cross as filter.
Trend Cloud Filter – Uses EMA 50/200 as a cloud trend filter.
4. How It Works
Buy Signal Conditions
EMA 9 > EMA 21 (trend bullish)
Optional filters (BoS, OB, FVG, Liquidity Sweep, Pin Bar, HTF confirmations, ADX, SMA Cross, Trend Cloud) must pass if enabled.
When all active filters pass → Buy signal triggers.
Sell Signal Conditions
EMA 9 < EMA 21 (trend bearish)
Same filtering process but for bearish conditions.
When all active filters pass → Sell signal triggers.
5. Trade Execution & Management
When a signal triggers:
Lot size is auto-calculated based on risk % and SL distance.
SL is placed beyond recent swing high/low + ATR buffer.
TP1 and TP2 are calculated from the SL using the reward-to-risk ratio.
Break Even: If enabled, SL moves to entry price after TP1 is hit.
Partial Close: If enabled, half of the position closes at TP1.
Trade Exit: Full exit at TP2, SL hit, or partial close at TP1.
6. Chart Display
Entry Line – Shows entry price.
SL Line – Red dashed line at stop loss level.
TP1 Line – Lime dashed line for TP1.
TP2 Line – Green dashed line for TP2.
PnL Labels – Displays real-time profit/loss in $.
Trade Box – Visual area showing trade range.
Pin Bar Shapes – Optional, marks Pin Bars.
7. Statistics Panel
Stats Header – Shows “Stats”.
Total Trades
Wins
Losses
Breakeven Trades
Total PnL
Can be reset or filtered by date.
8. How to Use
Load the Indicator in TradingView.
Select Gold (XAUUSD) on your preferred scalping timeframe (1m, 5m, 15m).
Adjust settings:
Use default gold scalping settings for quick start.
Enable/disable filters according to your style.
Wait for a Buy/Sell alert.
Confirm visually that all desired conditions align.
Place trade with calculated lot size, SL, and TP levels shown on chart.
Let trade run – the indicator manages Break Even & Partial Close if enabled.
9. Recommended Timeframes
Scalping: 1m, 5m, 15m
Day Trading: 15m, 30m, 1H
Swing: 4H, Daily (adjust settings accordingly)

AymaN Entry Signal – With HTF + Pin Bar + Multi TP + BE + V1Ayman Entry Signal – Indicator Description
Overview
Ayman Entry Signal – With HTF + Pin Bar + Multi TP + BE + Stats Panel (V1)
This is a professional-grade Pine Script indicator designed for scalping and intraday trading, with full trade management, multi-confirmation logic, and advanced visualization. The tool is ideal for traders focused on XAUUSD (Gold), Forex, and other volatile instruments who seek both precision entries and structured exits with dynamic risk control.
Main Features
Advanced Entry Logic:
- EMA fast/slow crossovers (configurable)
- Optional conditions: Break of Structure (BoS), Order Block (OB), Fair Value Gap (FVG), Liquidity sweeps, Pin Bars
- HTF confirmation using EMA or BoS
- Real-time entry condition display
Trade Management:
- Dynamic calculation of Entry, SL (with ATR buffer), TP1, TP2
- Supports Partial Close and Break Even logic after TP1
- Visual PnL label (dynamic and color-coded)
Statistics Panel:
- Shows total trades, win/loss/breakeven count, cumulative PnL
- Filter by custom date or session
- Fully customizable panel appearance
Trade Visualization:
- Trade box includes all trade levels (Entry, SL, TP1, TP2)
- Visual display of trade conditions and PnL result
- Option to keep previous trades on chart
Alert System:
- Alerts for Buy and Sell entries
- Compatible with webhook automation systems like MT5/MT4
Customization & Inputs
- Capital & risk per trade
- Value per pip/point
- SL buffer (ATR-based)
- Manual EMA override
- Enable/disable: EMA, BoS, OB, FVG, Liquidity, Pin Bars
- HTF: timeframe + confirmation logic
- Trade box/labels visibility
- Full color customization
- PnL label position: top, center, or bottom
Recommended Use
- Ideal for Gold scalping (XAUUSD), also effective for Forex
- Best on 1m–15m charts; use HTF confirmation from 15m–4H
- Pairs well with semi-automated systems using alerts and webhooks
Disclaimer
Note: This is a non-executing indicator. It does not place trades but provides visual and statistical guidance for professional manual or semi-automated trading.

Futures Trade Entry Indicator (MTF)Work in Progress with the help of Claude. Not ready for active trading. Public for help improving. This will be a multi-timeframe futures trading indicator with supply/demand zones, Fair Value Gaps (FVGs), and sophisticated entry/exit logic.I've created a comprehensive Pine Script v6 indicator that matches all your specifications! Here's what the script includes:
## **Key Features Implemented:**
### **🔄 Multi-Timeframe Logic**
- **1H Chart Data**: Detects Supply Zones, Demand Zones, and Fair Value Gaps
- **Current Timeframe**: Monitors for re-entry and confirmation signals
### **📊 Zone Detection**
- **Supply Zones**: Identified using pivot highs with configurable strength
- **Demand Zones**: Identified using pivot lows with touch validation
- **Fair Value Gaps**: Both bullish and bearish FVGs detected automatically
- **Auto-Expiry**: Zones expire after 24 hours (configurable)
### **⚡ Entry Logic**
- **Dual Confirmation Required**:
- ✅ Engulfing candle pattern (bullish/bearish)
- ✅ Market structure shift (HH→LL or LL→HH)
- **Zone Re-entry**: Price must be within identified zones/FVGs
### **🎯 Probability System**
- **Smart Scoring**: Based on zone age, strength, and risk/reward ratio
- **Color-Coded**: Green (High), Yellow (Medium), Red (Low)
- **Real-time Calculation**: Updates with each potential entry
### **🎨 Visual Elements**
- **Colored Zones**: Supply (red), Demand (green), FVGs (blue/orange)
- **Entry Labels**: 🟩 LONG / 🟥 SHORT markers
- **Probability Labels**: Display confidence levels
- **Confirmation Shapes**: Triangle indicators for pattern completion
### **⚙️ Manual Controls**
All the requested toggles are available in the settings panel:
- Show/Hide Supply Zones
- Show/Hide Demand Zones
- Show/Hide FVGs
- Show/Hide Labels
- Show/Hide Probability
- Zone strength and expiry settings
- Custom colors for all elements
### **🔔 Alert System**
- Entry opportunity alerts
- Includes probability assessment
- Ticker symbol identification
## **Usage Instructions:**
1. **Apply to 15m chart** for active trading signals
2. **Configure settings** based on your preferences
3. **Set up alerts** for automated notifications
4. **Monitor probability levels** for trade quality assessment
The script automatically handles the complex multi-timeframe analysis while keeping the interface clean and user-friendly. All zones update dynamically and expire appropriately to avoid clutter.
Would you like me to adjust any specific parameters or add additional features?

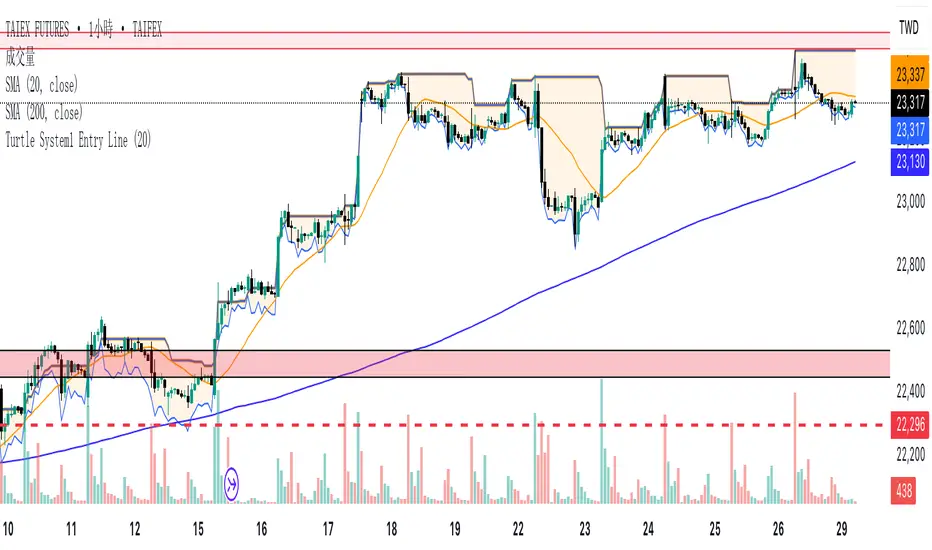
Turtle System1 Entry LineTurtle System 1 Entry Line
Capture classic Turtle Trading breakouts with ease. This Pine Script indicator dynamically plots the highest high over your chosen look‑back period, helping you spot System 1 entry opportunities at a glance.
Key Features:
Configurable Breakout Period: Default 20 bars, fully adjustable to suit any market or timeframe.
Real‑Time Visualization: Overlays the entry line directly on your price chart for immediate clarity.
Lightweight & Efficient: Written in Pine v5 for optimal performance and minimal repainting.
Optional Alerts: Easily hook into TradingView’s alert system to notify you when price crosses above the entry line.
How to Use:
Add “Turtle System 1 Entry Line” to your chart.
Set your preferred look‑back length in the indicator’s settings.
Watch for breakouts above the plotted line—and consider them your System 1 entries.
Bring the time‑tested discipline of the original Turtle methodology into your own trading routine!
Universal ATR Grid from Entry Price with AlertsUniversal ATR Grid from Entry Price with Alerts
This Pine Script v6 indicator creates a dynamic price grid based on a user-defined entry price and ATR for selected instruments (SOLUSDT, XRPUSDT, DOGEUSDT, PEPEUSDT, WIFUSDT).
Users can customize the entry price, ATR, number of levels (up to 5), and step multiplier per instrument.
The grid shows long (green) and short (red) levels around the entry price (gray), with labels offset right.
Lines extend from labels to the current bar, updating dynamically.
Alerts trigger on breakouts of long, short, and entry levels. Instrument names can be modified in the script.

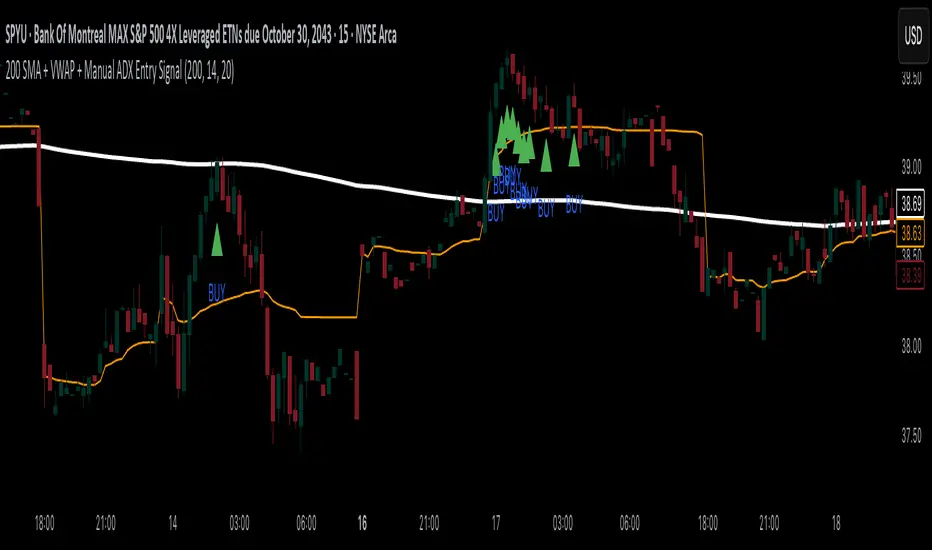
200 SMA + VWAP + Manual ADX Entry Signal200 SMA + VWAP + Manual ADX Entry Signal – Indicator Description
This custom indicator is designed for trend-following intraday traders who want a powerful, rules-based entry confirmation system. It combines three proven tools—the 200-period Simple Moving Average (SMA), Volume-Weighted Average Price (VWAP), and a manually coded ADX (Average Directional Index)—to identify high-probability long entries in strong, directional markets.
By filtering trades through a combination of trend direction, mean-reversion reference, and momentum strength, this indicator helps traders avoid false breakouts, whipsaws, and low-quality setups. It’s particularly well-suited for traders using 15-minute charts, leveraged ETFs, or high-beta stocks, where precision entries and trend confirmation are critical to consistent profitability.
⸻
✅ What This Indicator Does
This indicator visually displays:
• The 200-period SMA (orange line) – a long-term trend filter.
• The VWAP (blue line) – a dynamic intraday price average used by institutions.
• A buy signal triangle below the price bar – when all bullish criteria are met.
• It also includes an alert condition so traders can be notified when a new buy signal appears in real time.
Behind the scenes, the indicator calculates trend and strength conditions and plots a BUY signal only when all three tools agree that a bullish move is in play.
⸻
🔍 The Three-Pillar Entry System
1. 200 SMA Filter – Defining Market Bias
The 200 SMA is a widely used institutional benchmark that represents long-term trend direction. In this indicator:
• A trade is only considered valid if price is above the 200 SMA.
• This helps eliminate trades in downtrending or range-bound markets.
• It ensures that entries are aligned with broader directional bias.
By filtering out trades below the 200 SMA, you instantly remove a majority of low-probability setups and whipsaw environments.
⸻
2. VWAP – Institutional Mean Price Anchor
VWAP (Volume-Weighted Average Price) is often used by hedge funds and algorithmic systems to judge whether price is considered “expensive” or “cheap” within a given trading session.
• This version of VWAP is anchored to the current intraday session.
• Trades are only considered valid if price is above the VWAP, which shows market consensus is favoring the upside.
• VWAP provides both confirmation and support levels, helping ensure your entry isn’t into overextended territory.
By combining the 200 SMA and VWAP filters, the indicator ensures that trades are only taken when price is strong on both the macro and micro timeframes.
⸻
3. ADX – Confirming Momentum Strength
ADX (Average Directional Index) is used to measure trend strength without regard to direction. However, TradingView has limited functionality with the ta.adx() call in some environments, so this script includes a custom-coded version of ADX that follows standard Wilder’s smoothing and directional movement logic.
• A BUY signal only triggers if ADX is above a user-defined threshold (default is 20) and rising from the previous bar.
• This means not only is the market trending — but the trend is strengthening.
This final filter prevents entries in chop or decaying rallies, and ensures you’re catching the strongest part of a move, not the tail end.
⸻
⚙️ Logic Summary
A BUY signal is plotted when:
• Price > 200 SMA ✅
• Price > VWAP ✅
• ADX > 20 and rising ✅
Only when all three conditions are true does the indicator plot a green triangle below the price bar.
This visual simplicity makes it ideal for fast trade decisions, and the alert function allows hands-free monitoring during busy sessions.
⸻
🧠 Recommended Use
This indicator works best on:
• 15-minute to 1-hour charts
• Intraday leveraged ETFs (e.g., TQQQ, SPYU, SQQQ)
• Trend-following strategies
• Breakout continuation trades
⸻
📉 Limitations
• This is a long-only system by design. If you want to trade short, you’ll need to invert the logic (e.g., price < 200 SMA, price < VWAP, ADX > threshold).
• It doesn’t generate exit signals. You should pair this with your own take-profit or trailing stop strategy.
• While it works great for momentum entries, it may underperform in range-bound or news-driven chop markets.
⸻
🛠️ Settings Customization
• SMA Length: default is 200; adjust for faster or slower trend confirmation.
• ADX Length: default is 14; shorter periods = more sensitive, longer = smoother.
• ADX Threshold: default is 20; raise to 25 or 30 to only catch very strong moves.
These settings give you flexibility to match the indicator to your trading style.
⸻
🚀 Final Thoughts
The 200 SMA + VWAP + Manual ADX Entry Signal is a battle-tested, rule-based tool to help you:
• Enter only when the trend, mean, and momentum align
• Avoid fakeouts and poor risk-reward entries
• Automate part of your setup process without overcomplication
This is the kind of filter used by professional traders to reduce screen time and improve trade quality. If you’re looking to build confidence in your intraday trading with clear, logical entries — this indicator will help you stay consistent and systematic.
Happy trading!
5DMA Optional HMA Entry📈 5DMA Optional HMA Entry Signal – Precision-Based Momentum Trigger
Category: Trend-Following / Reversal Timing / Entry Optimization
🔍 Overview:
The 5DMA Optional HMA Entry indicator is a refined price-action entry tool built for traders who rely on clean trend alignment and precise timing. This script identifies breakout-style entry points when price gains upward momentum relative to short-term moving averages — specifically the 5-day Simple Moving Average (5DMA) and an optional Hull Moving Average (HMA).
Whether you're swing trading stocks, scalping ETFs like UVXY or VXX, or looking for pullback recovery entries, this tool helps time your long entries with clarity and flexibility.
⚙️ Core Logic:
Primary Condition (Always On):
🔹 Close must be above the 5DMA – ensuring upward short-term momentum is confirmed.
Optional Condition (Toggled by User):
🔹 Close above the HMA – adds slope-responsive trend filtering for smoother setups. Enable or disable via checkbox.
Bonus Entry Filter (Optional):
🔹 Green Candle Wick Breakout – optional pattern logic that detects bullish momentum when the high pierces above both MAs, with a green body.
Reset Mechanism:
🔁 Signal resets only after price closes back below all active MAs (5DMA and HMA if enabled), reducing noise and avoiding repeated signals during chop.
🧠 Why This Works:
This indicator captures the kind of setups that professional traders look for:
Momentum crossovers without chasing late.
Mean reversion snapbacks that align with fresh bullish moves.
Avoids premature entries by requiring clear structure above moving averages.
Optional HMA filter allows adaptability: turn it off during choppy markets or range conditions, and on during trending environments.
🔔 Features:
✅ Adjustable HMA Length
✅ Enable/Disable HMA Filter
✅ Optional Green Wick Breakout Detection
✅ Visual “Buy” label plotted below qualifying bars
✅ Real-time Alert Conditions for automated trading or manual alerts
🎯 Use Cases:
VIX-based ETFs (e.g., UVXY, VXX): Catch early breakouts aligned with volatility spikes.
Growth Stocks: Time pullback entries during bullish runs.
Futures/Indices: Combine with macro levels for intraday scalps or swing setups.
Overlay on Trend Filters: Combine with RSI, MACD, or VWAP for confirmation.
🛠️ Recommended Settings:
For smooth setups in volatile names, use:
HMA Length: 20
Keep green wick filter ON
For fast momentum trades, disable the HMA filter to act on 5DMA alone.
⭐ Final Thoughts:
This script is built to serve both systematic traders and discretionary scalpers who want actionable signals without noise or lag. The toggleable HMA feature lets you adjust sensitivity depending on market conditions — a key edge in adapting to volatility cycles.
Perfect for those who value clean, non-repainting entries rooted in logical structure.

Fibonacci Optimal Entry Zone [OTE] (Zeiierman)█ Overview
Fibonacci Optimal Entry Zone (Zeiierman) is a high-precision market structure tool designed to help traders identify ideal entry zones during trending markets. Built on the principles of Smart Money Concepts (SMC) and Fibonacci retracements, this indicator highlights key areas where price is most likely to react — specifically within the "Golden Zone" (between the 50% and 61.8% retracement).
It tracks structural pivot shifts (CHoCH) and dynamically adjusts Fibonacci levels based on real-time swing tracking. Whether you're trading breakouts, pullbacks, or optimal entries, this tool brings unparalleled clarity to structure-based strategies.
Ideal for traders who rely on confluence, this indicator visually synchronizes swing highs/lows, market structure shifts, Fibonacci retracement levels, and trend alignment — all without clutter or lag.
⚪ The Structural Assumption
Price moves in waves, but key retracements often lead to continuation or reversal — especially when aligned with structure breaks and trend shifts.
The Optimal Entry Zone captures this behavior by anchoring Fibonacci levels between recent swing extremes. The most powerful area — the Golden Zone — marks where institutional re-entry is likely, providing traders with a sniper-like roadmap to structure-based entries.
█ How It Works
⚪ Structure Tracking Engine
At its core, the indicator detects pivots and classifies trend direction:
Structure Period – Determines the depth of pivots used to detect swing highs/lows.
CHoCH – Break of structure logic identifies where the trend shifts or continues, marked visually on the chart.
Bullish & Bearish Modes – Independently toggle uptrend and downtrend detection and styling.
⚪ Fibonacci Engine
Upon each confirmed structural shift, Fibonacci retracement levels are projected between swing extremes:
Custom Levels – Choose which retracements (0.50, 0.618, etc.) are shown.
Real-Time Adjustments – When "Swing Tracker" is enabled, levels and labels update dynamically as price forms new swings.
Example:
If you disable the Swing Tracker, the Golden Level is calculated using the most recent confirmed swing high and low.
If you enable the Swing Tracker, the Golden Level is calculated from the latest swing high or low, making it more adaptive as the trend evolves in real time.
█ How to Use
⚪ Structure-Based Entry
Wait for CHoCH events and use the resulting Fibonacci projection to identify entry points. Enter trades as price taps into the Golden Zone, especially when confluence forms with swing structure or order blocks.
⚪ Real-Time Reaction Tracking
Enable Swing Tracker to keep the tool live — constantly updating zones as price shifts. This is especially useful for scalpers or intraday traders who rely on fresh swing zones.
█ Settings
Structure Period – Number of bars used to define swing pivots. Larger values = stronger structure.
Swing Tracker – Auto-updates fib levels as new highs/lows form.
Show Previous Levels – Keep older fib zones on chart or reset with each structure shift.
-----------------
Disclaimer
The content provided in my scripts, indicators, ideas, algorithms, and systems is for educational and informational purposes only. It does not constitute financial advice, investment recommendations, or a solicitation to buy or sell any financial instruments. I will not accept liability for any loss or damage, including without limitation any loss of profit, which may arise directly or indirectly from the use of or reliance on such information.
All investments involve risk, and the past performance of a security, industry, sector, market, financial product, trading strategy, backtest, or individual's trading does not guarantee future results or returns. Investors are fully responsible for any investment decisions they make. Such decisions should be based solely on an evaluation of their financial circumstances, investment objectives, risk tolerance, and liquidity needs.

Perfect Entry VisualizerPerfect Entry Visualizer is a Pine Script v6 study designed purely as a historical analysis tool, not for live trading. It plots the theoretical “perfect” long and short entries on your chart based on a user-defined minimum price move. By alternately tracking swing lows for longs and swing highs for shorts, it shows exactly where a trade would have captured every move of at least X points, with X set by the “Minimum Move (Points)” input.
How it works
After each labeled entry it switches direction (long→short or short→long), so signals never overlap.
It never uses future data to predict; it simply waits for price to move far enough from the last extreme and then plots.
Adjusting the “Minimum Move (Points)” input controls how big a swing must be before an entry is marked: smaller values give more frequent signals, larger values highlight only the biggest moves.
Primary uses
Algo system benchmarking: compare your live strategy’s entries against the theoretical best to measure entry efficiency.
Manual trader review: visualize ideal swing entry timing to refine your own setups and fine-tune stop-and-profit targets.
Educational tool: teach price action concepts by showing exact points where a pure price-move strategy would have worked.
Performance analysis: overlay on any time frame or market to see which instruments and sessions offer the most clean, swing-based opportunities.
Alternative pivot point analysis: use it as a dynamic pivot high/low tool based on movement thresholds rather than fixed lookback bars.
Because it simply visualizes past price moves, you can paste it into any chart to instantly see the theoretical maximum trade capture for your chosen swing size. It’s a flexible comparison and learning aid, not a live signal generator.

P&L Entry Zone Marker (clean)This indicator is a simple visual calculator for futures traders.
It helps you track your long and short entry zones based on position size and average price.
🔹 Green line – recalculated long entry after averaging down.
🔹 Red line – short entry point.
You can manually input your initial entry, volume, averaging volume, and averaging price.
The script calculates your new average entry for long positions and plots both lines as full horizontal levels across the chart.
✳️ Useful for:
Visualizing break-even zones
Planning P&L zones for hedged positions
Quickly aligning your trades with market structure
✅ Clean version — no labels, just lines.
📉 Works on all symbols and timeframes.
AltcoinEvreni Entry/TP RR ToolMulti-Entry / Take-Profit Risk-Reward Tool
This indicator is designed to help traders visually plan and manage their trade entries, take-profit targets, stop-loss levels, and risk/reward calculations directly on the chart.
Key Features:
--- Up to 3 customizable entry levels with separate position sizing for each.
--- Up to 5 take-profit (TP) levels, each with individual allocation percentages.
--- Automatic calculation of weighted average entry price.
--- Dynamic risk and potential profit calculation based on your inputs.
--- Visual colored zones for entry, stop-loss, and take-profit areas on the chart.
--- Adjustable leverage and margin for position sizing.
--- Informative floating table displaying position type, entries, stop-loss, risk in $, potential
--- profit in $, and overall RR ratio.
--- Fully customizable appearance (colors, box width, table font size, etc.).
How to Use:
1- Set your trade direction (Long or Short).
2- Enter your planned entry prices, allocation percentages, and stop-loss.
3- Configure your take-profit levels and their respective allocation percentages.
4- Adjust margin, leverage, and visual preferences as desired.
5- The tool will display all relevant zones and statistics, helping you make better risk-managed trading decisions.
Notes:
--- All calculations and drawings update dynamically as you change your parameters.
--- Works on any symbol and timeframe.
--- For educational and planning purposes – always use your own judgment and risk management.

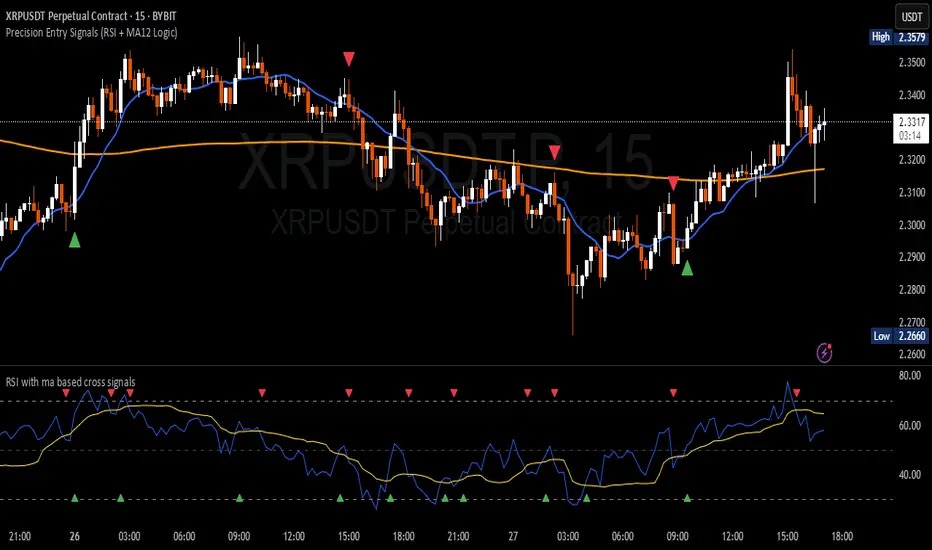
Precision Entry Signals (RSI + MA12 Logic)Description:
This script provides precise entry signals based on a clean confluence of MA12 breakouts and RSI momentum, filtered by a VWMA (Volume-Weighted Moving Average) of the RSI.
-----------------------------------------------------------------------------------------------------------------
🔹 Long entry conditions:
- Candle opens below the 12-period MA and closes above it
- RSI crosses above its VWMA
- Previous candle is bearish (additional confirmation)
🔹 Short entry conditions:
- Candle opens above the 12-period MA and closes below it
- RSI crosses below its VWMA
- Previous candle is bullish
----------------------------------------------------------------------------------------------------------------
Once a signal is confirmed, the script automatically draws:
Entry line (at close price)
Stop Loss line (just below recent lows for long, or above highs for short)
Take Profit 1 (1R)
Take Profit 2 (2R)
Labels are attached to the lines for clarity: ENTRY, SL, TP1, and TP2.
⚠️ Note: This tool only provides entry signals and visual risk/reward guidance. It does not manage exits dynamically. Manual trade management is recommended.
This script is intended for active intraday traders, especially on lower timeframes like 3-minute, 5-minute or 15-minute charts.
---------------------------------------------------------------------------------------------------------------
🔧 Recommended companion indicator:
For better confirmation and visual tracking of the RSI/VWMA cross logic, it is strongly recommended to also use the companion script:
🔹 Relative Strength Index (with MA based cross signals)
→ Shows RSI and its moving average visually, with triangle plots on every valid cross.
→ Matches exactly the RSI/VWMA behavior used in this entry signal script.
📌 Important:
After adding the RSI script to your chart, make sure to set:
RSI Length = 14
MA Type = VWMA
MA Length = 20
This ensures it visually matches the logic used by the entry signal script.
Both indicators are fully open source and meant to be used together — especially when trading manually.
EMA Cross Strategy + Breakout Entry (Trend Filtered)A High-Probability Trading Strategy Using EMAs and Long-Term Trend Filters in Pine Script
In financial markets, successful trading often depends on identifying high-probability setups with consistent rules and clear confirmations. The Pine Script developed here combines the simplicity of exponential moving average (EMA) crossovers with the robustness of long-term trend filtering, enhancing entry timing and reducing exposure to false signals. This essay explains the strategy’s logic, technical components, strengths, and its potential effectiveness for active traders.
Introduction to the Strategy
This Pine Script trading strategy is built upon two foundational components:
1. EMA Crossovers: A well-established technique where a fast EMA (8-period) and a slower EMA (21-period) are used to detect short-term momentum shifts.
2. Trend Filtering Using SMA: A 100-period simple moving average (SMA) acts as a long-term trend indicator. Only trades in the direction of the dominant trend are considered valid.
These two elements are combined to create a high-probability, trend-following system that aims to capture meaningful price movements while avoiding low-quality entries that typically occur during sideways or choppy markets.
⸻
Core Entry Logic
The script defines two distinct entry conditions designed to complement each other:
1. Standard EMA Crossover Entry (Type A)
This is a classic momentum entry condition. When the 8 EMA crosses above the 21 EMA, it indicates a shift in short-term momentum. However, this signal alone is insufficient in many market conditions, especially when the broader trend is unclear or reversing. To mitigate this risk, the crossover is only accepted when the 100 SMA is in an uptrend, defined as the SMA currently being higher than its value on the previous bar. This ensures the strategy only takes long entries in bullish environments, aligning with the principle of trading with the trend.
2. Breakout Entry After Trend Reversal (Type B)
The second entry condition captures powerful “breakout” opportunities that often follow a fresh trend reversal. Specifically, when the 100 SMA transitions from a downtrend to an uptrend, the script starts a 15-bar lookback window. If, during that window, the price, 8 EMA, and 21 EMA all rise above the long-term SMA, it is considered a confirmation of trend strength and momentum alignment. A long entry is then signaled.
This condition is designed to capitalize on early participation in new uptrends, catching strong price expansions that typically follow a change in market direction.
⸻
Exit Logic
The exit logic is intentionally simple and tied to the same framework as entries. A position is exited when the 8 EMA crosses below the 21 EMA, and the 100 SMA remains in an uptrend. This ensures that exits are aligned with weakening momentum while the larger trend remains bullish. This avoids premature exits during minor pullbacks and focuses on retaining trades during sustained uptrends.
Notably, exits do not occur when the long-term trend has flipped bearish. This design choice prevents “reverse trend” noise from triggering exits too early and instead focuses purely on short-term weakness within a bullish macro backdrop.
⸻
Technical Components of the Script
The Pine Script is structured with clear and logical components:
1. Inputs: The user can customize the periods for the fast EMA, slow EMA, long-term SMA, and the trend-reversal lookback window (defaulted to 15 bars).
2. Trend Detection: The long-term trend is calculated using the slope of the 100 SMA. If the SMA is rising, the trend is marked as bullish and is visually plotted in green; otherwise, it is plotted in red.
3. State Management: The script tracks how many bars have passed since the long-term trend turned bullish. This is managed using a var integer variable that resets upon trend reversal and increments while the trend remains up.
4. Entry and Exit Signals: These are plotted as shape markers on the chart — green triangles for entry and red triangles for exit — providing visual clarity.
Each of these components works in harmony to ensure that trade signals are issued only in favorable environments with multiple confirmations.
⸻
Benefits of the Strategy
There are several key advantages to using this hybrid strategy:
1. Filters Out Choppy Markets
By requiring the long-term SMA to be in an uptrend for any entry or exit signal to be valid, the strategy avoids noisy, sideways price action where EMA crossovers are more likely to produce false signals.
2. Dual Entry Approach
The inclusion of two different entry types allows the strategy to both:
• Capture new trends as they emerge (Breakout Entry).
• Ride existing trends using EMA crossover logic (Standard Entry).
This dual approach balances early participation with trend confirmation, offering flexibility for different market conditions.
3. Clear Exit Criteria
By tying exits to a momentum weakening signal (EMA crossover down), traders are not left guessing when to exit. This supports consistent execution and reduces emotional decision-making.
4. Trend Alignment
Aligning both entry and exit decisions with the broader trend increases the probability that trades will move in the desired direction. This is a cornerstone of successful trend-following strategies.
5. Modular Design
The script’s modularity allows traders to easily expand it with backtesting functions, alerts, or additional filters like RSI, ATR, or volume-based conditions, depending on their individual trading needs.
⸻
Use Cases and Applications
This strategy is particularly well-suited for swing traders and position traders operating on the 4-hour or daily timeframes. It is also effective on trending assets like equity indices, major stocks, or cryptocurrencies with defined directional movement.
Additionally, this script can be used as a signal engine in a larger portfolio of strategies, where only trades with trend confirmation are allowed to proceed. It can also function as a discretionary trading aid, helping traders visually identify when technical conditions align favorably.
⸻
Conclusion
This enhanced EMA crossover strategy, powered by a long-term trend filter and a secondary breakout entry condition, offers a robust and disciplined approach to navigating financial markets. By focusing on trading in the direction of a confirmed uptrend and using both momentum and structural price behavior for entry confirmation, the strategy aims to minimize whipsaw trades and maximize participation in sustained bullish moves.
Its simple logic, visual clarity, and strong filtering mechanisms make it both practical for new traders and a valuable foundation for more advanced systems. Whether used as-is or further expanded with custom features, this Pine Script serves as an excellent tool for executing a structured, high-probability trading plan.

SMC Entry Signals MTF v2📘 User Guide for the SMC Entry Signals MTF v2 Indicator
🎯 Purpose of the Indicator
This indicator is designed to identify reversal entry points based on Smart Money Concepts (SMC) and candlestick confirmation. It’s especially useful for traders who use:
Imbalance zones, order blocks, breaker blocks
Liquidity grabs
Multi-timeframe confirmation (MTF)
📈 How to Use the Signals on the Chart
✅ LONG Signal (green triangle below the candle):
Conditions:
Price is in a discount zone (below the FIB 50% level)
A bullish engulfing candle appears
A bullish Order Block (OB) or Breaker Block is detected
There’s an upward imbalance
A bullish OB is confirmed on the higher timeframe
➡️ How to act:
Consider entering long on the current or next candle.
Place your stop-loss below the OB or the nearest swing low.
Take profit at the nearest liquidity zone or premium area (above FIB 50%).
🔻 SHORT Signal (red triangle above the candle):
Conditions:
Price is in a premium zone (above FIB 50%)
A bearish engulfing candle appears
A bearish OB or Breaker Block is detected
There’s a downward imbalance
A bearish OB is confirmed on the higher timeframe
➡️ How to act:
Consider short entry after the signal.
Place your stop-loss above the OB or swing high.
Target the discount zone or the next liquidity pocket.
⚙️ Recommended Settings by Trading Style
Trading Style Suggested Settings Notes
Intraday (1–15m) fibLookback = 20–50, obLookback = 5–10, htf_tf = 1H/4H Fast signals. Use Discount/Premium + Engulfing.
Swing/Position (1H–1D) fibLookback = 50–100, obLookback = 10–20, htf_tf = 1D/1W Higher trust in MTF confirmation. Ideal with fundamentals.
Scalping (1m) fibLookback = 10–20, obLookback = 3–5, htf_tf = 15m/1H Remove Breaker and MTF for quick reaction trades.
🧠 Best Practices for Traders
Trend Filtering:
Use EMAs or volume to confirm the current trend.
Take longs only in uptrends, shorts in downtrends.
Liquidity Zones:
Use this indicator after liquidity grabs.
OBs and Breakers often appear right after stop hunts.
Combine with Manual Zones:
This works best when paired with manually drawn OBs and key levels.
Backtest the Signals:
Use Bar Replay mode on TradingView to test past signals.
🧪 Example Trade Setup
Example on BTCUSDT 15m:
Price drops into the discount zone.
A green triangle appears (bullish engulfing + OB + imbalance + HTF OB).
You enter long, stop below the OB, target the premium zone.
🎯 This type of setup often gives a risk/reward ratio of 1:2 or better — profitable even with a 40% win rate.
⏰ Alerts & Automation
Enable alerts:
"SMC Long Entry" — fires when a long signal appears.
"SMC Short Entry" — fires when a short signal appears.
You can integrate this with bots via webhook, like:
TradingConnector, 3Commas, Alertatron, etc.
✅ What This Indicator Gives You
High-probability entries using SMC logic
Customizable filters for entry logic
Multi-timeframe confirmation for stronger setups
Suitable for both intraday and swing trading
