Donchian Channel Oscillator (DonOsc) Preface
DonOsc stands for Donchian Channel Oscillator. This channel envelopes all prices, so if you set the height of the channel to 100 percent, you can plot the prices as percent in between, creating this sub-pane oscillator. For clarity the example chart shows a Donchian channel in the main-pane with the same look-back as the DonOsc, this way you can see how both are related.
Price River
Not only the close is plotted, but also the high and the low of the bar. Thus you get a structure that can be associated with a river, streaming from left to right, in which the price moves between the left bank (i.e. the plotted highs) and the right bank (i.e. the plotted lows), which meanders between the high border (100%) and the low border (0%) of the oscillator. The surface of the price river is gray. The price line is blue when up and dark red when down. The river has also color patches dark red, light red, blue and aqua. Stochastic patches; up: aqua, down: light red
If you look at the price river, you may notice that the price line is closer to the left bank (highs) when moving up and to the right bank (lows) when moving down. Because this phenomenon is used in the stochastic indicator, I named these stochastic patches. These are depicted on the wide side for visibility, so the aqua patches are to the right of the price line and the light-red patches to the left.
Widening patches; up: blue, down: red
If you look at tops or bottoms in bar charts, you may notice that long bars (wide range) tend to be there. You may say that prices turn with a ‘range bang’. This causes a widening of the price river, depicted as a patch on the wide side.
Channel Features
High (76.4 %) and low (23.6 %) Fibonacci levels.
In the oscillator there is no need to calculate Fibonacci levels, we can just plot them. If the price is above 50% the low level is shown with a green color, when below the high level with a pink color. When the price river crosses a level a ‘near border’ highlighter will flash, lime near the high border and orange near the low one.
New high and new low markers.
A flaw in the oscillator is that is doesn’t show actual new lows and new highs in the Donchian Channel, because everything is made relative. This is ‘repaired’ by adding markers, dark red for new low depicted between the high fib and border, blue for new high depicted between low fib and border. Used are the same colors as in the widening patches, because new highs and lows also lead to widening of the actual Channel.
Uptrend and downtrend highlighters.
If in the actual Channel the bars run in the upper half, an uptrend is happening as long as these remain there, a downtrend when the bars remain in the lower half. In the oscillator a yellow highlighter flashes when the price is higher than 50%, a red highlighter below 50%.
Interpretation of the DonOsc
This sub-pane indicator provides a wealth of useful information about what is going on in the market. First of all you immediately see whether there is an up or down trend and whether these lead to new highs or lows. Second of all you can estimate the importance of price movements in the context of the look-back period. Thirdly the width of the price river reveals the emotions in the market. The higher the emotions run, the more risk is involved in a postilion in the charted instrument.
Settings of the DonOsc
Look-back settings.
By default the script sets the look-back, depending on the time frame. This overrules the standard manual setting. If you switch this off, the manual setting will work. A feed-back label can by shown which informs about the current setting.
Smoothing
This concerns the price river. Default is 2, if you increase this setting, the river will loose its touch with the channel borders. O.t.o.h. the river wil be wider and better visible. Maximum setting is 5.
Colors
The momentum colors set both the river widening patches and new high and low markers.
Take care, Eykpunter.
Search in scripts for "fib"

dmn's ICT AMD-Goldbach█ OVERVIEW
This script is built on ICT time & price theory and the theory of algorithmic market maker models, and visualizes the intraday divided using powers of three into accumulation, manipulation and distribution cycles.
It also includes an automatically calculated and plotted Goldbach level (a.k.a. IPDA level or Huddleston level) overlay, to help visualize where in the current market maker profile price is in relation to the AMD cycles, and where it might trade to.
█ CONCEPTS
Accumulation, Manipulation, Distribution Cycles
A 24 hour day, with the default set to start at 20:00 CET (the start of the Forex CLS Settlement operational timeline) is split in three parts - 9, 6 and 9 hours for the three cycles (roughly corresponding with Asia, London Open and New York + London Close sessions).
Since charts are fractals, there's also intra-cycle time fibs available in the script, to highlight the smaller fractal equivalents in each cycle.
These cycles are used to visualize the three phases (AMD) for easier identification of the current daily profile by analyzing during what cycle highs and lows of the day are made.
An example of a bullish day could be price rallying before making a low during the accumulation cycle, being manipulated higher and retracing to form an optimal trade entry during the manipulation cycle, expanding and creating the high of the day before selling off during the distribution cycle, with a potential reversal before it ends.
Goldbach levels
The Goldbach levels are based on the size of a price range (or price swing, if you will) expressed as a factor of power of three (3^n).
To decide what number to tell the script to use for the calculation, we look at what 3^n number best fits an average swing on the preferred timeframe we're trading.
For example; PO3 27 (3^3)might be fit for scalping, while PO3 243 (3^5) may correspond to the daily or weekly range, depending on the asset.
The script then calculates a range high and a range low using a power of three formula based on the current price and divides it into levels using Goldbach numbers.
At these levels one might expect to see price form various "blocks" as defined in concept by Michael J. Huddleston.
The blocks that correspond to the Goldbach levels are labeled with abbreviations as follows:
Ext = External range
Low = Range low
High = Range high
FVG = Fair value gap
RB = Rejection block
OB = Order block
LV = Liquidity void
BR = Breaker
MB = Mitigation block
Using these levels and said blocks we identify where in the current running market maker profile price is offered, and trade the preferred timeframe in line with the AMD cycles accordingly.
█ FEATURES
Custom AMD time cycles session times.
Custom time fib for fractal cycles.
Color and style customization.
Show only current or also historical cycles.
Equilibrium mode for Goldbach levels (show only high/low and midpoint)
Autodetection of asset type, with manual override.
█ NOTE
The default timings for the AMD cycles are set up for Forex pairs. For other asset types, such as indices, other timings are nessecary for optimal results.
Goldbach levels requires the correct symbol type setting for the calculation to work properly. Disable the script's autodetection and enable/disable the Forex option according to the type of chart if it fails.
+ Dynamic Fibo-Donchian ChannelsThis is my second Donchian Channels indicator (and will probably be my last because how many does one really need). This version is different from my other one in that, well, it's 'dynamic' which simply means that it self adjusts based on the same formula that my Ultimate Moving Average does. What does that mean? It just means that the script takes an average of 8 different length, in this case, highest highs and lowest lows. The user doesn't need to pick a lookback/length/period/what-have-you. The indicator does it all itself. This, I think, makes for a very nice baseline or bias indicator to fit within a system that utilizes something like that. I also think it makes for a more accurate gauge of higher highs and lower lows within a timeframe, because honestly what does it mean to make a lower low over 20 periods or 8 periods or 50 periods? I don't know. What I do know is that traditional Donchian Channels never made much sense to me, but this does.
Additionally, I've kept (I guess that's not 'additionally') the fibonacci retracement levels from my other Donchian Channels indicator. These are calculated off the high and the low of the Donchian Channels themselves. You will see that there are only three retracement levels (.786, .705, .382), one of which is not a fib level, but what some people call the 'OTE,' or 'optimal trade entry.'' If you want more info on the OTE just web search it. So, why no .618 or .236? Reason being that the .618 overlaps the .382, and the .236 is extremely close to the .786. This sounds confusing, but the retracement levels I'm using are derived from the high and low, so it was unnecessary to have all five levels from each. I could have just calculated from the high, or just from the low, and used all the levels, but I chose to just calculate three levels from the high and three from the low because that gives a sort of mirror image balance, and that appeals to me, and the utility of the indicator is the same.
The plot lines are all colored, and I've filled certain zones between them. There is a center zone filled between both .382 levels, an upper and lower zon filled between the .786 and either the high or the low, and a zone between the .705 and .785
If you like the colored zones, but don't like the plots because they cause screen compression, turn off the plots under the "style" tab, or much more simply right click on the price scale and click 'scale price chart only.' Voila! No more screen compression due to a moving average or some other annoyance.
Besides that basis being a nice baseline indicator the various fib bands (or just the high and low bands) make for excellent mean reversion extremes in ranging environments.
There are alerts for candle closes across every line.
Below is an image of the indicator at default settings.
Below is an image of the indicator with the center .382 channel turned off.
Below is an image of the indicator with just the .786/.705 channel showing .
God Number Channel V1 (GNC V1)Channel, made of 5 MAs, which a made this way: High of N-period SMA - Low of N-period SMA + X-period SMA (check the code), where N and X are defined by your input.
Main purpose: helps you understand in what range price can move.
WARNING!
HAS TO BE USED WITH OTHER INDICATORS TO HAVE MORE ACCURATE ENTRIES!!!
If the price is above or below the channel, it means that the movement is very strong and you count it as a trend, but be careful then the price returns to the channel, as correction will follow very soon. Use fib correction tool to understand the approximate depth of correction, works pretty good.
Recommendation: consider using the Vortex Indicator( len 21 and 14 are fine; for trend) and "Vumanchu Divergencies + B"(for anything, but calibrate for accuracy, otherwise there will be too much false signals). If you want to see more options where the price might go, just add new MA and add/substract to/from its value avg1*(any of fibonacci correction levels, I personally use 1.618 and 2.618 and for me it is ok): plot(show_ma1 ? ma1+( [ [ ]]]*avg1) : na, color = ma1_color, title="MA №1")
Recommendations and feedback are welcome(!)
Take your wins

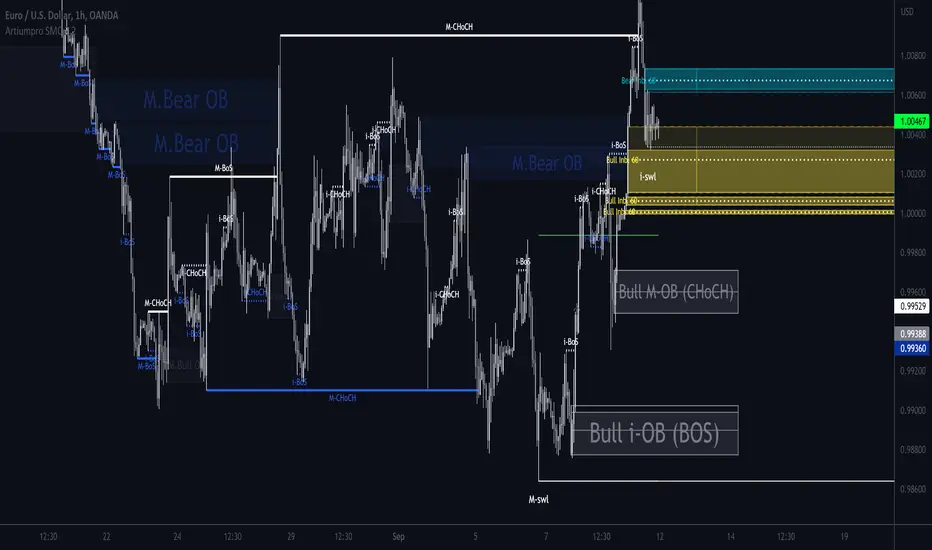
ArtiumPro Smart Money ConceptsSmart money concepts refer to the use of institutional trading strategies which align with the perspectives of Smart Money in the market. i.e. the composite man. Market Structure is the foundation of price action trading, understanding price action is fundamental to SMC.
ArtiumPro SMC 2.1 is an SMC (Smart Money Concepts) indicator full of features to aid SMC traders. Our aim is to save you time with automatic chart mark-up and help you spot areas of interest you may miss with the naked eye.
Fvg (Fair Value Gap) - is also known as an imbalance. An FVG is an imbalance of orders, for instance, for sellers to complete their trades, there must be buyers and vice versa so when a market receives too many of one kind of order buys or sells, and not enough of the order's counterpart. When the amount is not balanced and too many orders are put in for one direction, it creates an imbalance.
Multi timeframe FVG - this will show the same as above but on the higher timeframe you choose. It’ll show as 2 lines that show the higher timeframe fvg with a filled box that mitigates on entry.
Order Blocks - These are supply and demand zones, displayed typically as the last down/up candle before a move in the opposite direction. Great POI’s for entry and take profits.
Outside candle - this is a candle that sweeps the highs and lows of the previous candle, best used for the 1 hour or above these can indicate a change of price direction.
Previous day high & low
Not only does it show your previous day's low and high but it also shows your opening and close of the day. You have settings where you can turn off the open and close and just have daily highs and lows. It’s your choice within your settings.
Market Structure - We have packed this feature with options that are customizable for you,
Break of Structure (BOS) indicates a trend continuation.
Change of Character (CHoCH) indicates the first sign of a possible trend change.
Equal Highs/lows - this will mark your double/triple tops and bottoms.
Retracement - set this to your preferred retracement amount to customize your market structure to what you qualify as a valid pullback.
Elliott Wave ZigZag
Many people ask for the Elliott Waves. Well, here it is, inside this SMC. Just like your pivot highs and lows, the Elliott Wave is showing in real-time so you can see where your previous highs and lows are with the Elliott Wave break of structures that you can use in conjunction with the Smart Money Concepts Indicator of ArtiumPro.
Fib levels - for Premium & Discount areas - in this Instance the fib is used to determine if the price has pulled back into a premium or discount zone for optimal trade entry.
Trading Sessions
One of the most advanced trading session indicators out there and it’s included inside the most advanced SMC indicator on the market today. It has open breakout and settings to filter the opening range along with your pip daily range. You can select what timezone you are in and it automatically adjusts on the chart. Cool right? Hope you enjoy it, happy trading!
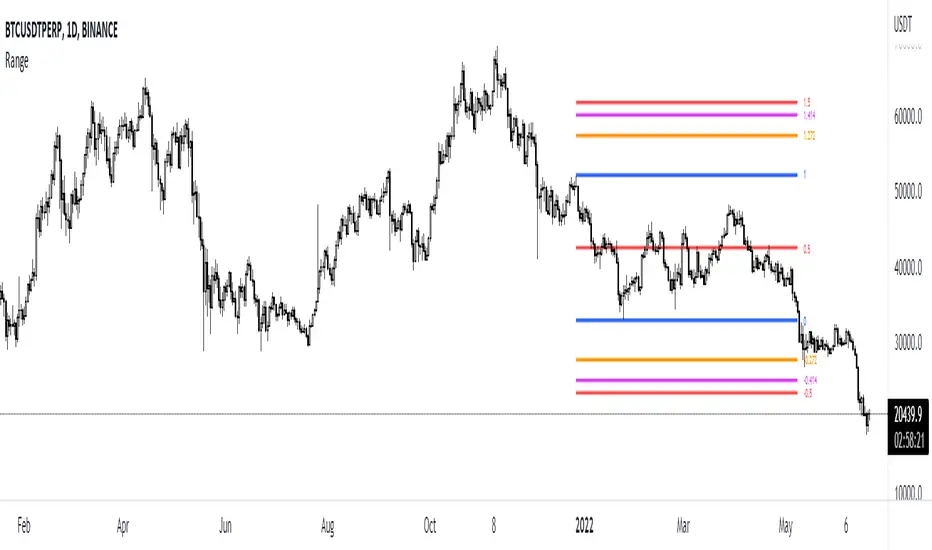
Range by EmreKbThis indicator shows the ranges and add fibonacci levels. Ranges are consolidate zones between two price. Some traders trade with ranges. This indicator for them. Also you can add alert when the range created.
Zigzag Lenght - A number for the zigzag calculation
Fib Level - Fib level for minimum second wave length
Maximum Deviation - Maximum Deviation for range breaked
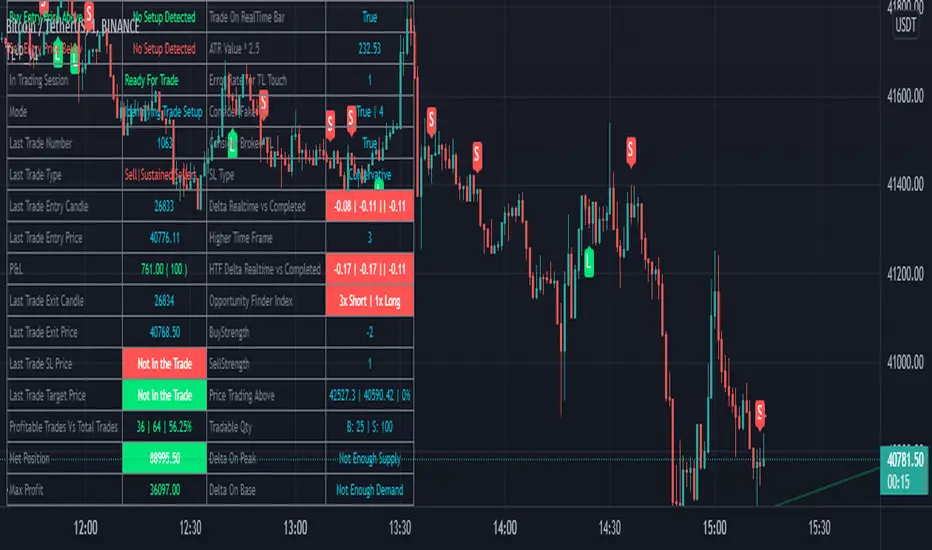
BreathEasy TrendLine Scalping - Pro Dear Traders,
Trendlines are the one particular word ever trader would definitely know what it is. But the way it gets applied on to the chart is the one thing which needs to debated on. Traders definitely love to trade Trendline breaks like the way I do.
When it comes to Trendlines , we generally categorize them based on the Major Trendline and Minor Trendline, however concept of Breakout or Breakdown of trendline wouldn’t change whether it’s a Major or Minor Trendline. Trendline is by nature powerful and prices do respect the same. In order to add more power, I have combined the Trendlines with Fibonacci to time the entries correctly.
What you can expect from this Indicator?
This indicator is mainly designed to work on the lower time frames (Intraday Indicator), between 1 minute TF to 5-minute TF or max 10 minute.
It is necessary that you use this indicator on a highly liquid instruments such that calculations are smooth. since, price gaps may affect the accuracy of the results.
Script detects & plots Trendlines, based on the Pivot Points found on the chart and helps you take trading decisions wisely.
What is the scope or idea behind developing this indicator?
1. Its majorly build to identify the Trendline breaks (Break Out and Break Down)
2. Identify, Trend line False Break.
3. Identify the possible consolidation zone and intimate about the Consolidation Break
4. Peak Buying | Selling Possibility when Prices does cross levels based on the fib ratios.
Couple of Additional info | Points to Understand | Point of Comfort zone
1. Provides Alerts when the event happens such as (Important Trendline has Broken, Consolidation zone is broken etc.) and places a dummy entry indication that Indicator took a trade with the SL and Target if any.
Note: All the entries plotted by this indicator are just DUMMY for your educational purpose only. you may seek support from your financial advisor before placing similar trades in real market.
2. Indicator Can constantly notify you on ever time SL is updated, if necessary to keep you aware of. I have adopted volatility-based SL such that, if prices move too quick and too far SL also will move quick and gives enough room for the price to play its role. If the prices tend to go flat SL acts flat. It can also help you lock in some profits when your PNL reaches certain level either by price or by percentage. (All options are customizable)
3. It also takes HTF information wherever necessary if the indicator needs some additional confirmations like Trendline zone in higher timeframe or fib level in HTF zone. You can certainly advice indicator to direct which HTF to use.
4. If the Script need Volume confirmation there are possible options provided for you to direct the indicator to refer the volume source. Like if you are trading BNF you may direct the volume source to its related futures
5. Options are provided to customize to Qty and Lot and based on the suggested option it plots dummy entries with suggested Qty to trade with.
6. You may set the Max loss level for each of the trade which you would like to risk so that Indicator detects the setups which are in close proximity to that level. It so happens it detects setup with max loss level of 7K and due to price fluctuations dummy entry may lose bit more than what was capped.
There are many additional options | information’s | suitable Notifications via Alerts provided. To give you enough information for your trading decisions along with Dummy Trades info.
IMPORTANT POINT TO CONSIDER:
REPAINTING : I use the word “real time data” in my indicator tooltip in conjunction and help you understand what indicator does. By this you can understand the impacts of the same.
I strongly recommend you read the tooltips in order to understand the indicator better.
Enjoy!
DISCLAIMER : No sharing, copying, reselling, modifying, or any other forms of use are authorized for our documents, script / strategy, and the information published with them. This informational planning script / strategy is strictly for individual use and educational purposes only. This is not financial or investment advice. Investments are always made at your own risk and are based on your personal judgement. I am not responsible for any losses you may incur. Please invest wisely.
Happy to receive suggestions and feedback in order to improve the performance of the indicator better.
Bitcoin Golden Bottom Oscillator (MZ BTC Oscillator)This indicator uses Elliot Wave Oscillator Methodology applied on "BTC Golden Bottom with Adaptive Moving Average" and Relative Strength Index of Resulted EVO to form an Oscillator to detect trend health in Bitcoin price. Ticker is set to "INDEX : BTCUSD" on 1D timeframe.
Methodology
Oscillator uses Adaptive Moving Average with 1 year of length, Minor length of 50 and Major length of 100 to mark AMA as Golden Bottom.
Percentage Elliot Wave Oscillator is calculated between BTC price and AMA.
Relative Strength Index of EVO is calculated to detect trend strength and divergence detection.
Hull Moving Average of resulted RSI is used to smoothen the Oscillator.
Oscillator is hard coded to 'INDEX:BTCUSD' ticker on 1d so it can be used on any other chart and on any other timeframe.
Color Schemes
Bright Red background color indicates that price has left top Fib multiple ATR band and possibly go for top.
Light Red background color indicates that price has left 2nd top Fib multiple ATR band and possibly go for local top.
Lime background color indicates that price has entered lowest band indicating local bottom.
Bright Green background color indicates that price is approximately resting on Golden Bottom i.e. AMA.
Oscillator color is set to gradient for easy directional adaption.
BTC Golden Bottom with Adaptive Moving Average

Reversal off EMA-XsEMA-Xs works mostly on Forex due to the small prices and price fluctuations. It does work on Gold, oddly enough, and some others like UKX 100...but mostly on forex. It doesn't work as well on JPY pairs but occasionally does; the JPY pairs give less signals, but when a JPY pair gives a signal, its a high probability setup. Another script EMA-XL works better on the higher priced instruments like S&P, DJI, OIL, BTC etc.
This script will show 3 moving averages: 13, 34, 200 and works on the 5m, 1hr, 4hr, daily charts. Signals "B" or "S" will be on the chart above or below the candles respectively.
When to open:
The script gives buy and sell signals based on a counter-trend move away from the MA's. When the price rises a specific percent above/below the EMA, it'll give a signal. It's best to take a trade when it gives a cluster of consecutive signals near the same price. If using on the 5m, definitely wait for consecutive signals. Also, use this in conjunction with support and resistance areas. Using with fibs for confirmation really makes this a good tool with high probability: IE, when price hits a fib and the script gives a signal, its a high probability setup.
When to close:
1. After a fast move up/down you may use this to counter trade a scalp 10+ pips, but you need to be quick; applies mostly to the 5m chart.
2. If you have the tenacity wait until you see an opposite signal. With this method you may be holding a loosing trade for a while. But what I've noticed is if it trends against you, price usually with come near to the first time it signaled. You may want to stack trades on each cluster of signals. IE first trade is 1000 units, next is 2000 units, etc... then close when prices comes near the first time it signaled. By this time, if you held, you should have profit. This strategy will really test your mental resilience.
3. Wait until it comes back to one of the trendlines; remember this is a counter trend signal so price is moving away from the MA and it always returns to touch one of the MA's...LOL eventually
4. Applying to scalping on the 5m, keep the stops tight because if the instrument trends hard and fast, you'll be upside-down quickly.
If you put a lot of time into using this signal generator, you can really make good profit. But with all tools, you need to master it. There are nuances to the simple logic of this script that can be both fun and frustrating. With all endeavors, if you put the time into it, you will reap the rewards.
Good luck and let me know if you have any questions/comments.

Support and Resistance Based Off Indicators V2Theory Behind It"
There have been hundreds of trading methods and theories that have been proposed by the trading community, each with a unique perspective on trading. One of the most popular theories is known as the Dow theory which was one of the first theories to theorise the concept known today as trends. Now the majority of today's trading strategies are based off the single concept known as "trends."
These concepts and theories have shaped many traders strategies and trading plans to this day. And with a new era of easy access trading, in which nearly anyone with a wifi connection, and computer, or smartphone an trade hundreds of markets brings a light to traders known as retail traders. Which according to Credit Suisse, have accounted for a third of all stock market activity in the United States at points this year. This means that Retail traders are now a community of “market players” that are knowledgeable investors who seek to learn and incorporate their own trading strategies into the market.
This newfound significance of retail traders in the market prompted me to consider a new concept, which I've dubbed the "retail theory." This theory combines the theory that intraday traders move market prices, and if we can figure out what the majority of these retail traders are doing, we can trade based on other traders rather than the actual financial instrument. This notion may be difficult to grasp, so let's break it down.
Let's say there are ten people who can pick any color from a bag. Out of the ten people, Yellow is the favorite colour of two people, blue is the favourite colour of one person, and red is the favourite colour of seven people. Let's pretend we had to bet on which colour the majority of those ten people would choose. While it's evident that we'd all bet on red to win because it's the most popular color, but how does this apply to the markets?
While traders, as we all know, use a variety of indicators to determine where to buy and sell. Some of the most popular indicators that majority of traders use are the moving averages, exponential moving averages, bollinger bands, fib levels, pivot points, vwap, etc. Now tt's impossible to say which indicators are preferred by the majority of traders, but if the majority of indicators align at a certain level, we may infer that the majority of traders will be looking to buy or sell at that level. This is where the indicators-based support and resistance indicator (I know, bad name, but I'm not that creative) comes into play. We can get a good indication of where the bulk of traders will be looking to add or sell by looking at the top indicators on the market and seeing if they are within range of each other. When this is combined with the basic theory of trends, we are able to gain a competitive advantage in the market that few traders have, known as an edge.
If you have any questions based on this theory let me know, but as I said before this theory is based on the concept that we are trading based off majority of what other traders think or are trading off of, not what we think
How It Works:
This indicator checks to see if other types of support and resistance indicators, such as the EMA, VWAP, FIb levels, and so on, are within range of one another. Simply put, when two indicators are within range of each other, a box will appear indicating where they are matching. The color of the box is determined by the number of indicators that line up within the same range, which can be adjusted with user input.
The user also has free range to change all input settings
How To Use:
This is a form of resistance and support indicator that should be used in conjunction with other technical tools. Each box color shows the number of indicators that are aligned with one another. A yellow box, for example, indicates that six or more indicators are within range of each other, but a white box indicates that only two indicators are within range of each other.
These boxes that appear should just be used as a type of support and resistance, but again you can see the strength of the support and resistance by the color.
Notes:
I came out with the concept version about a month ago, and since then it has been nothing but prefect for me. I found with 5 or more indicators line up within each other, then that area tends to be a key "dip buy" area for me. Also acts as a extremely powerful support or resistance if the indicator lines up with trendlines, or horizontal daily supports

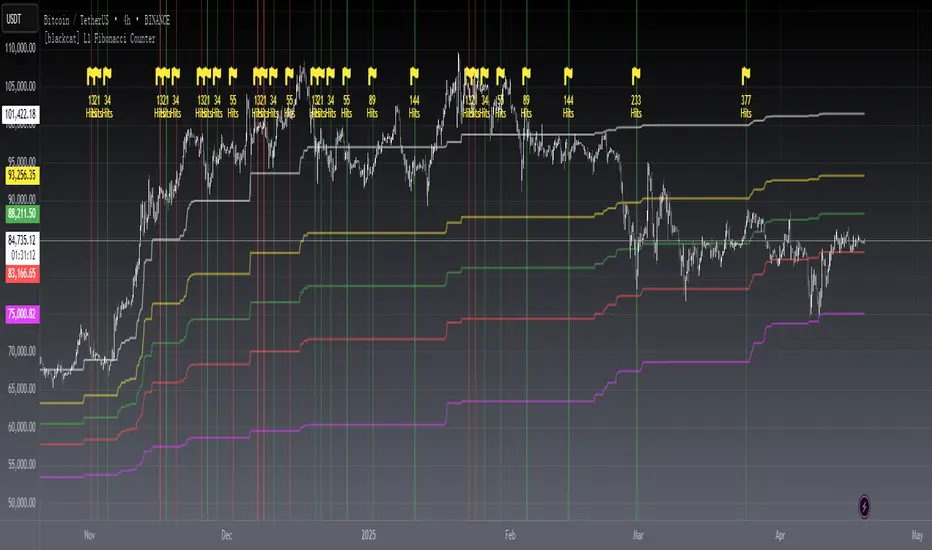
[blackcat] L1 Fibonacci CounterLevel: 1
Background
I believe that many traders must be familiar with the Fibonacci sequence. In live trading, we also use the Fibonacci sequence to predict the probability of a change in direction at an important stage of the market. , In the market analysis method, the Fibonacci sequence appears frequently.
Function
Drawing Fibonacci cycles manually is usually more labor-intensive. Here I tentatively implement a technical indicator that automatically draws Fibonacci time windows. It can automatically locate the high and low points of historical prices, and count them. When the period displayed by the counter is a Fibonacci number, it will be highlighted with a yellow background color and marked with the Fibonacci number. value.
Inputs
Counter Max Lookback --> Default 987.
Key Signal
Red bgcolor --> historical high with Fib hits
Green bgcolor --> historical low with Fib hits
Remarks
This is a Level 1 free and open source indicator.
Feedbacks are appreciated.
Key Levels Importer (blockFlow)Introduction
This script was inspired by the Chart Champions team who generously share the key levels that they are monitoring with the group.
It provides a way for TradingView users to import the levels from a text file (known as the “dataset”) which can also be shared with the community.
The script will plot the levels with different colours depending on whether they are daily, weekly, monthly. volume or fibs.
It will also calculate and draw the high/low for the previous day.
The dataset
The format for the dataset is as follows:
:=::
The type value can be:
D - Daily level
W - Weekly level
M- Monthly level
V - Volume level (eg. VAH, POC, VAL)
F - Fib level
Alternatively you can use freeform text for the type but it may not be colour-coded as you wish
Note, lines and fields without an “=“ are ignored.
Example dataset
:#BTCUSD
:
:---------------------------
:Daily levels
:---------------------------
:
:D=57220:
:D=47724:
:D=40711:
:D=38190:
:D=29775.5:
:
:---------------------------
:Weekly levels
:---------------------------
:
:W=65560.5:
:W=50776:
:W=43190:
:W=31773:
:
:---------------------------
:Monthly levels
:---------------------------
:
:M=61421.5:
:M=43800:
:M=35027:
:
:---------------------------
:Fib levels MTF/HTF
:---------------------------
:
:F=59693.5:
:F=58521.5:
:F=44180.5:
:F=42481.5:
:F=28773:
:F=25984:
:
:---------------------------
:Other levels
:---------------------------
:
:nPOC=47980.5:
:nPOC=48340:
:Global_VAH=63775:
:Global_POC=57364.5:
:Global_VAL=40217:
:MTF_POC=47174:
:MTF_POC=34125.5:
How to import the dataset
It is recommended to create the dataset with a text editor.
To import it:
Open the indicator settings
Click the ‘Import Dataset’ field, press Control-A and Delete to clear out the contents
Copy/paste the dataset into the field
Click Ok
Additional settings
You can choose the line colour for each type of level
Show imported datarows - Check this box to displays the imported dataset values in tabular format on the bottom-left of the chart
Show yellow dots - Show yellow diamonds when price touches a level - see alerting below.
Hide levels > N% from current price - Levels more than 20% away from the current price will be hidden if this box is checked. The percentage value can be changed.
Alerting
The script can raise alerts when the price touches any of the levels.
This is visually represented on the chart by a yellow dot when the "show yellow dots option" is checked.
To avoid duplicate alerts when price repeatedly touches the level, the following criteria must be satisfied before an alert is raised (or a yellow dot printed).
1) Price first touches the level (open,high,low or close)
2) Price did not touch the level in the previous 10 candles

Support and Resistance Based Off IndicatorsThis is a proof-of-concept indicator that combines several indicators to identify areas of support and resistance. This indicator is based on the theory that traders utilise a number of indicators to locate areas of support or resistance, such as moving averages, bollinger bands, fib levels, and so on. If the majority of indicators align at a given level, we know that the majority of traders will be seeking to buy in or sell at that level, but adding all of these indicators to your chart will take too much time and clutter your chart. With this indicator, you can see if your favorite indicators are in range of each other, and if they are, a box will be drawn showing the range that they are within
Please keep in mind that the indicator only supports MA, EMA, Bollinger Bands, Fib Levels, and VWAP with standard deviation. I intend to add a lot more indicators, but for now, this is simply a proof of concept indicator.
This is how it works:
This indicator use atr bands to determine whether or not other indicators are within range of one another. The user enters the ATR band range, and once that is done, the script finds the values of other indicators depending on the user's input and tests to see if they are inside the ATR band. If the indications align within the bands, a box is plotted. The colour of the box is determined by how many indicators line up within the same range, which can be changed with user input.
The user can also input if they would like to use that indicator or not, and input the timeframe it is on.
Notes:
This is only a proof of concept; I have many ambitions for this indicator, like adding other people's own indicators, cleaning up code, adding more functionality, and so on. Please let me know if you have any suggestions for additional indicators or if you have any comments. Also, given this took me months to create, I've opted to keep the code private for the time being, but I'd want to thank the Pine community for their assistance in making this indicator possible

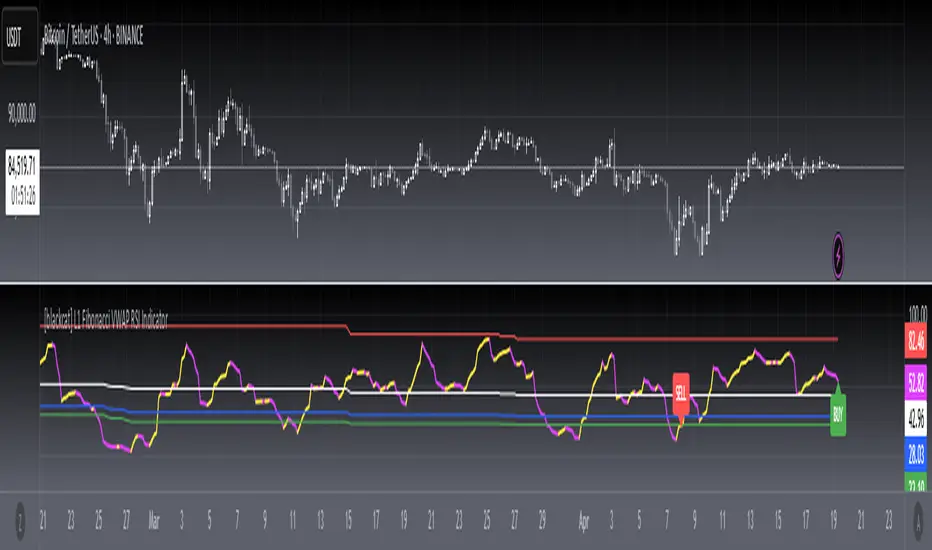
[blackcat] L1 Fibonacci VWAP RSI IndicatorLevel: 1
Background
Ingo Bucher proposed "Fibonacci RSI" in March,2003. It describes the advantages of considering Fibonacci retracement levels for use with the classic RSI indicator. Bucher reviews six charts, each displaying Fibonacci retracement levels for the RSI associated with each chart. The pine code given here will allow you to automatically recreate these charts for any security available in Tradingview. BTW, i enhanced it by changing RSI into VWAP RSI with hl2.
Function
For this Fib VWAP RSI indicator, it also applicable for original Bucher's fib concept. Bucher calculated his retracement levels by picking the RSI high and low for a given time window. In his examples, these were generally six months to a year's worth of data. Once the high and low were picked, he calculated retracement levels based on the well-known Fibonacci numbers (23.6%, 38.2%, 50%, 61.8%). This script here does the same thing. I use a "LookbackLength" (default: 400 bars), which represents a sliding data window that is used to determine the VWAP RSI high and low. The second input value controls the VWAP RSI period (default: 14 bars). The next three inputs select the retracement levels.
A total of eight different lines need to be drawn: the RSI itself, the 50% line, two retracements above the 50% point, two retracements below, and the zero and 100% lines. Pine script will create four plotlines per indicator, so I advise inserting the Fibonacci RSI twice. The first time it is inserted, leave the PlotRSI input with its default value, true. True tells pine script to plot the VWAP RSI itself. The second copy should have the input "Plot RSI" set to false. This will put the 50% line on your chart.
Inputs
LookbackLength --> Look Back Length.
RSILength --> RSI Length.
Fib1 and Fib2 --> Fibonacci lengths.
Key Signal
RawVWAPRSI --> Raw VWAP RSI output signal
Remarks
This is a Level 1 free and open source indicator.
Feedbacks are appreciated.
Ultimate ABC Indicator by @DaviddTechThis is the indicator version of my Ultimate ABC strategy we are looking for HH & LL to create an ABC pattern.
Shorts are defined by an ABC pattern.
Short:
* Starting with a low to a Higher High
* Breaking that trend to a new low
* Creating a new Higher High (FOMO HH)
* If the price breaks below the previous HH we have our entry.
Longs:
* Starting with a Hight to a Lower Low
* Breaking that trend to a new high
* Creating a new Lower Low (FOMO LL)
* If the price breaks above the previous LL we have our entry.
Stop loss just above or below the FOMO LL/HH.
Take Profit using a Fib or Risk to Reward.
Additional features :
* Add divergences for confluence MACD/RSI
* Auto Fib levels for taking profit.
WARNING:
- For purpose educate only - My mission is to debunk fake strategies with code to find THE ONE.
- Plots EMAs and other values on chart.
- This script to change bars colors.
If you have any questions or feedback, please let me know in the comments.

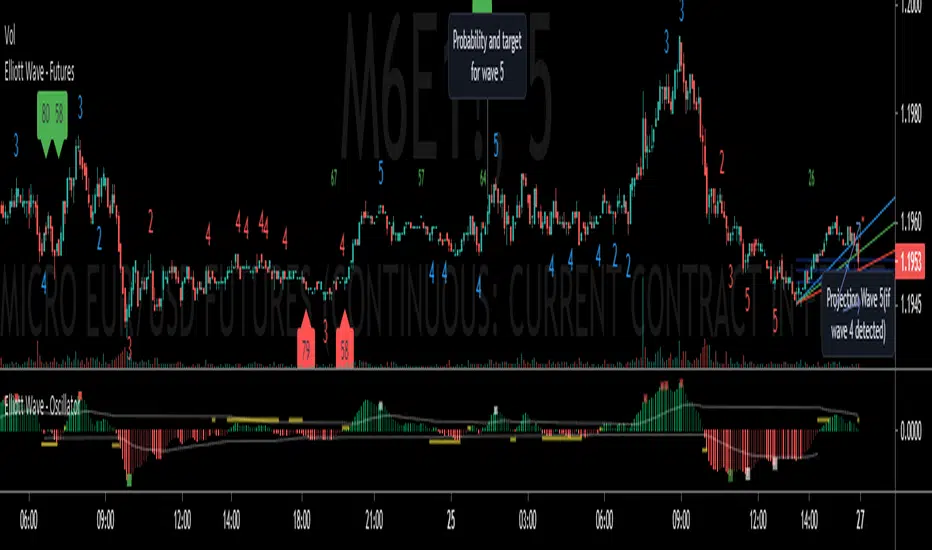
Elliott Wave - FuturesElliott Wave, indicating possible waves 2, 3, 4 and 5
Based on my Elliott Wave - Oscillator, this signals are converted into numbers displayed on chart:
Waves2, Waves3, Waves4, Waves5:
- Indicated on Chart with numbers
Fib fan Wave 4 retracement
- Blue, green and red lines for optimum retracement
Probability and target for wave 5
- Plotted when wave 4 is found
- Stays visible in chart
- Target is based on Daily Fibonnacci
- Probability: If current trend volume is bigger than previous opposite wave trend volume, probability is painted with color of trend background(for a trend to continue, value is recommended bigger than 35)
Projection Wave 4 (if wave 3 detected) and Projection Wave 5(if wave 4 detected)
- Only displayed when waves are active, else not displayed and not saved on chart
- For upside trend 2 blue target lines are displayed based on Daily Fibonnacci
- For downside trend 2 red target lines are displayed based on Daily Fibonnacci
REMINDER OF OSCILATOR USE:
Waves3: Indicated in RED Line(Upwards) and Green Line(Downwards)
- Detects wave greater than SMA
Waves4: Maximum height indicated in yellow Line
- Detects when wave greater than SMA (Wave 3 or 5) approaches wave 4 regression point
Waves5: Indicated in White Line
- Detects divergence in oscilator and price, meaning end of trend
Appreciate any suggestions, collaboration, comments or ideas.
Detects Waves 2, 3 , 4 and 5
Fib fan Wave 4 retracement
Probability and target for wave 5
Projection Wave 4 (if wave 3 detected)
Projection Wave 5(if wave 4 detected)
Alerts for Waves 2, 3, 4 and 5
Better and accurate targets for waves based on Futures
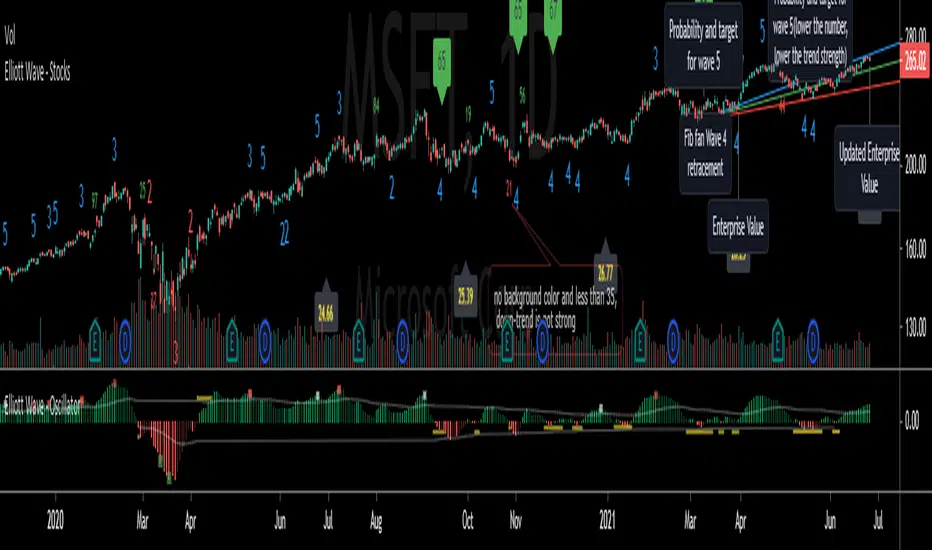
Elliott Wave - StocksElliott Wave, indicating possible waves 2, 3, 4 and 5
Based on my Elliott Wave - Oscillator, this signals are converted into numbers displayed on chart:
Waves2, Waves3, Waves4, Waves5:
- Indicated on Chart with numbers
Fib fan Wave 4 retracement
- Blue, green and red lines for optimum retracement
Probability and target for wave 5
- Plotted when wave 4 is found
- Stays visible in chart
- Target is based on Monthly Fibonnacci
- Probability: If current trend volume is bigger than previous opposite wave trend volume, probability is painted with color of trend background(for a trend to continue, value is recommended bigger than 35)
Projection Wave 4 (if wave 3 detected) and Projection Wave 5(if wave 4 detected)
- Only displayed when waves are active, else not displayed and not saved on chart
- For upside trend 2 blue target lines are displayed based on Monthly Fibonnacci
- For downside trend 2 red target lines are displayed based on Monthly Fibonnacci
Fundamentals: Enterprise Value
- Displayed when financial reports are updated to database
- Also displayed the latest calculated enterprise value with current stock price and last financial report
REMINDER OF OSCILATOR USE:
Waves3: Indicated in RED Line(Upwards) and Green Line(Downwards)
- Detects wave greater than SMA
Waves4: Maximum height indicated in yellow Line
- Detects when wave greater than SMA (Wave 3 or 5) approaches wave 4 regression point
Waves5: Indicated in White Line
- Detects divergence in oscilator and price, meaning end of trend
Appreciate any suggestions, collaboration, comments or ideas.
Detects Waves 2, 3 , 4 and 5
Fib fan Wave 4 retracement
Probability and target for wave 5
Projection Wave 4 (if wave 3 detected)
Projection Wave 5(if wave 4 detected)
Alerts for Waves 2, 3, 4 and 5
Fundamentals: Enterprise Value
Better and accurate targets for waves based on Stocks
TestedFX Pitchfork Intersections v1.4TestedFX Sexy Pitchfork Intersection Strategy Trading Rules:
All trades are 4R !! If you don’t understand this, please DO NOT TRADE until you have researched Risk to Reward ratios. Basically 4R means you win 4x your risk. Ie. SL = 25 pips and TP is 100 pips so you win 4x your risk.
AUTHOR’S NOTE: Statistically Pitchforks reach the median line 80% of the time. Yet they are the most overlooked and underused tool used by traders. Of course you will NOT get an 80% win rate with this strategy because we can never know for sure if price will bounce on a line or bust through.
WARNING: TRADE ON 4 HOUR OR HIGHER TIMEFRAME. Less than expert level traders should trade on 4 hour or higher time frames. Getting in and out of a trade will likely cost you 2 to 3 pips with spread and commission. This strategy produces precision entries which sounds good BUT on smaller time frames this will affect your average R significantly and eat up much of your profits. For example on a 15 min timeframe this strategy will often give you 6 or 7 pip SL. When you add 2 or 3 pips your Risk to Reward ratio will often be 3R instead of 4R. Our long term backtests show an average win of 1.3R when losses are factored in. So on a 15 min time frame you would only be left with 0.3R average win which is ok but not optimal. Inexperienced traders to this strategy will likely make mistakes which will eat up the rest of the profits. So please all new traders keep to the 4H or higher time frames and backtest a lot before you start trading.
1) Trade with the Pitchfork ONLY.
At least one line must be pushing in the direction of the trade. Breakouts tend to occur when multiple lines are facing the same direction.
2) Sexy Line Touch: Enter the trade when the sexy line is touched just outside a fib zone. A sexy line is a line just outside the fib rejection zone or outer line of a pitchfork. Price loves to reach out and touch or almost touch it before reversing which is your key to precision entries.
a) 3+ LINES: Only trade with 3+ confirmation lines.
b) EMPTY SPACE: Trade the outermost line. There should be no more sexy lines to touch nearby.
3) NO MESS
Don't trade when there are so many lines you can't see what is going on. The cost to not trade is exactly $0. So skip areas where trend direction is not clear and pitchforks are going in too many conflicting directions.
4) Set TP just past the next level.
5) Set SL at 4R.
Recommendations:
1) Once you lose on a pitchfork move on to the next pitchfork. In choppy markets I also apply this rule to wins since a long term trend is unlikely.
2) Search for trades using Andrew's Pitchforks in a trend. In consolidation search for trades using Modified-Schiff Pitchforks. Confirm trades by turning on both pitchforks momentarily to find sexy line touches.
3) Backtest, Backtest, Backtest !! This strategy isn’t for traders who want clear easy entries. Often multiple pitchforks give conflicting or overlapping signals. Practice to know when the market is too complex and you need to “Skip the Mess” takes practice. Also knowing how much "Empty Space" is enough takes practice too.

MA Strategy Emperor insiliconotThe Script offers 9 different EMAs with 14 different MA types.
The make use of the script is to find the entry on the 1-4 hour altcoins while using the in-built 13/21 crossover strategy to be used in sync with Heikin Ashi cross-over with Fib levels of 0.236 Fib level.
How to use it.
Entry is to be made when the
1. Cross over gives a P(Positive Sign) and the candle completely closes above the cross-over
2. When the Heikin Ashi turns green and the next green HA candle goes above the previous green HA candle.
3. The price should be at-least above the 0.236 Level from the Swing high.
All the Best.
EmperorBTC

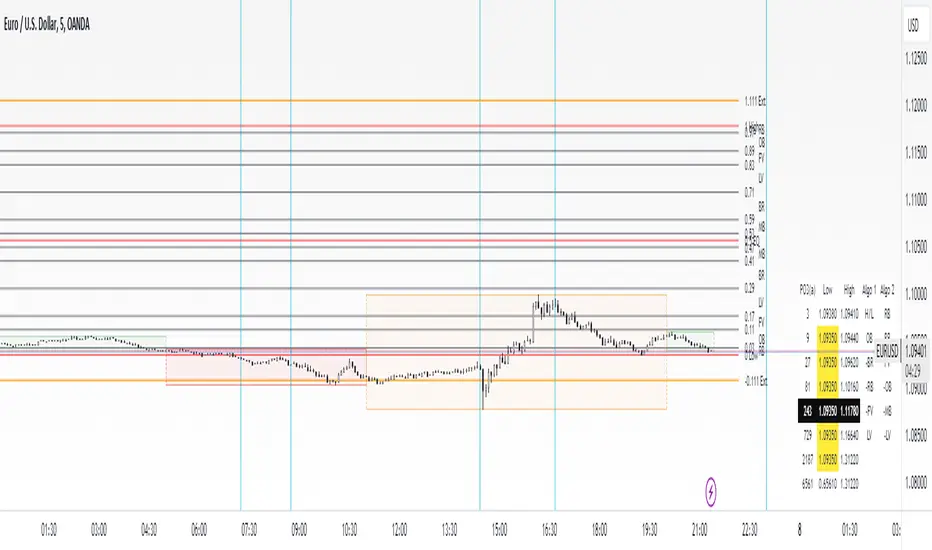
Fibonacci Extension / Retracement / Pivot Points by DGTFɪʙᴏɴᴀᴄᴄɪ Exᴛᴇɴᴛɪᴏɴ / Rᴇᴛʀᴀᴄᴍᴇɴᴛ / Pɪᴠᴏᴛ Pᴏɪɴᴛꜱ
This study combines various Fibonacci concepts into one, and some basic volume and volatility indications
█ Pɪᴠᴏᴛ Pᴏɪɴᴛꜱ — is a technical indicator that is used to determine the levels at which price may face support or resistance. The Pivot Points indicator consists of a pivot point (PP) level and several support (S) and resistance (R) levels. PP, resistance and support values are calculated in different ways, depending on the type of the indicator, this study implements Fibonacci Pivot Points
The indicator resolution is set by the input of the Pivot Points TF (Timeframe). If the Pivot Points TF is set to AUTO (the default value), then the increased resolution is determined by the following algorithm:
for intraday resolutions up to and including 5 min, 4HOURS (4H) is used
for intraday resolutions more than 5 min and up to and including 45 min, DAY (1D) is used
for intraday resolutions more than 45 min and up to and including 4 hour, WEEK (1W) is used
for daily resolutions MONTH is used (1M)
for weekly resolutions, 3-MONTH (3M) is used
for monthly resolutions, 12-MONTH (12M) is used
If the Pivot Points TF is set to User Defined, users may choose any higher timeframe of their preference
█ Fɪʙ Rᴇᴛʀᴀᴄᴇᴍᴇɴᴛ — Fibonacci retracements is a popular instrument used by technical analysts to determine support and resistance areas. In technical analysis, this tool is created by taking two extreme points (usually a peak and a trough) on the chart and dividing the vertical distance by the key Fibonacci coefficients equal to 23.6%, 38.2%, 50%, 61.8%, and 100%. This study implements an automated method of identifying the pivot lows/highs and automatically draws horizontal lines that are used to determine possible support and resistance levels
█ Fɪʙᴏɴᴀᴄᴄɪ Exᴛᴇɴꜱɪᴏɴꜱ — Fibonacci extensions are a tool that traders can use to establish profit targets or estimate how far a price may travel AFTER a retracement/pullback is finished. Extension levels are also possible areas where the price may reverse. This study implements an automated method of identifying the pivot lows/highs and automatically draws horizontal lines that are used to determine possible support and resistance levels.
IMPORTANT NOTE: Fibonacci extensions option may require to do further adjustment of the study parameters for proper usage. Extensions are aimed to be used when a trend is present and they aim to measure how far a price may travel AFTER a retracement/pullback. I will strongly suggest users of this study to check the education post for further details, where to use extensions and where to use retracements
Important input options for both Fibonacci Extensions and Retracements
Deviation, is a multiplier that affects how much the price should deviate from the previous pivot in order for the bar to become a new pivot. Increasing its value is one way to get higher timeframe Fib Retracement Levels
Depth, affects the minimum number of bars that will be taken into account when building
█ Volume / Volatility Add-Ons
High Volatile Bar Indication
Volume Spike Bar Indication
Volume Weighted Colored Bars
This study benefits from build-in auto fib retracement tv study and modifications applied to get extentions and also to fit this combo
Disclaimer:
Trading success is all about following your trading strategy and the indicators should fit within your trading strategy, and not to be traded upon solely
The script is for informational and educational purposes only. Use of the script does not constitute professional and/or financial advice. You alone have the sole responsibility of evaluating the script output and risks associated with the use of the script. In exchange for using the script, you agree not to hold dgtrd TradingView user liable for any possible claim for damages arising from any decision you make based on use of the script

Fibonacci levels alerted as Support and Resistance lvlsThis script is another Fibonacci script however this script gives select signals indicating when a resistance level is hit aswell as a support level.
A resistance level is calculated by price action failing to close or open above a fib level yet its high crossing the level. This essentially means price action was too weak to break this level.
The same goes for support levels where the price open and closes above the fib level yet the price low was below. This means the bears where unable to break the support level and may potentially rebound.
This script uses the 0.764, 0.618, 0.5, 0.382 and 0.236 levels. More can be added to script if asked.
From personal use I use the script to help guide the entry and exit for potential trades aswell as helping mark price targets and exit levels. However i never use this script alone and actively ensure it is used alongside other technical indicators.
Within the script there is also a plotted Fibonacci retracement chart which can help visually aid the trader.

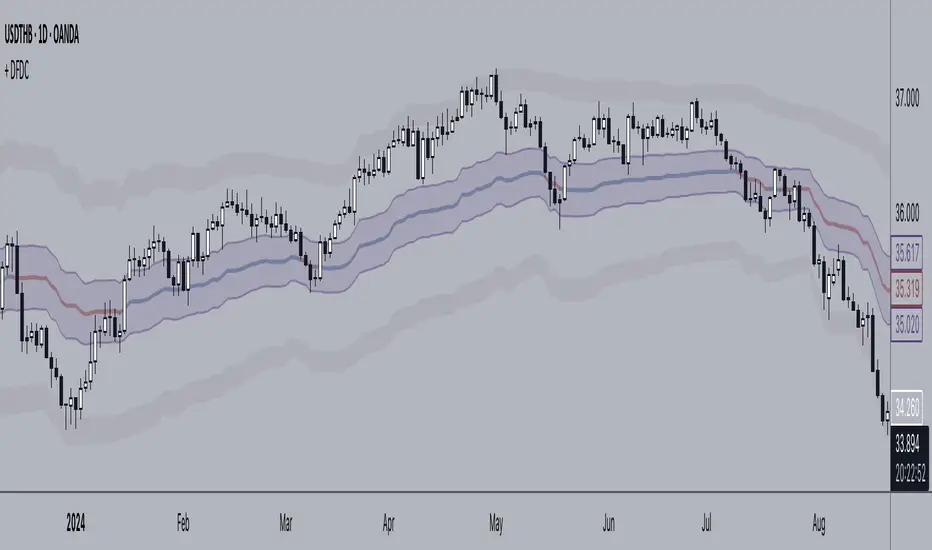
(Custom)Bollingers Bands Fibonacci ratiosThis is a modified Bollinger bands that uses EMA,with ATH to get a main average and then takes Standard Deviations by Fib ratios outwards. It is very useful for Entries and exits. I Typically use it to exit longs or shorts, entries are a bit harder. Generally the price will wick just barely or briefly into the end of one of the bands and then leave, it PINGs it and that is your exit. It is a little hard to predict in real time and set a Take profit at any exact point because it is always moving, but because it constantly adjust it is pretty damn accurate at nailing it. They sorta work at any timeframe, so its up to you, though for Crypto it doesnt do so well above 4hr because it can pump really hard or dump hard and super stretch the bands. Best numbers for the Average are Fib numbers. Stick to using 13, 21, and 34. 34 is my favorite and works best for me, But its up to you. Sometimes its benificial to use 34 on lower timeframes and maybe a smaller number on larger ones IE 21 or 2 or 4hr charts.
Once again it is up to you how to use it. I dont have credit for the original version of it. It is someone else's who I think modified another person's version lol. Ill try and find their name and post a comment though for who I took the original code from.

CvZone1388This is the true convection zones of the fib. The green and red show the retracement trend
-This fib doesn't have golden zone 61 nor the 38... we are looking for higher magnet areas in the market tp 1 50 tp 2 your 23 or 78
all credit to first script fib convection zone88
