RSI + FIB HH LL StopLoss Finder/Contrarian TradesThis indicator is a multi-timeframe indicator that works in any timeframe.
It takes a price reading of the highest or lowest bar in the past based on Fibonacci numbers and plots it.
In addition, the RSI smoothed by a 5-day moving average can be used to detect signs that previous highs or lows will be reached in advance.
This gives insight into determining stop-loss values or entering the market in a contrarian manner.
This is an example of BTCUSDT 4Hour Chart
Here is BTCUSDT 1Hour Chart
For scalpers BTCUSDT 15min Chart Example
Fibonacci Number is 1, 1, 2, 3, 5, 8, 13, 21, 34, 55, 89, 144, 233, 377, 610, 987, 1597, ...
FIbonacci Ratio is 0.236, 0.382, 0.5, 0.618, 1, 1.618, 2.618, 4.236, ...
Search in scripts for "fib"

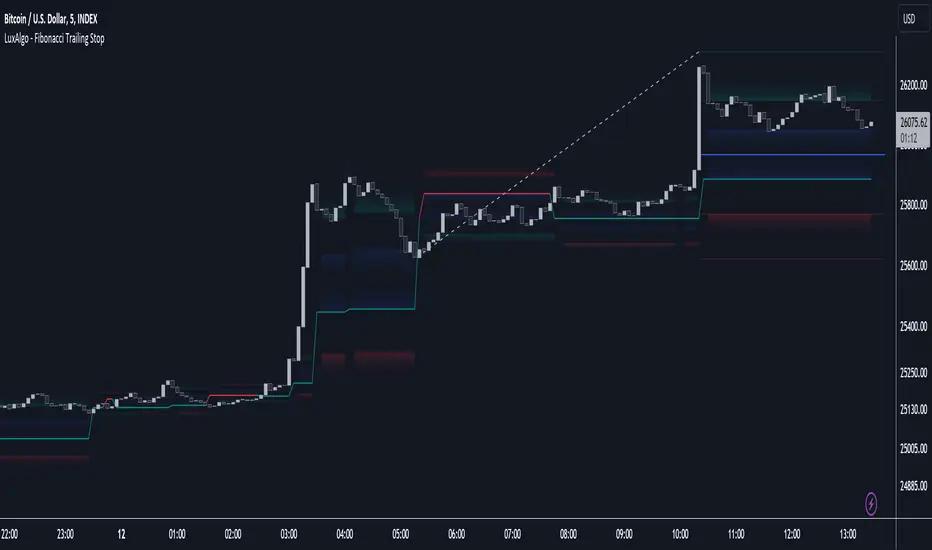
Fibonacci Trailing Stop [LuxAlgo]The Fibonacci Trailing Stop indicator creates a Trailing Stop, based on Fibonacci levels which are retrieved from the latest swing high & low . This provides a Trailing Stop-line .
🔶 USAGE
The Fibonacci Trailing Stop can indicate the current trend direction.
Shadows can also provide potential support/resistance areas.
Users can also display Fibonacci retracements.
🔶 CONCEPTS
🔹 Basic principles
There are 2 basic principles:
Every new swing will create or update a new Fibonacci pattern, potentially changing the Fibonacci Trailing Stop (FTS)
The Trend depends on whether the FTS is crossed/breached, the trigger is a chosen 'level/trigger'
(settings -> Fibonacci Trailing Stop -> Level/Trigger)
In an uptrend, these levels will be placed at the bottom half of the pattern.
In a downtrend, these levels will be placed at the top half of the pattern.
Once a trend is established, the Trailing Stop will only update in the direction of the trend:
Only higher when in an uptrend
Only lower when in a downtrend
If a Trailing Stop line is broken, the trend shifts to the other direction
The FTS line is accompanied by a secondary line (colour-filled), created by smaller swings (half of L/R, rounded to above)
EXAMPLES
• New bullish Trend/pattern
• Updating later on
• Bearish Trend -> breached -> New bullish Trend -> Trend is updated later on, and is breached at the end:
• Trend broken -> new Trend/direction:
• Bearish Trend -> breached -> New bullish Trend -> breached -> New bearish Trend (Here you see the latest cross of the bullish trend)
🔹 Shadows & latest Fibonacci
The indicator contains the option to show:
Latest Fibonacci
Shadows : previous Fibonacci Levels (will only appear after a 1 bar delay)
Shadows can be very useful to provide support/resistance areas, especially from large shadow-blocks .
When shadows are enabled, the color fill of Latest Fibonacci and FTS will be removed, this to provide less clutter:
🔶 SETTINGS
🔹 Swings
L: set left of pivothigh / pivotlow
R: set right of pivothigh / pivotlow
Swing labels: show labels of swings (updated in the same direction)
🔹 Fibonacci Trailing Stop
Level - Toggle - Custom value
• Choose pré-set levels [ -0.5, -0.382, -0.236 , 0, 0.236, 0.382, 0.5, 0.618 ]
• Choose custom level -> Toggle enabled and adjust the number at the right
Trigger: set trigger for breaching the FTS, close or wick (high in downtrend/low in uptrend)
🔹 Fibonacci
Latest Fibonacci: show Latest Fibonacci
Shadows: show Shadows
Max - min - ML - top/bottom GPThis script keeps track of historical max's and min's and calculates the midline and top/bottom GP fibs off that.
The way it calculates max/mins is unique as it's a two-step customizable process. In settings, there are two adjustable parameters; length and lookback.
The length parameter defines how many candles the max/min will be saved for. If the last recorded max/min happened longer than the length variable it will reset.
The lookback parameter comes into play when a max/min is reset. It simply looks back x candles and gets the new max/min from that

Doji TrenderDoji Trender searches multiple timeframes for candles where open and close are less than dojiPercent apart (default 0.025%), and plots the trends between them.
Experiment with dojiPercent to change the number of "dojis" detected. I will add doji sub-type indication if it appears to be meaningful.
By default, it plots the 5m (red), 15m (orange), 1h (yellow), 4h (green), and chart (cyan). If the chart timeframe is any of the configurable ones, the chart copy won't be drawn. (I might reverse that, so that cyan is always drawn.)
Since doji points are somewhat sparse, and the lookback is short (default 10), the EMA's make drastic corrections toward new indecision. (I'm not convinced the EMA's are useful and/or relevant.)
This works on any timeframe, but seems to work best on the 1D. (5m is somewhat irrelevant on the 1D, so there are tweaks to be made.)
Dojis from a timeframe are corrections to a doji trend from a higher timeframe.
Red corrects to orange, corrects to yellow, corrects to green.
If the chart timeframe is > 4h, the others will correct to cyan.
Otherwise, cyan will fit in-between the adjacent timeframes.
Multiple indecision candles within a short timespan forming sharp peaks indicate retests, backtests, rejections, and bounces off of support/resistance.
With a correct larger-timeframe channel, one would expect lower-timeframe indecision at/along typical levels.
Although the doji's have unpredictable wicks, the dots printed by this indicator do not. Matched with volume, they reveal the prices where the most violent battles between bulls and bears took place, and are likely to take place, again.
One could:
1) Put trends on the longest segments, then look for confluence along them, and/or near the intersections.
2) Use lower-timeframe doji trends to estimate the direction of the higher-timeframe doji trends, before they become detectable to Doji Trender. Confirm by looking for confluence where those trends intersect with horizontal support/resistance, this indicator, and/or others.
3) Notice that multiple legs on the same trend line are close to parallel, if not colinear.
4) Notice that many of the doji segments point toward (very-distant) future dojis.
5) Drop horizontal lines on the dots where we previously reversed, and find confluence in VRVP when we revisit them.
6) Create parallel (fib/whatever) channels that more-closely match MM's intent. The segments one uses to set the angle of the channel, and those used to align the channel, vertically, are not always the same:
a) Match the channel slope to as many doji slopes as possible, considering every trend.
b) Figure out where the channel actually belongs, re-considering every trend.

Fibo Levels with Volume Profile and Targets [ChartPrime]The Fib Levels With Volume Profile and Targets (FIVP) is a trading tool designed to provide traders with a unique understanding of price movement and trading volume through the lens of Fibonacci levels. This dynamic indicator merges the concepts of Fibonacci retracement levels with trading volume analytics to offer predictive insights into potential price trajectories.
Features:
1. Fibonacci Levels: The FPI showcases three prominent Fibonacci levels on both sides of the current price, offering an intricate picture of potential support and resistance levels.
2. Support and Resistance Recognition: Harnessing the power of Fibonacci levels, the FPI provides traders with potential areas of support and resistance, aiding in informed decision-making for entries, exits, and stop placements.
3. Customizable Timeframe Settings: In order to cater to different trading strategies and styles, users can manually select their preferred timeframe for the Fibonacci calculations, ensuring optimal relevance and accuracy for their trading approach.
4. Volume Analytics: One of the standout features of the FIVP is its ability to calculate trading volume for every bar that is sandwiched between the top and lower Fibonacci levels. This ensures traders have a clear vision of where the majority of trading activity is occurring, lending weight to the credibility of the displayed support and resistance zones.
5. Volume-Derived Price Targeting: The Possible Target Arrow function is an innovative feature. By analyzing and comparing the trading volume in the bearish and bullish zones, it provides an arrow indicating the potential direction the market might take. If the bull volume surpasses the bear volume, the market is likely skewing bullish and vice versa.
Usage
Ideal for both novice and seasoned traders, the FPI offers a rich tapestry of information. It allows for refined technical analysis, more precise entries and exits, and a holistic view of the interplay between price and trading volume. Whether you're scalping, day trading, or swing trading, the Fibonacci Profile Indicator is designed to enhance your trading strategy, providing a comprehensive perspective of the market's potential movements.

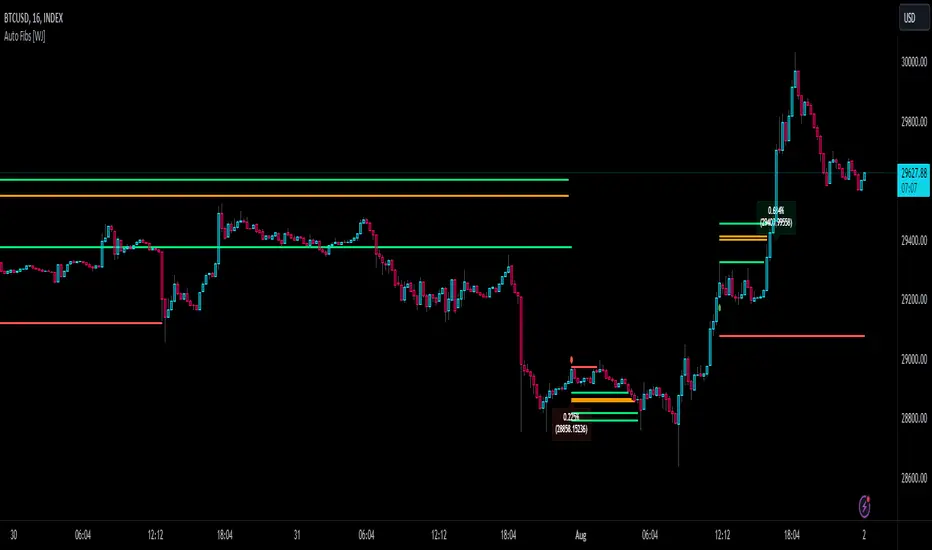
Auto Fibonacci TP Levels [WJ]This script automatically draws Fibonacci levels on a trading chart which are popular tools for traders seeking to identify potential areas of support and resistance.
Here are the features and benefits of this script:
1. Versatility in Sourcing Trade Entries:
Trade source can be customized to either longs (buying trades) or shorts (selling trades). The user has the flexibility to adjust their entry points based on their trading strategy.
Up to 2 sources can be used, expand if you wish.
As it is coded now, the source you have to pick from has to have a 'plot' that sends a (long) or (short) and is equal to 1 and 2 respectively.
Example: In the script you want to use for Long and Shorts, make a plot like this:
plot(LONG ? 1 : SHORT ? 2 : 0, title = "⭐ Outbound signal", display = display.none, editable = false)
The variable name of the LONG and SHORT needs to be the same as the one your code is using to indicate those trades.
2. Flexible Fibonacci Start Points:
The starting points for drawing Fibonacci levels can be customized for both longs and shorts.
3. Configurable Historical Data Length:
Users can adjust the number of historical bars to analyze for calculating higher highs (HH) and lower lows (LL).
4. Informative Labels and Lines:
The script can be configured to show the distance from the entry point to the 0.618 Fibonacci level (the so-called "golden ratio"). This helps traders to visualize the risk-reward ratio of their trades.
It indicates when a Fibonacci level was crossed which could signal a potential reversal.
It allows users to display the golden pocket levels only (0.618 and 0.65) or all the Fibonacci levels.
5. Customizable Fibonacci Levels and Colors:
Users can define their preferred Fibonacci levels and assign specific colors to each of these levels. This helps in identifying different levels quickly and intuitively.
The script also includes functionality for setting stop loss levels for short and long positions, which helps in risk management.
6. Clear Visualization of Crossing Levels:
If a trade crosses a specific Fibonacci level, the script draws lines indicating the crossing. This can help traders to identify potential breakout or reversal points.
7. Calculation of Fibonacci Boxes:
For each Fibonacci level, the script creates a box that indicates the level's range on the chart. This visual aid can help traders to better understand the price movement within these levels.
8. Customizable Labels:
The script provides percentage difference labels at each Fibonacci level, displaying the difference between the price at that level and the price at the 0 Fibonacci level. This can help users quickly understand the price change in terms of percentage at each level.
9. Performance Efficiency:
The script uses arrays to store and manage the Fibonacci levels and their associated colors. This approach enhances the performance of the script, especially when processing a large amount of data.
10. Adaptability:
This script automatically adapts to market movements. When the price crosses a level, it identifies and records this event, aiding the trader's decision-making process.
Overall, this script is highly customizable, adaptable and provides a clear visual representation of important trading data, making it an effective tool for traders using Fibonacci levels in their strategies.
NOTE: If you can't see the fib lines, it is because they have already been triggered/touched by a candle and they are set to not continue after they are touched.
ICT Playbook by dokterfuseFEATURES
- New York daily ranges high to low
- 08-12 UTC-5 Time Window Highlighted
- New York day of week divider
- Weekly high/low + EQ
- TGIF
- Monday & Thursday range extended
- Weekly open
- Midnight open
- Previous daily range percentiles (fib)
- 5 ADR
PURPOSE INDICATOR & UNIQUENESS
The concepts used in this indicator are widely variated from teachings by 'The Inner Circle Trader' the purpose of this indicator is to give the 'ICT community' the
resourse to automate the visualization of the daily ranges in New York Time. The highs and lows from 00:00 - 00:00 [New York Time) will be horizontally plotted along
with vertical daily dividers. The indicator solves the struggle of having Tradingview's editor's 'normal' daily highs and lows which opens at 05.00 PM New York Time.
The indicator has flexible settings, so you can enable/disable whatever feature you'd like to have displayed. There is no other indicator which will give you the
daily range in New York Time. The previous daily range percentiles in new york time are the 25%, 50%, and 75% levels measured from the previous daily range
high and low , they are extended to the current day, this to measure whether price is in a premium or discount, and to converge it with PD Array's.
This feature alone, is nowhere to be seen... The concept of dividing daily ranges starting from 00.00 New York Time brought by ICT, can open a whole new world to
reading price action. This indicator enables it to plot these levels out automatically, without worrying about the 'normal daily open' at 05.00 PM New York Time.
The other features in the indicator such as TGIF, Weekly Range, 5ADR, Midnight Open, and more are mainly build to give you an intraweek perspective about
the behaviour of price action during specific times and 'time' levels, such as the opening price at midnight or the previous daily equilibrium .
TIMEFRAME & MARKETS
Since this indicator is made with the purpose of giving you an intra-week perspective, the author of this script would advice you to use anything in between
the '15m-1h' timeframe. The indicator is made mainly for Forex Pairs, however feel free to use it on other markets too.
WHAT IS NOT THE PURPOSE OF THIS INDICATOR
As the name tells you 'ICT Playbook'; it's a playbook of concepts by ICT for you to 'play around' with, so for study and educational purposes. This indicator IS NOT
a trading system, or a signal provider. Nor is it a roadmap of what's happening to the markets... Without a background in ICT his lectures, you won't have any idea
what kind of value this indicator provides. You will only understand this indicator if you are an intermediate ICT student.
FEATURES INSTRUCTION
1. New York Daily Ranges: This feature will plot 2 horizontal lines each day starting from 00.00 , 1 placed at the low and 1 placed at the high.
It will also plot vertical dividers in between. The line color and style are adjustable in the settings.
2. Time Window: This feature will plot a colored and transparent background to highlight the 08:00-12:00 New York Time window, which is often a time window
where a lot of volume enters the market. The 8.30-9.30 is extra highlighted, cause of the news embargo's and equities open will often bring 'Manipulation'.
3. New York Day of Week Divider: Will plot the names of the days above the chart
4. Weekly high/low + EQ: This feature will plot the current low and high of the week. Also, it will plot the EQ, which stands for the 'Equilibrium' of the weekly range
.
5. TGIF: 'Thank God It's Friday'; a concept of ICT where if we had consecutive up-days/down-days it will plot the 20%-30% of the weekly range .
6. Monday + Thursday Range Extended: ICT explained algorithmic principles coupled to these days. For example: "In a bullish week we can use Monday's high as support".
7. Weekly Open: Opening price of the weekly candle.
8. Midnight Open: Opening price of New York Midnight / True Day Open.
9. Previous Daily Range Percentiles: 25%, 50%, and 75% levels extended of the previous daily range .
10. ADR: 'Average Daily Range', the average range of 5 daily candles, the current daily range, and the previous daily range plotted in a table.
AUTHOR
This script is created by dokterfuse for the ICT community to make their tradingview experience easier. I'd like to give credits to ICT for his concepts used in this script.
TERMS & CONDITIONS
The indicator is only created for educational purposes, the script does not take any responsibility for the user's decisions in the markets. When using the tool,
you're agreeing to the 'Terms & Conditions'.
FUTURE UPDATES & BUGS
The script will be maintained and updated after the public release. Bugs and Ideas can be suggested in the comments.

Higher Fibonacci EMAOverall image:
If the closing price is higher than the three Fibonacci EMAs (uptrend):
Thanks to @ZenAndTheArtOfTrading and his indicator "Higher Timeframe EMA", URL =
This is a trend-discriminating indicator that uses 3 EMAs.
The Williams Alligator is the underlying philosophy, and we have applied it to capture the larger trend.
It is set up for the current time frame + 2 higher time frames.
One of the upper time legs has a daily EMA length of 13 Fibonacci numbers.
The top-level time leg has a weekly EMA with a length of 5 Fibonacci.
If the current closing price of the ticker leg is higher than these three EMAs, the bar color will be green. If it is lower, it will be red. If it is neither, it will be gray.
If the bar color is green, it suggests that the trend is upward. If it is red, you can consider entering short. If it is gray, it is best not to enter anything.

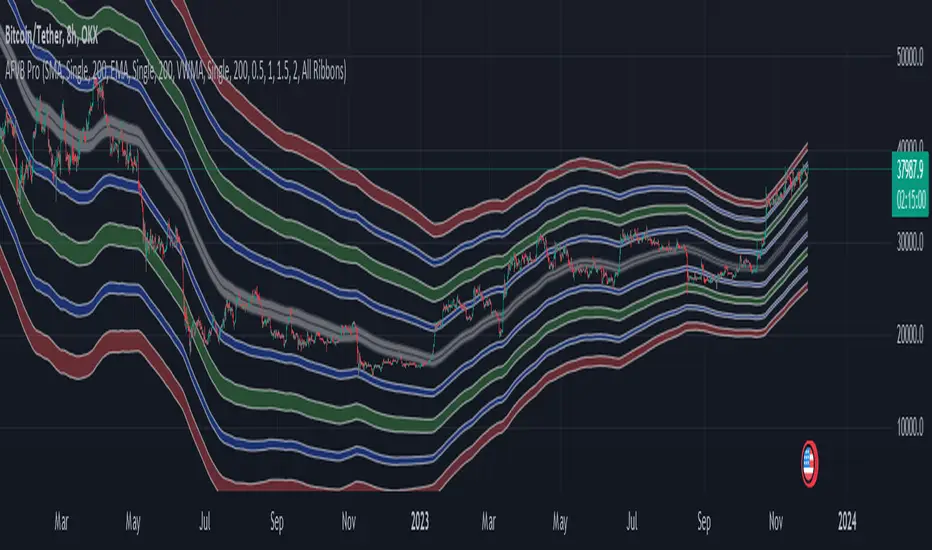
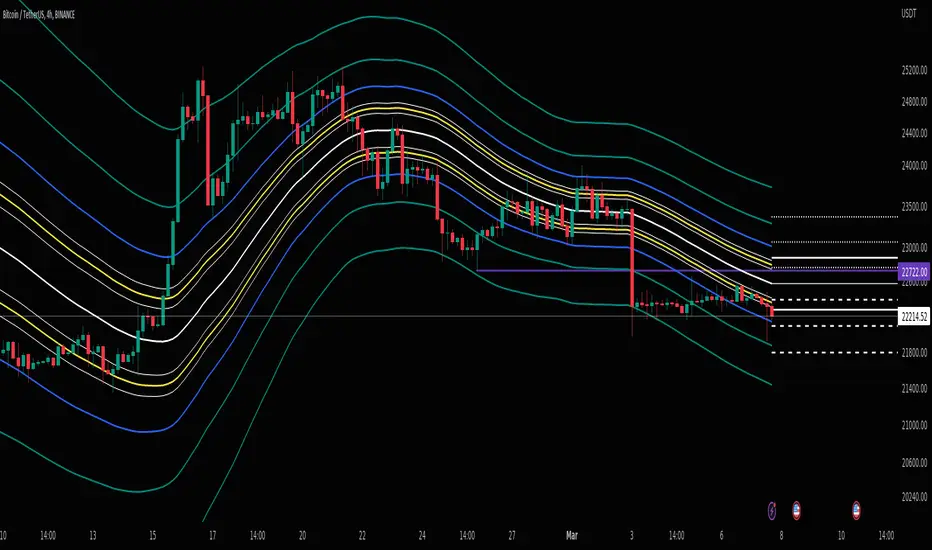
Apeiron Fair Value BandsThe Apeiron Fair Value Bands take into account a given MA and determine a Fair Value Area (FVA) for the price of a certain asset. The script plots a MA and a tolerance ribbon for it, as well as 2 bands (preset to 1 Standard deviations and 2 Standard deviations respectively, which can be manually changed) with a tolerance ribbon as well.
This creates 3 areas of interest:
The MA ribbon
The inside of the first upper and lower band (1 standard deviation) where price should stay within around 68% percent of the time according to the normal distribution
The inside of the second upper and lower band (2 standard deviations) where price should stay within around 95% percent of the time according to the normal distribution
Taking this into account, Fair Value analysis can be done:
Premium and Discount Prices: From a very simplistic point of view, when price is below a MA it can be considered to be at a discount and when it is above at a premium. Combining that idea with the levels given by the bands, we can determine if we are buying at premium or at a discount, specially on HTF and when considering investing, thus allowing to enter or exit the market with a higher probability of being on the right side of the trend and at a good level. As seen on the example, buying or selling at the highlighted levels would have been profitable with little drawdown.
VAH & VAL: (1 Standard Deviation Bands) Same as a Market Profile, price will stay in here "most" of the time. And particularly during ranging periods, they will provide potential revesal levels. As well, once prices breaks out of it, depending of the reaction to the second band, we can consider it a deviation or the beggining of a new trend. During strong trends, the bands can also serve as a correction support as the MA would do
New Fair Vaue Range: Once a new trend has begun, it will often slide on or break through Band 2, which can be interpreted as price creating a new Fair Value Range low or high. As seen on the chart, once price breaks out, those levels tend to be respected and relevant during corrections. I must make it very clear that this is just an analytical feature meant to be used in confluence with S/R, Supply & Demand, FVGs, Fibs or others. While it can be accurate sometimes, it might not be other times and be only "close".
Exhaustions: I call exhaustions to the scenarios when price keeps going up/down but it fails to keep pushing the fair value area with it. This indicates weakness in the trend and a potential reversal or correction. These appear on all Timeframes and symbols and are very good indications of tops and bottoms, specially after strong rallies or crashes. In the latter cases, waiting for price to re-enter it's FVA, provides great entries at the Bands levels.
Other features / Suggested Uses:
Middle levels: On the setup menu you can select different Standard deviation settings for each band including: 0.5, 1, 1.5, 2, 2.5 and 3. While the most relevant settings are 1 & 2, having their middle levels on the chart can provide extra levels for very tight ranges or just in general potential reversal levels.
Multi Timeframe & Multi symbol: The bands work on very low TF as well as High TF, though on HTF it might be limited by the MA length settings and the historical data of the symbol. It is important to note that each symbol and market type will have its own ideal MA and Bands settings.
Multi Bands Confluence: Same as you would use a short and long MA in a single setup, you can do the same with the bands and the confluence of levels can be very accurate.
Multi Timeframe Confluence: One of the best ways to use the bands so far is by using it in confluence with itself in other TFs, when price moves sharply into a confluent level given by multiple TFs, it is more likely for price to reverse there.
Most of the examples show a 200 SMA, but depending on what and how you are trading a shorter or longer MA might be a better fit for you. As well, if you are trading ranges, a VWMA might be much better, and if you are following a trend the EMA could be the better option.
I also want to make it clear that the bands can but are NOT meant to be a standalone indicator. They are meant to be used for confluence with other strategies, systems or indicators.
Dynamic Trailing Support & ResistanceDynamic Trailing Support & Resistance (DTSR) :
Hello Traders !!
DTSR is an objective dynamic support and resistance zone channel, Unlike subjective technical analysis DTSR finds S&R zones by calculating a range threshold within a given range over a specified lookback. FIB (Fibonacci) 38.2% and 61.8% retracement zones are also plotted for intermediate zones of resistance / support within the main resistance / support zones.
Plots
▾ <=> Close or high >= Trailing Resistance
▴ <=> Close or low <= Trailing Support
HH = The Highest High over the given Lookback period
LL = Lowest Low over the given Lookback period
Proximal Lines = The trailing S&R zones over the given lookback
Distal Lines = The HH or LL over the given lookback
DTSR Formula
note : This idea is not original to me, and was inspired by another creators work

Dual Dynamic Fibonacci Retracement — Long and Short Duration
Title : "The Dual-Dynamic Fibonacci Retracement Script: An Advanced Tool for Comprehensive Market Analysis"
As the author of the "Dual-Dynamic Fibonacci Retracement Script", I am delighted to introduce you to this cutting-edge tool for technical analysis. Unlike conventional Fibonacci scripts, this advanced model incorporates multiple unique features and adjustments that make it a powerful asset for any market analyst. Whether you're dealing with forex, commodities, equities or any other market, this script is versatile enough to enhance your trading strategy.
Uniqueness & Differentiation:
The "Dual-Dynamic Fibonacci Script" stands out by offering two distinct lookback periods. This feature is what separates it from other scripts available in the market. The first lookback period is longer, focusing on capturing broader market trends. The second lookback period is shorter, allowing for a more granular analysis of near-term market fluctuations. This dual perspective provides a more comprehensive view of the market, allowing you to see both the forest and the trees at the same time.
Fibonacci Levels:
While offering the standard Fibonacci retracement levels (0.236, 0.382, 0.5, 0.618, 0.786, and 1.0), the script also gives you the ability to plot 0.114 and 0.886 levels. These additional levels offer an extra layer of depth to your analysis, and can prove crucial in high-volatility markets where they often serve as significant support and resistance points.
Customizable Line Shifts and Extends:
This script provides options for customization of the shift and extension of the plotted lines. This means you can adjust the start and end points of the Fibonacci lines according to your personal trading style and strategy. This level of personalization is not typically available in other scripts, and it allows for a more tailored visual representation.
Flexible Trading Positioning:
Depending on whether the closing price is above or below the midpoint of the pivot high and pivot low, the Fibonacci retracement levels are adjusted accordingly. This ensures the script remains relevant and useful regardless of market conditions.
Clean Visualization:
To prevent clutter and maintain focus on the most relevant price action, the script removes old Fibonacci lines and plots new ones once a new pivot high or low is identified. This clean visualization helps keep your analysis focused and sharp.
How to Use the Script:
To get started, simply adjust the lookback periods according to your trading strategy. If you're a long-term investor or prefer swing trading, a longer lookback period might be appropriate. Conversely, if you're a day trader, a shorter lookback period might be more beneficial.
The "Shift" and "Extend" inputs allow you to control the positioning of the Fibonacci lines on your chart. Positive values shift the lines to the right, while negative values shift them to the left.
You also have the choice to plot the additional Fibonacci levels (0.114 and 0.886) via the "Plot 0.114 and 0.886 levels?" input. Similarly, the "Plot second set of levels?" input lets you decide whether to display the second set of Fibonacci levels derived from the shorter lookback period.
Like any technical analysis tool, this script is most effective when used in conjunction with other indicators and methods of analysis. It is designed to work well in trending markets, where Fibonacci retracements can often indicate potential reversal levels. However, it's always recommended to use a holistic approach to market analysis to maximize the likelihood of successful trades.
Note: the two lines drawn on the chart are there to help the user identify the levels from which the two respective Fib sequences are calculated.
~~~
Input Explanations:
Long Period Pivot High/Low Lookback and Short Period Pivot High/Low Lookback : These settings determine the length of the lookback periods for the long-term and short-term pivot points, respectively. A pivot point is a technical analysis indicator used to determine the overall trend of the market over different time frames. The pivot points are then used to calculate the Fibonacci levels. A longer lookback period will identify pivot points over a broader time frame, capturing major market trends, while a shorter lookback period will identify pivot points over a narrower time frame, capturing more immediate market movements.
Long Period Fibonacci Level Shift and Short Period Fibonacci Level Shift : These inputs control the shift of the Fibonacci levels based on the long and short lookback periods, respectively. If you want to shift the Fibonacci levels to the right, increase the value. If you want to shift the Fibonacci levels to the left, decrease the value. This allows you to adjust the Fibonacci levels to better align with your analysis.
Long Period Fibonacci Level Extend and Short Period Fibonacci Level Extend : These inputs control the extension of the Fibonacci levels based on the long and short lookback periods, respectively. If you want the Fibonacci levels to extend further to the right, increase the value. If you want the Fibonacci levels to extend less to the right, decrease the value. This feature provides the flexibility to adjust the length of the Fibonacci levels according to your personal trading preferences and strategy.
Plot 0.114 and 0.886 levels? : This setting gives you the ability to plot the additional 0.114 and 0.886 Fibonacci levels. These levels provide extra depth to your analysis, particularly in highly volatile markets where they can act as significant support and resistance levels.
Plot second set of levels? : This input allows you to decide whether to plot the second set of Fibonacci levels based on the short lookback period. Displaying this second set of levels can provide a more granular view of market movements and potential reversal points, enhancing your overall analysis.

LeafAlgo ProThis indicator utilizes signals generated from a normalized consensus of one of the four following consensus strategies: Oscillator Consensus, Moving Average Consensus, Democratic Fib Consensus, and an Ichimoku Cloud Consensus. When the values of the individual consensus are normalized, they can be utilized as an oscillator with a range of 0-100. The range of 0-100 can be broken down into zones where if the oscillator breaks through the different thresholds and meets the directional filter requirements, a signal is generated for strong buy, buy, sell, and strong sell with respect to which underlying threshold is breached.
Oscillator:
The Oscillator setting consists of the Average Directional Index (ADX) set as a value instead of +/- and is not used in the scoring to gather consensus. Rather, a value of 25 or above is used to confirm the trend regardless of positive or negative. The Chande Momentum Oscillator (CMO), Detrended Price Oscillator (DPO), Momentum, Rate of Change (ROC), Relative Strength Index (RSI), True Strength Index (TSI), and Volume Oscillator are used in the Oscillator table for a consensus value and given a + or - depending on the condition being met. The conditions and weighting are as follows:
-- CMO > or < 0, given a weight of +/- 2
-- DPO > or < 0, given a weight of +/- 2
-- Momentum > or < 0, given a weight of +/- 2
-- ROC > or < 0, given a weight of +/- 2
-- RSI > or < 50, given a weight of +/- 1
-- TSI Value Line > or < 0, given a weight of +/- 1
-- TSI Signal Line > or < 0, given a weight of +/- 1
-- Volume Osc. > or < 0, given a weight of +/- 2
Moving Average:
For the Moving Average Ribbon/Multi-MA setting the user is able to determine the type of MA for 11 moving averages. The type selection consists of EMA, DEMA, TEMA, SMA, RMA, VWMA, WMA, SMMA, and a Hull MA. The preset values for the 11 moving averages are 5, 7, 10, 14, 21, 26, 50, 75, 100, 150, and 200. The consensus conditions and weighting are as follows:
-- If MA(1 through 10) < or > the price source, given a weight of +/- 1
-- If MA(11) < or > the price source, given a weight of +/- 2
DFMA:
The Democratic Fibonacci Moving Average setting is derived from our indicator of the same name. The source for the DFMA can be chosen by the user, but the SMA lengths are predetermined in Fibonacci intervals from 3 to 233. The DFMA line itself is determined by finding the average value of these 10 Fibonacci MA lengths. The consensus conditions and weighting are as follows:
-- If Fib. MA (3-233) < or > the source, given a weight of +/- 1
-- If DFMA value < or > the source, given a weight of +/- 2.
Ichimoku:
The Ichimoku setting values a handful of conditions using the Tenkan-sen/Conversion Line, Kijun-sen/Base Line, Senkou-span A and B, and the Chikou-span, each of which are given their standard values of 9, 26, 52, and 26, respectively, but can be changed in the user settings if desired. As opposed to the other tables, there are fewer conditions to be met and given values to. All of the conditions are given the same weighting (+/- 1). The conditions are as follows:
-- Kijun-sen < or > the source
-- Tenkan-sen < or > the source
-- Kijun-sen > or < the Chikou-span
-- Tenkan-sen > or < the Kijou-sen
-- Senkou Span A > or < Senkou Span B
Dynamic Bar Coloring
The bar coloring is based on the values of the underlying consensus oscillator.
-- If the consensus value >= 75 coloring= "Lime"
-- If the consensus value is between 55 and 70, coloring= "Green"
-- If the consensus value is between 45 and 55, coloring= "Yellow"
-- If the consensus value is between 30 and 45, coloring= "Orange"
-- If consensus value is <= 30, coloring= "Red"
Regression Channels
The visible channel utilizes a basis line of a quadratic regression line. The quadratic regression is well suited for determining (and predicting) trends. Calculating the regression involves five summation equations that utilize the bar index (x1), the price source (defaulted to ohlc4), the desired length, and the square of x1. Determining the coefficient values requires an additional step that factors in the simple moving average of the source, bar index, and squared bar index. The envelopes that are formed around the regression line are a multiple of that regression line using the high/low range of the price. This envelope can be used to determine points of interest where the price may break through, consolidate at, or reverse from. The channels should be used in conjunction with the signals generated to determine if the signal is valid.
Note past performance is not indicative of future results. This is meant to be used as a tool, and the signals generated by this script should be confirmed with other technical analysis.

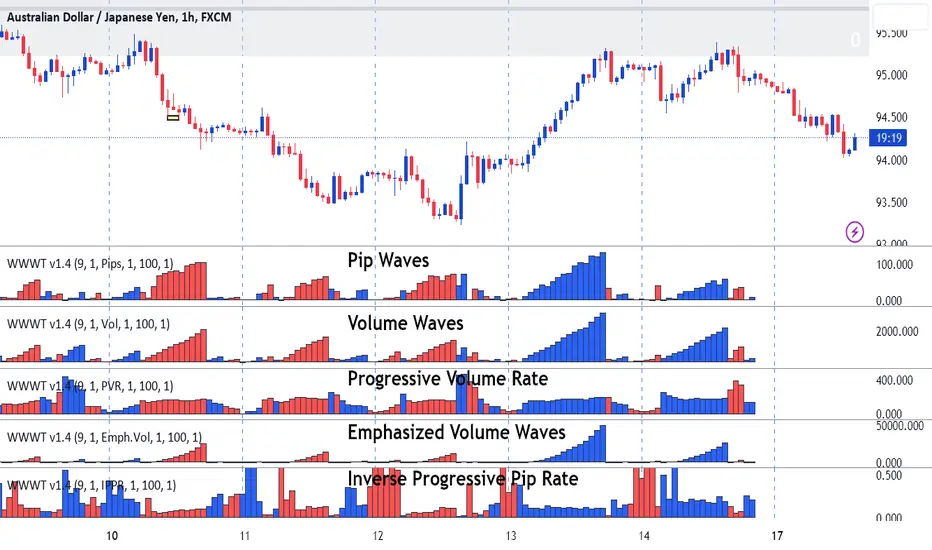
Weis Wave-Wave TypesWeis Wave - Waves Types indicator
The Concept
This indicator has been created based on David's Weis theory of cumulative volume histograms but this indicator has been enhanced with additional wave types to be able to identify the following:
Visually identify the Effort vs Result concept (too much volume but small pip move or small volume too large pip move). Imbalance of Supply and Demand.
Be able to monitor how volume progresses within the wave, if it is increasing, decreasing or staying steady.
Identify easily the large volume waves using the emphasized volume algorithm to analyze the price reaction afterwards following the theory that Institutions participate on large volumes
What it does
This indicator draws cumulative histograms of 5 different wave types. Up swing histogram is when price goes up and down swing histogram is when price goes down. It adds the volume of each bar within the wave swing, it adds the pips of each bar within the wave swing , it adds the time of each bar within the wave swing, it measures if the volume rate is increasing or decreasing within the wave swing and emphasizes on larger volume volume waves by increasing their size for visual purposes.
How it does it
The length of each cumulative histogram is equal to each wave price swing. The price wave sensitivity can be adjusted by AutoSensitivity parameter (min value =2 and max value=11). The larger the number the more sensitive it is, which means more wave swings will be created. The selectable values for the wave type are: Volume, Pips, Time, Progressive Volume Rate or Emphasized Volume. Furthermore the width of the cumulative histogram bars can be adjusted as well as the color of the up and the down swings. Finally divider input values are available for volume and pip to decrease large numbers on the y-axis of the histograms.
Wave Type Detailed Explanation
Volume: the indicator adds the volume of each bar within the price wave swing and creates a cumulative histogram
Pips: the indicator adds the bar distance from open to close and creates a cumulative histogram of the net pip movement of the price swing
Time: adds the time of each bar within the price wave swing and creates a cumulative histogram
Progressive Volume Rate (PVR): measures the volume rate within each wave (if volume is increasing or decreasing or staying steady as the wave progresses)
Emphasized Volume: the indicator adds the volume of each bar within the price wave swing and creates a cumulative histogram but contains an algorithm that emphasizes the large waves.
How to Use
Draw Support/Resistance and Fib - Monitor carefully the cumulative histograms at these levels. Usually supply and demand imbalance happens at this level.
First and most important of all adjust AutoSesnsitivity to get your swings correct. Getting the correct swings means waves are catching the tops and bottoms of each price wave swings.
Then identify potential trades by:
1. Comparison of cumulative Volume histogram vs Pip histogram which makes the concept of Wyckoff "Effort versus Result" identifiable, lot's of volume with small pip move = lot's of effort vs with small result. Supply and Demand imbalance.
2. Monitor Progressive Volume Rate histogram which measures if the volume rate is increasing, decreasing or remains steady within the price wave swing. This histogram indicates more or less participation as price increases or decreases within the specific wave. For example increase of volume rate as price goes up could mean more participation which could mean that sellers might be entering. Also the opposite is valid increasing volume rate as price goes down could mean that buyers are entering.
3. Emphasized Volume waves, provide a visual emphases on large volume waves only, useful for traders that like to trade with high volume trends and for traders that believe that in large volume waves large institutes participate. Trade with price trend but also with the volume trend concept.
What makes it unique
This indicator is an advance cumulative wave histogram because apart the regular volume histogram and apart form using each wave type individually to make a decision it provides more confidence and becomes more powerful when confluence is used combining the other wave types and by using the strategies mentioned above to a higher probability trade. Some examples are shown below
Example of Effort vs. Result Concept
Example of Progressive Volume Rate
Example of Emphasized Volume
Weis Wave With Speed Index SignalsWeis Wave with Speed Index Signals
The Concept
This indicator has been created to try to quantify "Change in Behavior" concept and provide buy and sell based on this concept. What is Change in Behavior? Price is moving at speed rate based on the trading volume direction (buyers and sellers) until there is imbalance of Supply/Demand. An algorithm has been created to identify this change of Supply/Demand behavior producing a number called "Speed Index". Abnormal Speed Index notes this change in behavior when compared with previous Speed Index numbers of the same pair and in the same timeframe. Speed Index is a relevant number and it's use is to be compared with previous Speed Index numbers and not as an absolute number. Based on Speed Index Behavior of recent waves, price and price wave structure buy and sell signals are available called Plutus.
What it does
This indicator draws a waveline of price waves swings. Up swing is when price goes up and down swing is when price goes down. It adds the volume of each bar within the wave swing, it measures the distance in pips of each swing and measure the numbers of bars of each swing. Furthermore, it creates the Speed Index of each swing, the average Speed Index of x selectable wave swings back as well as the average of Speed Index of the x up swings back and the average of the down swing. The indicator is also able to designate a Fast wave which means large pip move with small volume with the letter "F" displayed next to Speed Index and a Slow wave which small pip move with small volume with the letter "S". Finally based on price, Speed Index history and structure it creates eight buy/sell signals called Plutus.
Information available for display all selectable
For each wave swing: Total Volume, Pip Distance, Number of Bars or Total Volume + Pips or Total Volume + Pip Distance+Total Number of Bars
For each wave swing: Speed Index or Total Volume + Speed Index or Speed Index + Average Speed Index or Speed Index+(F or S).
Plutus buy and sell signals when criteria of price location, speed index comparison (abnormal speed index) and wave price structure have been met.
How it does it
This indicator draws a wave-line of price waves swings. Wave Sensitivity can be adjusted by AutoSensitivity parameter (min value =2 and max value=11). The larger the number the more sensitive it is, which means more wave swings will be created. All calculations are based on each wave swing. The code calculates all the above mentioned on the "Information available for Display" section. Based on price, Speed Index history, Speed Index ratio and structure Plutus buy and sell signals are created. The default value of Speed Index ratio is 2. Decreasing Speed Index ratio will create more signals while increasing it will create less signals.
Note: last wave re-paints and no information is displayed on the forming wave, but the whole trading methodology is based on reading previous waves information.
Technical Information
Speed Index
High Speed Index number means a slow wave "S" = Abnormal Speed (high volume small pip move)
Low Speed Index number means a fast wave "F" =Anormal Speed (small volume large pip move)
Normal Speed Index number (are the more frequent numbers seen in the chart which means that the market agrees with the move).
Plutus Signals
PL - Plutus Long, this is when the price will follow in the same direction of the wave with the High Speed Index. When signal is generated we enter when price close breaks the previous two wave structure Resistance Level
PS - Plutus Short, same as above, this is when the price will follow in the same direction of the wave with the High Speed Index. When signal is generated, we enter when price close breaks the previous two wave structure Support Level
PRL - Plutus Reversal Long, this is when the price will go in the opposite direction of the wave with the High Speed Index.
PRS - Plutus Reversal Short, same as above, this is when the price will go in the opposite direction of the wave with the High Speed Index.
PFL - Plutus Fake Long, this when price will do a fast break of the previous down swing bottom and then comes back within the previous swing range (fake break)
PFL - Plutus Fake Short, this when price will do a fast break of the previous up swing top and then comes back within the previous swing range (fake break)
WU - Wyckoff Upthrust plutus (short signal)- this is when the last two swings resemble(are) Wyckoff's UpThrust pattern price swings. This resemblance together with Speed Index criteria and price break of structure create this signal.
WS - Wyckoff Spring plutus(long signal)- this is when the last two swings resemble(are) Wyckoff's pattern price swings. This resemblance together with Speed Index criteria and price break of structure create this signal.
How to use it
Draw Support/Resistance and Fib - usually supply and demand imbalance happens at his level
First and most important of all adjust AutoSesnsitivity to get your swings correct, meaning that are catching the tops and bottoms of each price wave swing.
Monitor Speed Index behavior. Be alerted from Abnormal Speed Index number. You can also set using the Extreme Threshold parameter that provide you an alert if the current Speed Index is above or below average Speed Index of x waves back and also meets the min and max bar criteria. For example if we would like to be alerted for a an Abnormal Speed Index of a Slow wave of at 3 bars then we have set the Min Slow Bar parameter to 3, the Extreme Threshold parameter to 0.5 (50%) and the Avg Waves back to 8 then an alert will be produced if the wave before the forming has at least 3 bars and the Speed Index of the wave is 50% higher than the Average Speed Index calculated from 8 waves back. For a Fast wave we can set the Min Fast Bars to 1, Extreme Threshold to 50% and Avg Waves back to 8 which means that we will get an alert if the wave before the forming one has at least 1 bar and it's Speed Index is at least 50% less than the Speed Index Average of 8 waves back.
Plutus signals provide buy and sell entries after specific criteria have been met. These signals have a higher success rate when price is exiting a range or when price is leaving from Support/Resistance or Fib. Consider Plutus signals invalid within a range unless is the exit of the range (Range Break)
What makes it unique
The ability to identify, quantify and be alerted of the Change in Behavior of waves swings when compared with recent previous wave swings making it easier for the trader to be notified about Supply / Demand imbalance. Furthermore, another unique point of this indicator is the Plutus signals providing buy and sell entries. Plutus entries take into consideration this Abnormal Behavior, the wave swings structure and price location.
Example Trades
Wyckoff Up- rust formation strategy- Reading the chart
1. We have broken a Resistance Level with a Fast Speed Index of 0.7F
2. Abnormal Speed Index of 2.3 provides the alert for abnormal Speed Index behavior. There is not a high Speed Index like that in all the up wave swings which automatic makes it abnormal Supply Demand imbalance.
3. WU - Wyckoff Up-trust plutus signal has been created, which means Short.
4. PRS - Plutus Reversal Short also created at the same location which makes the Short even a higher probability trade
5. Entry: We enter Short on the close of the bar
Exit from Range Strategy - Reading the chart
1. We are in a Ranging environment
2. PS and PRS are invalid signals because according to the rules mentioned previously we do not trade any signals created within the range when the price does not break the range.
3. PRL - Plutus Reversal Long which means that price will move in the opposite direction of the High Speed Index (the 2.2) is a valid signal since price breaks the top of the range
4. Entry Long after breaking the top of the range
PRL after Support hit Strategy and Exit from Range Strategy - Reading the chart
In this we have two different strategies available. The first one is Plutus Reversal Long signal after hitting support and the second on an Exit from Range.
The Story:
1. We have hit support (double bottom)
2. Speed Index 2.2 at the bottom is on the High side, not too extreme but on the high side.
3. A PRL long signal is generated which means that price will move in the opposite direction of the 2.2 Speed Index
4. Entry Long on the close of the bar- This trade has provided 482 pips of profit
5. Price goes into Range
6. Classic textbook strategy Exit from Range with Plutus. We get a PL Plutus Long signal which means price will follow the directions of the high Speed Index wave and in this case is the 2.7 wave
7. Entry Long after the range break. This trade provided 384 pips up to now.

Volatility Percentile (H-LINES)A simple script that adjusts the Volatility Percentile Indicator visibly in order to better accommodate entries/exits and certain trading setups/strategies.
--------------------------------------------------------------------------------------------------------------------------------------------------------
TL;DR - Remember after a full reset, we are looking for initial crosses UP on the UpperSwingline and crosses DOWN on the LowerSwingline for primary and secondary signal derivation.
Vice versa also works great but the prior method mentioned is a little more consistent in my experience, but you should mess around and optimise this for your own setups and strategies anyway.
--------------------------------------------------------------------------------------------------------------------------------------------------------
ORIGINAL SCRIPT HERE:
^Click image for a redirect to that script.
ALL CREDIT GOES TO: www.tradingview.com
He wrote everything so give credit where it's due, good bit of kit this here script is.
--------------------------------------------------------------------------------------------------------------------------------------------------------
HOW I USE MY VISUALLY ALTERED VERSION OF THIS SCRIPT
First of all, the alterations I've made seem only to be consistently viable with renko charts though if you can get the sought after results using candles or any other chart type then perfect, but be wary. All my back-testing done only with LinReg, HMA and SWMA - ATR type settings exclusively on renko charts. The changes I've made to the original script essentially just turns it visibly into an oscillator and uses a couple horizontal lines to generate signals, very simple - absolutely nothing has changed in the actual code of calculating this indicator.
What I believe my adjustments have achieved is quite simple. A full reset/oscillation on the indicator tries to map the strongest parts of a move or at least the part of the move where volume and the rate of transactions is at its peak to even facilitate said move. *take this statement with a pinch of salt though I do believe it's interacting with accumulation/distribution patterns, which is expected of volatility*
For ease of communication let's refer to the area between the the first UpperSwingline cross to the subsequent LowerSwingline cross, as the primary move. Then afterwards when it crosses the UpperSwingline again to make the full reset, the area in between those two points referred to as the secondary move.
Though more interestingly/practically the indicator ends up giving you two signals. In order for this to work we have to first decide that a spike up in volatility which crosses the UpperSwingline implies a significant level of interest at that price level. Usually that means a reversal is brewing, if price has already moved, trended and is approaching a certain area of value; which causes a spike of new positions to be taken, then you know that this is a level where contrarians are looking to enter. Now here's the tricky part, when volatility crosses the LowerSwingline price action becomes a little more open for interpretation, the way I personally like to look at this secondary signal is the potential for an exhaustion period to prolong itself a little longer. I know that's not the perfect analysis for what's going on, a more in-depth look into what's going on would best be described using Elliott Wave Theory, if a cross on the UpperSwingline near a significant area of value gives us a reversal trade lets just assume for the sake of argument that a new Elliott Wave can begin forming here. Making the move from that initial UpperSwngline cross to the cross on the LowerSwingline, the area that encompasses those two points: the impulse wave. After this point my analogy kind of falls apart and sadly my knowledge just isn't what it needs to be in order for me to properly analyse what's going on here but I must digress. Price after crossing the LowerSwingline up until the point where it makes a full reset by crossing the UpperSwingline again, within this area price seems to do either one of two things:
Situation 1 - Most likely occurs after a major trend reversal from major support/resistance or area of value (price has trended to new territory, maybe spent time a little time consolidating but hasn't broken the key level, momentum shifts, price action breaks current structure and you get the signal that primary move is a reversal) = Exhaustion Period, price will continue in direction of primary move during the secondary move. This here is for our trend-followers, you wanna take a continuation trade? Just wait for the pullback/rally to hit a FiB retracement level and enter - or any other means to find a decent support/resistance to enter.
Situation 2 - Most likely occurs when market enters a range or consolidation (price was previously seen as being at either a discount or premium so Situation 1 could have already played out and now you're looking at a full reset after that, imagine this spot to be the centre line of a linear regression channel or bang in the middle of your range, could even occur if price breaks a key moving average and decides it ought to consolidate around it for a while. Basically at any point where a somewhat prolonged consolidation is expected and not a quick reversal) = Corrective Wave, price will move against the direction of primary move during the secondary move. Now you might be expecting me to say this ones for you reversal traders but not really, if this is occurring then there probably isn't a definitive direction the market has chosen so you can use this opportunity to take range trades in the direction or against the direction of whatever the current trend or latest trend was depending on whatever slight bias you may have. <--- Situation 2 is very useful for finding cleaner entries if you do have a trend bias, say price underwent Situation 1, is now at key moving average but your bias is that it will break and continue up, so you wait and allow the secondary move of Situation 2 to take your entry to a much better R:R before entering a position.
--------------------------------------------------------------------------------------------------------------------------------------------------------

RedK EVEREX - Effort Versus Results ExplorerRedK EVEREX is an experimental indicator that explores "Volume Price Analysis" basic concepts and Wyckoff law "Effort versus Result" - by inspecting the relative volume (effort) and the associated (relative) price action (result) for each bar - showing the analysis as an easy to read "stacked bands" visual. From that analysis, we calculate a "Relative Rate of Flow" - an easy to use +100/-100 oscilator that can be used to trigger a signal when a bullish or bearish mode is detected for a certain user-selected length of bars.
Basic Concepts of VPA
-------------------------------
(The topics of VPA & Wyckoff Effort vs Results law are too comprehensive to cover here - So here's just a very basic summary - please review these topics in detail in various sources available here in TradingView or on the web)
* Volume Price Analysis (VPA) is the examination of the number of shares or contracts of a security that have been traded in a given period, and the associated price movement. By analyzing trends in volume in conjunction with price movements, traders can determine the significance of changes in price and what may unfold in the near future.
* Oftentimes, high volumes of trading can infer a lot about investors’ outlook on a market or security. A significant price increase along with a significant volume increase, for example, could be a credible sign of a continued bullish trend or a bullish reversal. Adversely, a significant price decrease with a significant volume increase can point to a continued bearish trend or a bearish trend reversal.
* Incorporating volume into a trading decision can help an investor to have a more balanced view of all the broad market factors that could be influencing a security’s price, which helps an investor to make a more informed decision.
* Wyckoff's law "Effort versus results" dictates that large effort is expected to be accompanied with big results - which means that we should expect to see a big price move (result) associated with a large relative volume (effort) for a certain trading period (bar).
* The way traders use this concept in chart analysis is to mainly look for imbalances or invalidation. for example, when we observe a large relative volume that is associated with very limited price change - that should trigger an early flag/warning sign that the current price trend is facing challenges and may be an early sign of "reversal" - this applies in both bearish and bullish conditions. on the other hand, when price starts to trend in a certain direction and that's associated with increasing volume, that can act as kind of validation, or a confirmation that the market supports that move.
How does EVEREX work
---------------------------------
* EVEREX inspects each bar and calculates a relative value for volume (effort) and "strength of price movement" (result) compared to a specified lookback period. The results are then visualized as stacked bands - the lower band represents the relative volume, the upper band represents the relative price strength - with clear color coding for easier analysis.
* The scale of the band is initially set to 100 (each band can occupy up to 50) - and that can be changed in the settings to 200 or 400 - mainly to allow a "zoom in" on the bands.
* Reading the resulting stacked bands makes it easier to see "balanced" volume/price action (where both bands are either equally strong, or equally weak), or when there's imbalance between volume and price (for example, a compression bar will show with high volume band and very small/tiny price action band) - another favorite pattern in VPA is the "Ease of Move", which will show as a relatively small volume band associated with a large "price action band" (either bullish or bearish) .. and so on.
* a bit of a techie piece: why the use of a custom "Normalize()" function to calculate "relative" values in EVEREX?
When we evaluate a certain value against an average (for example, volume) we need a mechanism to deal with "super high" values that largely exceed that average - I also needed a mechanism that mimics how a trader looks at a volume bar and decides that this volume value is super low, low, average, above average, high or super high -- the issue with using a stoch() function, which is the usual technique for comparing a data point against a lookback average, is that this function will produce a "zero" for low values, and cause a large distortion of the next few "ratios" when super large values occur in the data series - i researched multiple techniques here and decided to use the custom Normalize() function - and what i found is, as long as we're applying the same formula consistently to the data series, since it's all relative to itself, we can confidently use the result. Please feel free to play around with this part further if you like - the code is commented for those who would like to research this further.
* Overall, the hope is to make the bar-by-bar analysis easier and faster for traders who apply VPA concepts in their trading
What is RROF?
--------------------------
* Once we have the values of relative volume and relative price strength, it's easy from there to combine these values into a moving index that can be used to track overall strength and detect reversals in market direction - if you think about it this a very similar concept to a volume-weighted RSI. I call that index the "Relative Rate of Flow" - or RROF (cause we're not using the direct volume and price values in the calculation, but rather relative values that we calculated with the proprietary "Normalize" function in the script.
* You can show RROF as a single or double-period - and you can customize it in terms of smoothing, and signal line - and also utilize the basic alerts to get notified when a change in strength from one side to the other (bullish vs bearish) is detected
* In the chart above, you can see how the RROF was able to detect change in market condition from Bearsh to Bullish - then from Bullish to Bearish for TSLA with good accuracy.
Other Usage Options in EVEREX
------------------------------------
* I wrote EVEREX with a lot of flexibility and utilization in mind, while focusing on a clean and easy to use visual - EVEREX should work with any time frame and any instrument - in instruments with no volume data, only price data will be used.
* You can completely hide the "EVEREX bands" and use EVEREX as a single or dual period strength indicator (by exposing the Bias/Sentiment plot which is hidden by default) -
here's how this setup would look like - in this mode, you will basically be using EVEREX the same way you're using a volume-weighted RSI
* or you can hide the bias/sentiment, and expose the Bulls & Bears plots (using the indicator's "Style" tab), and trade it like a Bull/Bear Pressure Index like this
* you can choose Moving Average type for most plot elements in EVEREX, including how to deal with the Lookback averaging
* you can set EVEREX to a different time frame than the chart
* did i mention basic alerts in this v1.0 ?? There's room to add more VPA-specific alerts in future version (for example, when Ease-of-Move or Compression bars are detected...etc) - let me know if the comments what you want to see
Final Thoughts
--------------------
* EVEREX can be used for bar-by-bar VPA analysis - There are so much literature out there about VPA and it's highly recommended that traders read more about what VPA is and how it works - as it adds an interesting (and critical) dimension to technical analysis and will improve decision making
* RROF is a "strength indicator" - it does not track price values (levels) or momentum - as you will see when you use it, the price can be moving up, while the RROF signal line starts moving down, reflecting decreasing strength (or otherwise, increasing bear strength) - So if you incorporate EVEREX in your trading you will need to use it alongside other momentum and price value indicators (like MACD, MA's, Trend Channels, Support & Resistance Lines, Fib / Donchian..etc) - to use for trade confirmation

BB Mod + ForecastThis is a combination of two previous indicators; ALMA stdev band with fibs and Vector MACD.
Bollinger Band Mod fits the standard deviation on both sides of the center moving average ( ALMA +/- stdev / 2 ) and calculates Fibonacci ratios from stdev on both sides.
It is more averaging and more responsive at the same time compared to Bollinger Band.
Forecast is calculated from difference between origin ma ( ALMA from hl2 ) and six different period Hull moving averages averaged together and added to the center ma on both sides.
Fibonacci levels for 0.618 1.618 and 2.618 are added.
The dashed lines point towards the trend. Gives you a better idea of the current trend and momentum in the band.
LT Elliott Wave 2.0LT Elliott Waves 2.0 Indicator:
According to Elliott Wave Theory, price moves in 5 waves in the direction of the major trend and moves in 3 waves (ABC) when it moves against the major trend. The key purpose and value of elliott wave theory (EWT) is to provide context for chart analysis. According to the book The Elliott Wave Principle by Frost & Prechter: “This context provides both a basis for disciplined thinking and a perspective on the market's general position and outlook.” The benefit of having context is that one can identify and anticipate changes in direction.
In Elliott Wave theory, waves 1, 3, 5 and C are impulse waves (a five wave pattern that makes progress) whereas waves 2, 4, A and B are corrective waves (a three wave pattern – or combination of three waves - that moves against the direction of the larger trend). Although wave A can also be formed of 5 waves, it is commonly formed of 3 waves. Here is a brief summary of the waves:
Wave 3 tends to be the strongest and most dynamic wave – it is usually (but not always) the longest wave but it is never the shortest. Wave 4 is a corrective wave that is typically composed of 3 smaller waves (ABC) and is notorious for being messy and unpredictable in nature. Wave 5 is the final wave before a significant correction or reversal in trend and is often accompanied by divergences (e.g. negative divergences in an uptrend) and exhaustions in momentum. It is also possible for a wave 5 to form after a “blow-off top” pattern. Wave 2 is composed of 3 smaller waves (ABC) and is a retracement of wave 1 – the retracement can be shallow to moderate (23.6% to 38.2%) or deep (50%, 61.8% to 78.6%). Wave 1 is the first wave of a trend and is composed of 5 smaller waves – it usually occurs after divergences (in the prior move) and extremes in both sentiment and momentum. For example, the wave 1 of an uptrend can often begin after capitulation in the price (after a major decline), extremely pessimistic sentiment, extremely oversold momentum readings, positive divergences and sometimes accompanied by a volume breadth thrust. Waves A and C are often equal in measure. Wave A can be formed of either 5 waves or 3 waves - but more commonly it is composed of 3 waves. Wave B is always corrective and composed of 3 smaller waves. Wave C is a five wave impulse pattern.
The Elliott Wave 2.0 (or EW2) chart indicator seeks to simplify elliott wave theory (EWT) in that its main purpose is to identify the potential major trends and corrections. The indicator takes a more simple and direct approach to EWT in that it focuses more on trying to identify whether price is trending or not, and if there is a trend, then the probable wave pattern. It does this by mainly using the structure of the price chart as well as other factors such as momentum, fibonacci retracements & extensions and the relationship of price to its key averages. The indicator then takes its best guess at whether price is in a trending environment, and if so, which wave it is probably forming. This means that the wave count can often depend on the chart timeframe chosen. For example, what may appear as a major downtrend on a lower timeframe chart may potentially be a corrective drop on a much higher timeframe, due to the different price structure of the charts. To keep things simple and to avoid complexity, the indicator does not display the minor sub-waves within the major waves.
The main feature and benefit of the Elliott Wave 2.0 (EW2) indicator is that it can remove most of the subjectivity in chart and wave analysis. It also allows for flexibility in that it allows the chartist to alter the wave count and the position of the wave counts if they choose to do so (within the parameters and rules set by the indicator). As with all of technical analysis, the wave counts shown by the elliott wave indicator are NOT certain or absolute – they are only a possibility or a probability. So the risk always exists of an alternative wave count. It is for the chartist to determine the probable wave counts and limit or control the risks based on their knowledge of technical analysis and risk management.
The settings of the Elliott Wave 2.0 indicator (EW2) are fairly self-explanatory but here is a brief summary:
In the Trend Analysis Switch, the indicator is set by default to a “moderate” trend setting in that it waits for moderately significant changes in momentum before a probable wave 5 is shown (i.e. the fifth wave within the elliott five wave pattern). So for example, in an uptrend, the indicator may show a probable “wave 3” (a blue-coloured wave 3) if the path of least resistance and the likely trend is still to the upside. Once a change in momentum and trend direction occurs, then the indicator may change the wave count to a “wave 5” (a green-coloured wave 5) provided the parameters for this wave count have been met. This default “moderate” setting can be changed by the user or chartist. So if the user wants to change the wave count from a probable “wave 5” to a potential “wave 3”, then it may be possible to do so by changing the trend analysis switch from “moderate” to “strict”. The indicator will likely then display a “wave 3” count until the price reverses some more and breaks below a key support level (assuming the prior trend was up), thus changing the wave count from a “wave 3” (in blue) to a probable “wave 5” (in green). (The opposite of this example applies in downtrends.)
If the chartist decides to delay the changing of the wave count, such as delaying the change of wave 3 to a wave 5, then the “strict” option can be enabled in the trend analysis switch. If the user prefers a slightly more aggressive (or quicker) change in the trend and wave count, then the “aggressive” option can be applied. This is provided the chartist decides it is reasonable or “logical” to make the change. The EW2 indicator will only make the change IF doing so is allowed within its set parameters and rules. The trend analysis switch settings (moderate, aggressive and strict) are largely based on the relative position of price to certain key averages and crossovers, such as both short-term & long-term moving averages which can act as support and resistance.
It is important to mention here is that if any changes are made to the settings of the EW2 indicator (such as moving or modifying the wave counts), it is essential to click on “Reset settings” when changing the chart to a different symbol or timeframe. So whenever a new chart symbol or timeframe is chosen, it is recommended to apply the “reset settings” function in the indicator defaults at the bottom left of the settings section. This will refresh the settings of the indicator back to defaults.
The Elliott Wave 2.0 indicator has greater flexibility options within the settings to change the positions of certain wave counts based on the structure of the chart. This can be achieved by manually moving the wave counts in the first top-section of the EW2 settings, where it says “Move Wave Forward/Back”. By clicking the up or down arrows (on the box provided) the position of the wave count can be moved, based on the zigzag patterns of the chart. So for example, if we wanted to move the position of the historical wave 5 (shown in green on the chart), then we would hover over the box next to “Move hist wave 5 forward/back” and click up or down on the arrows. Clicking the UP arrow would move the wave count position forward on the chart while clicking the DOWN arrow would move it backward. The same can be done with other waves such as the positions of waves 1, 2, 3 and 4 – provided this is permitted by the structure on the chart and the rules set by the indicator.
In the elliott wave indicator, the potential major wave counts are shown in blue and sometimes yellow. The blue wave counts have a slightly higher probability than the yellow as the yellow will need further confirmation by the price structure and momentum.
The starting point for the wave counts is shown as a green “wave 5” – this is referred to as the “historical wave 5” as it is the likely fifth wave of the prior wave (e.g. a prior impulse or corrective wave). The historical wave 5 is the starting point where the indicator starts “counting” the waves. The indicator makes its best guess as to where to start counting from the historical wave 5, but the user has the option to change its position, if required as per the parameters set by the indicator. As a general rule, in an uptrend, the green historical wave 5 should ideally be positioned at the lowest point on the chart (such as the lowest point in the past 300 bars). The opposite applies in downtrends where the historical wave 5 should ideally be at the highest point on the chart (e.g. in the past 300 bars). It should be noted that when the position of the green historical wave 5 is changed, this usually affects the entire wave count. The position of the historical wave 5 (green) can be changed in the settings of the elliott wave indicator (as discussed above). Additionally, if needed, we can also change the label of the green historical wave 5 within the settings to a pink “C-wave” (i.e. the “C-wave” of the prior corrective wave).
As mentioned, the EW2 indicator does its best to make the optimal “guess” as to the probable position of the wave counts, using the structure and momentum on the chart. However, just like any other chart indicator, it is not perfect and it can get the position wrong at times. This is to be expected as we are dealing with an uncertain, chaotic and probabilistic environment when doing chart analysis. Therefore, where it is deemed suitable, the position of the waves - such as waves 1, 2, 3, 4 and the historical wave 5 (or “C-wave”) – can be changed in the settings. The “wider jumps” option can be enabled in the settings for bigger skips in the position of the waves when toggling the positions using the up and down arrows.
The position of most waves can also be altered by modifying the major structure (in the zigzag) using the option in the settings called “Modify major structure”. Please note that using this can sometimes change the wave count as well. This specific setting provides a drop-down menu (labelled A to F) that allows several structures to be chosen in the zigzag (within certain limits). However, in the majority of cases, only the first four options (A, B, C and D) will be required to change the structure of the zigzag. Options C and D provide the greatest variability in the zigzag structure.
One useful method to remember is that often the most effective way to modify the wave count is to adjust the positions of waves 1 and 3 (assuming the starting position of the historical green wave 5 has been decided). As long as we can place wave 1 (and by default wave 2) to a reasonable or “logical” level, the remaining wave counts and projections can usually take care of themselves. Adjusting the position of wave 3 to a logical position can also be useful in this respect. A good way to correctly determine the “wave 1” and “wave 3” of an impulse is to look at its internal structure. If both are composed of five sub-waves (i.e. if each have an internal structure of five smaller waves) then the probability is higher that we have identified the waves 1 and 3 correctly, as both waves are impulsive. The same rule can apply for wave 5. Another rule to remember is that wave 3 can never be the shortest impulse wave but it is often the longest.
One of the new and major features of the Elliott Wave 2.0 indicator are the wave 3, wave 4 and wave 5 projections. The indicator uses a number of fibonacci extensions and ratios of certain waves (e.g. waves 1 and 2) to calculate the probable wave 3 projections as well as the potential wave 5 projections. The wave 3 projections are labelled as “3” and are shown as blue horizontal lines. Wave 5 projections are labelled as “5” and are shown as cyan, green, brown or purple lines. EW2 also makes use of mainly fibonacci retracements (such as the golden ratio) for calculating the probable wave 4 projections. Wave 4 projections are shown as “4” in orange, dark blue and red. Wave 4 has a number of alternate settings which make use of RSI momentum and fibonacci levels. The alternate settings for wave 4 can be used if the user believes that wave 3 has completed and that a wave 4 correction is likely in progress or coming to an end. The setting “Wave 5 in progress” can also be used for this purpose, if the chartist believes that the wave 4 has likely completed (or coming to an end) and that a potential “wave 5” is taking shape.
The “Logarithmic fibs” setting is an option for certain charts and timeframes that require a logarithmic chart to be used. For example, higher timeframe charts (such as weekly or monthly) and very volatile price charts may benefit from a logarithmic setting and therefore logarithmic fibonacci levels. Generally, if the chartist is using a log chart for a specific symbol (or timeframe), it would be preferable to apply logarithmic fibonacci levels as well. So this function can be selected in the EW2 settings accordingly.
While most wave projections (such as waves 3, 4 and 5) will show automatically on the chart, the user can decide to remove certain projections (e.g. waves 4 and 5) to reduce the amount of text or lines on a chart. This can be done by selecting the specific “Hide wave projections” function in the settings for the waves 4 and 5. Extra projections for waves 3, 4 or 5 can be shown by selecting the option for “More projections” for each specific wave.
Another useful feature is the “Wave 3 probability decrease level” function. This draws a horizontal magenta line at a specific fibonacci extension which can act as a key level of support (or resistance) for a probable wave 3. This could be helpful when a new trend is starting and we have the beginning of what appears to be a wave 3. For example, in a new uptrend, the probable wave 3 would have to stay above this key level (shown as a magenta line) if the probability of a wave 3 is going to remain high or intact. In other words, if price were to drop below this key level (in an uptrend) then the odds of a wave 3 would be lowered significantly and downside risk could increase. The opposite applies in downtrends.
The lookback period can be decreased to make the EW2 indicator focus on the much more recent data, such as the previous 100 bars. This can be done by selecting “Use short term” in the settings. This function can be used in situations where the trend may have changed very suddenly and the user wants to focus on the more immediate chart structure.
The setting also provides an “Aggressive wave 3” option for situations that may require the wave 3 to be shown sooner, such as at the start of a new trend. This option as well as others are included for further flexibility in the wave count. When this “aggressive wave 3” option enabled, the EW2 will display a yellow “wave 3” provided the conditions have been met based on fibonacci extensions.
As mentioned, the elliott wave indicator is programmed to look for and identify potential trending or impulsive patterns, and when appropriate, corrective ABC patterns. In this sense, we are looking to simplify elliott wave theory by taking a more flexible and common-sense approach to the wave patterns. So if the price action has broken key levels of support or resistance, momentum is increasing and price is moving deliberately in a specific direction, it becomes more likely that price is in a trending environment (rather than just a correction). Therefore, the EW2 indicator will likely start by showing the initial impulsive waves 1, 2 and 3 (in blue or blue/yellow) instead of the corrective waves ABC (in pink). However, the user has the choice to change the waves from 123 to ABC by selecting “ABC corrective waves” in the settings.
The EW2 indicator also allows the option to “reverse” the probable trend (and wave count) if required. For example, if the EW2 indicator is showing a probable wave 3 or wave 5 (in blue) and price begins to pullback or move in the opposite direction to the main trend of the wave 3 or 5 – e.g. if price starts to break key support levels (e.g. after an uptrend) and then reverse lower in the opposite direction to the primary trend - then the user has the option to change the wave count in the opposite direction (e.g. downward) a bit quicker. This can be achieved by selecting the option in the settings called “Reverse probable trend”. Applying this setting will reverse the original wave count of the primary trend as set by the indicator (e.g. from up to down or vice versa) provided it is permitted by the rules of the indicator. The colours of the wave counts will change to grey instead of blue. The user can also choose where to manually place the historical wave 5 (if required). However, although this “reverse” option is provided for extra flexibility, it should NOT be used very often. It should only be applied for certain special circumstances where it is deemed appropriate to change the wave count from an uptrend to a downtrend (or vice versa). The EW2 indicator does a reasonably good job on its own of identifying most trend changes without the need for this special “reverse trend” setting.
The chartist can apply other methods of chart analysis – such as trendline breaks, oscillators, regression channels, breaks of support/resistance – to determine when a probable wave (or wave count) has likely completed. For example, technical analysis methods such as trendline breaks and support/resistance breaks can be used by the chartist to determine the probability of whether wave 4 has potentially completed or not. In an uptrend, confirmation that a probable wave such as wave 4 has completed will not come until price has taken out the highs prior to the decline (i.e. the highs before the pullback in the probable “wave 4” correction). The same applies in reverse for a downtrend: confirmation that the probable wave 4 has completed will not come until price has taken out the lows prior to the rally (in a probable wave 4 correction).
It should be remembered that the appearance of the most recent wave counts (or wave labels) shown by the indicator, by themselves do NOT mean that the specific waves in question have definitely completed or finished. The same applies with wave projections as they do NOT imply that price has to necessarily move to those specific projection levels. They are merely to provide helpful guidance and education in chart analysis. Nothing in chart analysis is certain or definite as we are dealing with a system that is chaotic, unpredictable and probabilistic. The wave label itself is simply an indication that the most recent wave is probably still in progress, not necessarily that it has completed. Chartists can apply other technical analysis tools and methods (e.g. trend lines, support/resistance breaks, moving averages and regression channels etc.) to increase the probability of when a specific wave has probably completed. The same also applies to past or “completed” wave counts (or past wave labels): they do NOT mean that the specific waves have definitely completed or finished – it is merely a possibility or probability. So the risk always exists that the wave counts may potentially be wrong, and that an alternative wave count interpretation may exist.
In certain circumstances where there are volatile conditions and charts, it is possible that the elliott wave indicator may show an “unusual” wave count. For example, it is possible that the positions of certain wave counts (such as waves 1, 2, 3 and 5) may be in the “wrong” order. This happens rarely so it is not an issue that happens very often. However, if this issue occurs, the chartist can rectify the matter by applying one of the following options: (a) moving and adjusting the position of the historical wave 5 (in green) to a more logical position, (b) applying the “use short term” setting or (c) wait a bit longer until the volatility resolves itself in time. These options can usually resolve the issue and show the wave counts in a “proper” manner. Changing to a slightly lower (or higher) timeframe can also usually resolve this issue. If any changes are made to the settings of the indicator, please reset the indicator settings back to “default” when changing to a different symbol or timeframe.
The user can also choose to enable the zigzags of the waves to be shown on the chart. This can display the wave structures and zigzags, if enabled. By default it is set to off. As mentioned previously, it may also be a good idea to reset the settings of the indicators whenever a new chart or timeframe is chosen. This then refreshes the settings back to its default.
It is important to appreciate that the elliott wave indicator generally requires between 1,500 to 2000 bars of data on the chart in order to display the wave counts adequately and appropriately. So if a chart or timeframe has less than the minimum number of historical data or bars on the chart, the wave counts may not display properly or not appear at all. Certain chart symbols and timeframes (such as the monthly timeframe) may have very limited amount of data on them. Therefore, the elliott wave indicator will likely not appear on these charts or may not display properly. In these situations, a different chart symbol or a lower timeframe with more data on it can be chosen. For example, instead of a monthly timeframe, a weekly or daily timeframe can be chosen. Similarly, if a “study error” message appears on the EW2 indicator, this can be remedied by switching to a slightly lower (or higher) timeframe. However, usually such study errors are temporary and often get resolved after a brief time.
We have allowed for further flexibility in the EW2 indicator so that the user can move the wave counts manually, if required. The chartist can manually move the position of a wave count to a specific bar (or candle) on the chart if they choose to do so. For example, if we want to move the position of wave 1 to a specific bar in the past, we would first tick the box in the indicator settings called “Manually Place Wave 1”. Then we would use the “date range” tool to find out the distance of that past bar from the current bar (e.g. 50 bars) and then input that number (50) into the box next to “Manually Place Wave 1”.
Price action, markets and their charts are non-linear and chaotic, which means that they are subject to uncertainty, variable change and being unpredictable in nature. So we must maintain a probabilistic mindset and attitude to technical analysis. Nothing is certain. Therefore, no wave count is certain or “set in stone”. Wave counts, just like the actions and emotions of human beings, are subject to change. Elliott Wave theory, just like all of technical analysis is about what is possible, what is probable and what the risks are of a particular outcome. The advantage of elliott wave theory, as explained previously, is about gaining an understanding of context and the likely big picture. The indicator is provided in good faith but we do not vouch for its accuracy.
As mentioned previously, chartists should be aware of the probabilistic and uncertain nature of price action and the markets, and therefore prepare to limit and control any potential risks.
The chart indicator can be used on the charts of the majority of markets (e.g. stocks, indices, ETFs, currencies, cryptocurrencies, precious metals, commodities etc.) and any timeframe. Nothing in this indicator, its signals or labels should be construed as a recommendation to buy or sell any market (e.g. stocks, securities, indices, ETFs, currencies, cryptocurrencies, metals, commodities etc.). The indicator is provided solely for educational purposes, to gain a better understanding of technical analysis and elliott wave theory. It should be noted that the degree of noise and randomness increases significantly on lower timeframes. So the lower the timeframe that is chosen (e.g. 15-min or lower) the greater the degree of noise and randomness and therefore the higher the frequency of false signals or whipsaws. The indicator can be applied to candlestick charts and bar charts.
If you would like access, please send me a PM on Tradingview.

Pin Candle DetectionPin candles are a variation of hammer candles that are useful in technical analysis . In particular, when combined with volume profile studies, they can be a powerful set up for long entries or other decision making.
For example, when looking at volume profiles, a long entry would be a fair value area (i.e. 40%) below the close of a pin candle. When combined with a support level , the set up is stronger.
While most scripts look for hammer candles, pin candles are somewhat different in that the length of the wick is significant.
This script and its parameters was built for ES futures 15 min chart in mind.
This script is unique in that it allows for the below parameters to be adjusted to suit other instruments and timeframes:
1. Fib level: Candle must close within a certain retracement level). My preference is 0.55. Some traders like 0.5, while others prefer 0.33
2. Wick length: Pin candles differ from pure hammers in that the length of the wick must be significant. My preference is 7 points on ES (as in $ and not ticks)
Add this script to your alerts to no longer miss these set ups.

RAhul RAJ Out of Range Trade IndicatorThis indicator is for intraday with the basic logic that any script will always trade in its range.
So , if any script moves away from its range, it will try to come back to its normal range movement.
Suppose average movement of any share is 100 points, and share has moved more than 150 points there is high probability that it will move in opposite direction in order to have average movement of price of 100.
For Stocks please use average period as 15 days for index 30 days.
If share price(YELLOW LINE) moves away from higher or lower blue line, then with the help of volume confirmation a trade can be initiated in opposite direction.
Please note direction needs to be opposite of what has happened in the day.
for eg. upper blue line could be broken , in both situation i.e.. share price is rising or falling,
so if share price is rising and upper blue line is broken:
Bearsish trade can be initiated with the help of price action n volume .
if share price has falledn and upper blue is broken:
Bullish trade can be initiated with the help of volume n price action confirmation.
Release Notes:
Remove dead code
update average period m fib level

STructure Atr Cloud w/ TargetsThis indicator is part of our educational suite focused on teaching price structure, momentum, and mean reversion trading strategies. This indicator is recommended to be used with our “Price Action Trading Indicator” or PATI.
Components of this indicator:
Intraday and Swing Price Structure
Breaks of Structure Identification
Change of Character Identification
Fib-derived Price Targets
Dynamic ATR-based Trend Cloud
This indicator is intended to be used in conjunction with the education we provide to help our users determine their optimal trade plan to utilize their edge.
Intraday (Short-Term) Structure is displayed in gray as HH, HL, LH, LL by default, and the zig-zags can be turned on/off in the settings.
Swing Structure is displayed in yellow as HH, HL, LH, LL by default, and the zig-zags can be turned on/off in the settings.
EQL/EQH show areas where price made an equal low or high.
Dynamic ATR-based Trend Cloud (orange cloud) helps traders stay in profitable trades longer by giving them a visual aid of the current momentum. We have added a confirmation level that dynamically appears when the price breaks over/under the cloud giving validation to the potential trend shift. Failure to break this level tends to result in a rejection and continuation of the current orange cloud trend as you can see in the image above.
Change of Character (ChoCh) shows internal structural breaks where a minor level or supply/demand zone fail, resulting in a potential shift in a short-term trend. Above you can see two common ChoCh setups (head and shoulders/ inverse head and shoulders) that usually result in significant price reversals.
Above is an example of using this indicator on two timeframes to develop short and longer term targets. Previous targets can be used as areas of interest where we can look for price to bounce/reject. Target levels that develop above/below price make great areas to potentially take off some risk/ put risk on.
Please check the Author Instructions Below for how to gain access to our indicators.

wick CE; plot candle wick and tail midpoint lines-Simple little tool to plot the wick CE: an ICT concept, consequent encroachment i.e. the midpoint line of a wick or tail; it being a potentially sensitive level (depending on context).
-Wrote this to save me time drawing out fib retracement to locate the precise level of the wick CE. Example usage: show indicator, add horizontal ray over favored wick CE level, hide indicator.
~choose how many consecutive bars back to plot wick CE lines.
~choose how many bars forward to extend the wick CE lines.
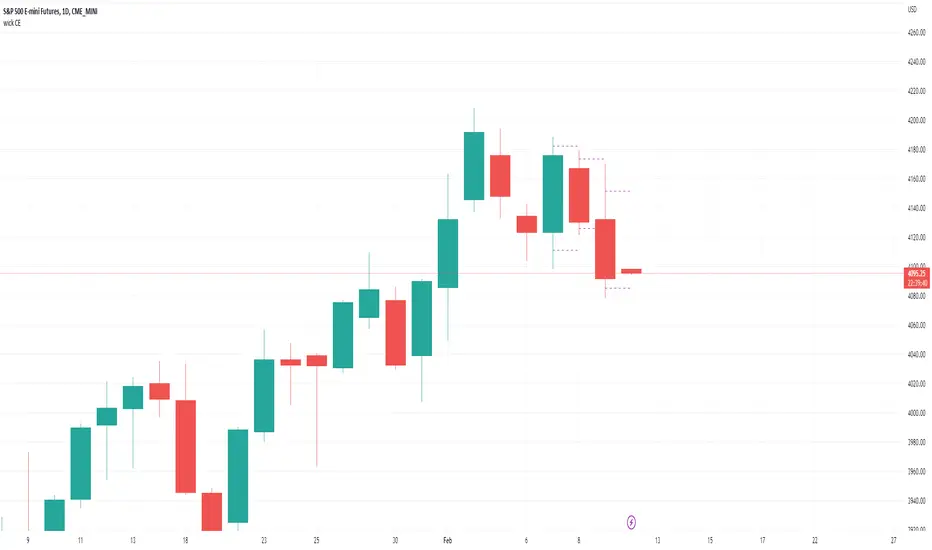
Smart Money Essentials [TFO]This indicator utilizes “Smart Money Concepts” like liquidity, order blocks, premium & discount, and more to analyze price action.
What’s included in the initial release:
Market Structure
Liquidity
Displacement
Order Blocks
Premium / Discount
Confluence Table
Alerts
Market structure logic objectively identifies whether the current trend is bullish or bearish, based on swing highs and lows. Liquidity levels offer insight into major pivots where we can assume many traders may place their stop loss, which can also serve as areas where “Smart Money” may be accumulating or distributing positions.
Displacement adds to this by spotting rapid price movement, often accompanied by imbalances where price may come back to before continuing in the direction of the displacement. These can be filtered based on whether the imbalance is accompanied by a Break of Structure (BOS) or Market Structure Shift (MSS), which may give additional insight into the draw on liquidity.
Order blocks (OB’s) are detected and treated as areas that may offer support for price in an uptrend or resistance in a downtrend. Premium and discount zones are essentially fitted by an “auto-fib” retracement that looks at recent liquidity levels, and optionally offers areas to look for an Optimal Trade Entry (OTE) where price retraces between 62-79% of the preceding displacement leg.
The confluence table provides an organized place to visualize and identify where any of the above concepts may be present at or around the same time. We can implement a threshold where, if the number of selected factors meets or exceeds this threshold, we can potentially identify bullish and bearish opportunities where multiple layers of confluence are overlapping.
And of course, alerts are built in for all significant events related to the above concepts, for example: runs on liquidity, BOS and MSS, rejections from OB and OTE, etc.