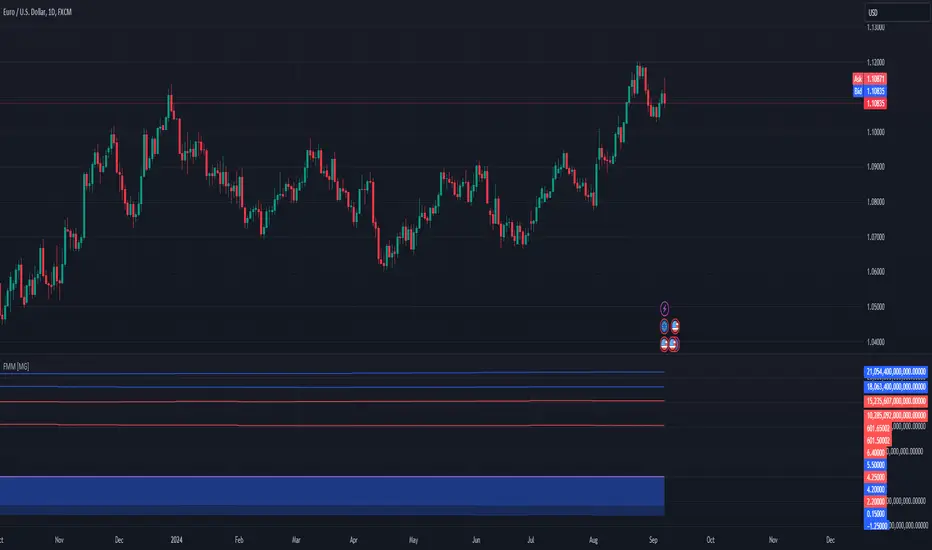
Forex Macro Metrics [MacroGlide]"Forex Macro Metrics " is a powerful tool for analyzing macroeconomic metrics, designed to help traders make more informed decisions in the forex market. This indicator displays key economic indicators such as interest rates, money supply (M1 and M2), unemployment rate, and government debt for various currencies and their pairs, allowing users to assess the macroeconomic differences between the base and quote currencies.
Key Features:
• Interest Rates Display: Includes interest rates for major world currencies with the ability to show the differential between the base and quote currencies.
• Money Supply Analysis (M1 and M2): Displays the money supply for both the base and quote currencies, including differential calculations.
• Unemployment Rate: Compares the unemployment rates between currencies, showing the differences on the chart.
• Government Debt: Shows government debt levels for the base and quote currencies with differential calculations.
• Customizable Options: Enable/disable specific metrics and adjust colors for better visual clarity.
How to Use:
• Select a Currency Pair: Apply the indicator to your chart and choose the desired currency pair. The indicator will automatically load the relevant data for the base and quote currencies.
• Adjust Display Settings: Use the indicator settings to enable or disable specific metrics and their differentials.
• Analyze the Data: Compare the economic conditions of the two currencies through the charts and identify potential trading opportunities based on macroeconomic differences.
Methodology:
The indicator uses economic data available through TradingView tickers to calculate the values of the base and quote currencies. Differentials are calculated by subtracting the values of the quote currency from the base currency, allowing for a visual assessment of their differences. The displayed data includes historical changes, helping to identify trends and potential reversal points.
Originality and Usefulness:
"Forex Macro Metrics " is a unique tool that combines several key macroeconomic indicators into one comprehensive indicator. This simplifies the analysis process for traders looking to understand the fundamental differences between currencies. Using this approach provides an advantage in assessing long-term trends and potential shifts in currency pairs driven by changes in macroeconomic conditions.
Charts:
The indicator displays data in the form of lines and areas on the chart, with interest rates shown as lines for the base and quote currencies, accompanied by an area representing the differential. For money supply (M1 and M2), lines are drawn for each currency, with areas highlighting the differences. Similarly, the unemployment rate and government debt are displayed with clear visual separation of the data and their differentials, making it easy to compare and analyze the macroeconomic conditions of the currencies involved.
Enjoy the game!
Search in scripts for "forex"
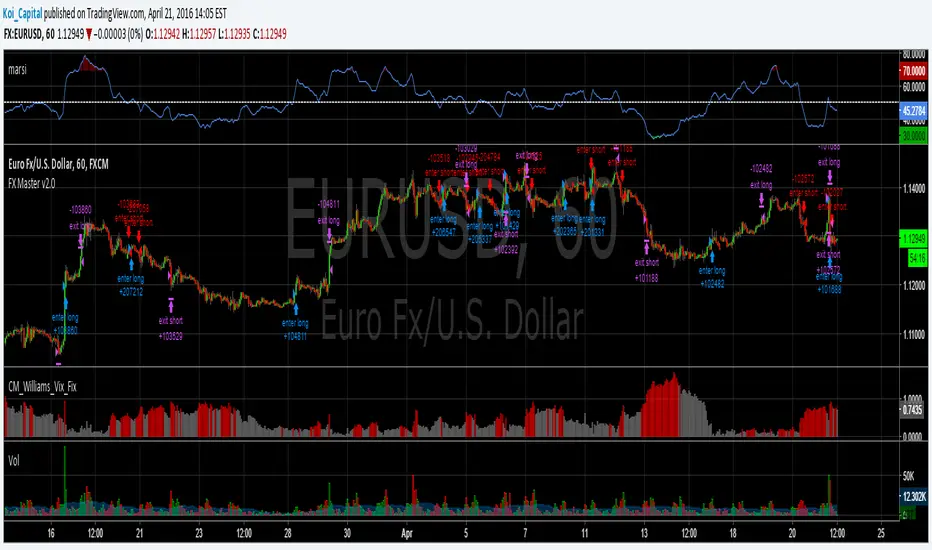
Forex Master v4.0 (EUR/USD Mean-Reversion Algorithm)DESCRIPTION
Forex Master v4.0 is a mean-reversion algorithm currently optimized for trading the EUR/USD pair on the 5M chart interval. All indicator inputs use the period's closing price and all trades are executed at the open of the period following the period where the trade signal was generated.
There are 3 main components that make up Forex Master v4.0:
I. Trend Filter
The algorithm uses a version of the ADX indicator as a trend filter to trade only in certain time periods where price is more likely to be range-bound (i.e., mean-reverting). This indicator is composed of a Fast ADX and a Slow ADX, both using the same look-back period of 50. However, the Fast ADX is smoothed with a 6-period EMA and the Slow ADX is smoothed with a 12-period EMA. When the Fast ADX is above the Slow ADX, the algorithm does not trade because this indicates that price is likelier to trend, which is bad for a mean-reversion system. Conversely, when the Fast ADX is below the Slow ADX, price is likelier to be ranging so this is the only time when the algorithm is allowed to trade.
II. Bollinger Bands
When allowed to trade by the Trend Filter, the algorithm uses the Bollinger Bands indicator to enter long and short positions. The Bolliger Bands indicator has a look-back period of 20 and a standard deviation of 1.5 for both upper and lower bands. When price crosses over the lower band, a Long Signal is generated and a long position is entered. When price crosses under the upper band, a Short Signal is generated and a short position is entered.
III. Money Management
Rule 1 - Each trade will use a limit order for a fixed quantity of 50,000 contracts (0.50 lot). The only exception is Rule
Rule 2 - Order pyramiding is enabled and up to 10 consecutive orders of the same signal can be executed (for example: 14 consecutive Long Signals are generated over 8 hours and the algorithm sends in 10 different buy orders at various prices for a total of 350,000 contracts).
Rule 3 - Every order will include a bracket with both TP and SL set at 50 pips (note: the algorithm only closes the current open position and does not enter the opposite trade once a TP or SL has been hit).
Rule 4 - When a new opposite trade signal is generated, the algorithm sends in a larger order to close the current open position as well as open a new one (for example: 14 consecutive Long Signals are generated over 8 hours and the algorithm sends in 10 different buy orders at various prices for a total of 350,000 contracts. A Short Signal is generated shortly after the 14th Long Signal. The algorithm then sends in a sell order for 400,000 contracts to close the 350,000 contracts long position and open a new short position of 50,000 contracts).

Forex Master v2.0 (EUR/USD)This is version 2 of my Forex Master algorithm originally posted here:
BACKTEST CONDITIONS:
Initial equity = $100,000 (no leverage)
Order size = 100% of equity
Pyramiding = disabled
TRADING RULES:
Long entry = EMA5(RSI20) cross> 50
Profit limit = 50 pips
Stop loss = 50 pips
Short entry = EMA5(RSI20) cross< 50
Profit limit = 50 pips
Stop loss = 50 pips
Long entry = Short exit
Short entry = long exit
DISCLAIMER: None of my ideas and posts are investment advice. Past performance is not an indication of future results. This strategy was constructed with the benefit of hindsight and its future performance cannot be guaranteed.
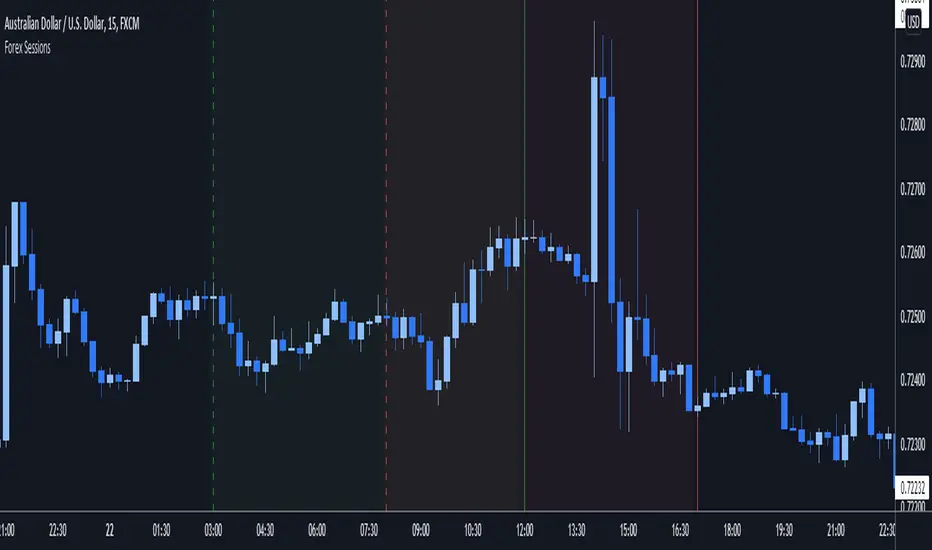
Forex Session OverlapApplies gray background coloring for each major active Forex session, the more sessions active the lighter the background. Adjusted coloring for low (Sydney, Tokyo) and high (Frankfurt, London, New York) liquidity. Market opening hours for Sydney, Tokyo, Frankfurt, London and New York have been set to 08:00 - 17:00 local time and are converted to EST while taking daylight saving time into account across regions (REMEMBER: configure manually!). Sessions can be turned on or off separately. By default this indicator hides itself in larger time-frames (>30min by default). Enabling session breaks or daily pivots helps distinguish between sessions.
Forex SWING TraderThis strategy is mainly designed for swing trading applied to FOREX.
In this case we make use of 2 moving averages but with different time frame, lets say 1h and 1 day.
When they cross above we would initially have a long trade, but in this strategy we trade it in reverse, so we would actually enter a short position.
The same for short trade.
At the same time we make use of hours for entry, so we can filter even better between the trades, and select the best possible hours for entries.
For exit we have 2 conditions : one is when we receive an opposite signal ( by default ).
The other is when a certain movement between moving averages, like lets say 1% of price movement, we will exit. This can act both as TP and SL.

Forex Session High/Low TrackerThis indicator maps out each Forex session along with their relative highs and lows.

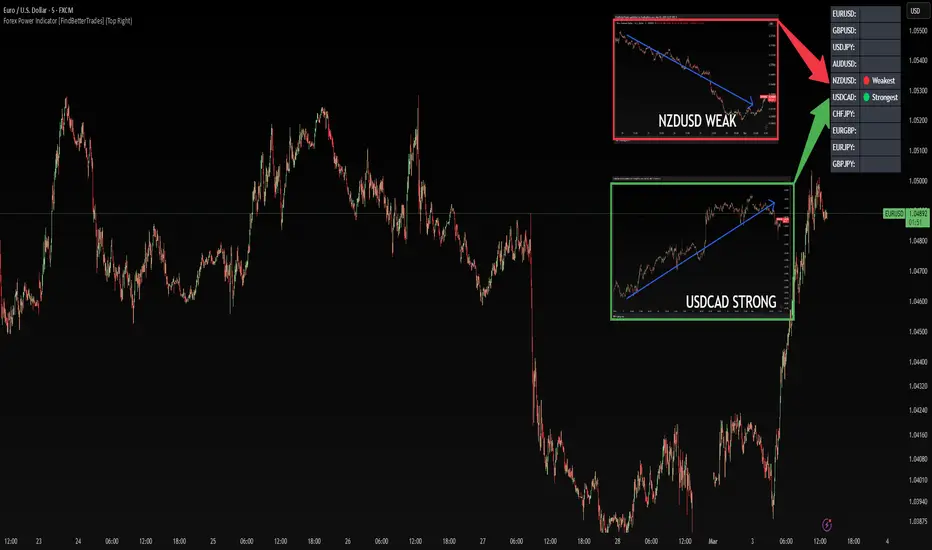
Forex Power Indicator [FindBetterTrades]The Forex Power Indicator is designed to help traders quickly assess the relative strength and weakness of key forex pairs over a set period.
This tool calculates the percentage change in price over the last 5 days and highlights the strongest and weakest performing pairs in a simple table format.
Features:
Scans 10 major forex pairs (EURUSD, GBPUSD, USDJPY, AUDUSD, NZDUSD, USDCAD, CHFJPY, EURGBP, EURJPY, GBPJPY).
Calculates the percentage change over the last 5 days.
Identifies and labels the strongest and weakest pair based on performance.
Displays results in a customizable table, allowing traders to quickly interpret market trends.
How to Use:
The strongest pair (🟢) indicates the currency with the highest performance in the selected period.
The weakest pair (🔴) shows the currency that has lost the most value.
Alerts feature:
Once you add the script to your chart, go to "Create Alert"
Under "Condition", select "Forex Power Indicator ".
The system will use the messages set in the alert() function.
When triggered, the alert will display the message like:
"New strongest currency pair: USDJPY"
"New weakest currency pair: AUDUSD"
Use this information to spot momentum opportunities, potential reversals, or trend continuations in forex trading.
This indicator is for informational purposes only and should be used alongside other technical analysis tools to support trading decisions.
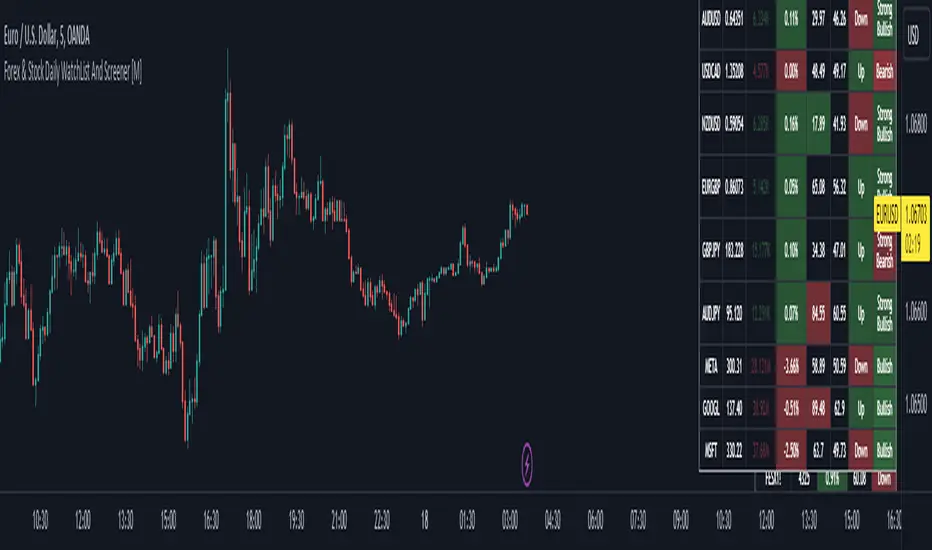
Forex & Stock Daily WatchList And Screener [M]Hi, this is a watchlist and screener indicator for Forex and Stocks.
This indicator is designed for traders who trade in the forex markets and monitor developments in indices and other currency pairs.
It includes information on 14 indices such as the volatility index, Baltic dry index, etc. You can customize the indices as you wish. The indices table contains the index's price (or points), daily change, stochastic value, and trend direction.
The second table is designed for trading forex and stock currency pairs.
In this table, you will find information such as price, volume, change, stochastic, RSI, trend direction, and MACD result for all traded pairs. You can customize all the currency pairs in this table as you wish, and you can also tailor the oscillator settings to your preferences.
In the settings section, you can use checkboxes to hide the pairs in both tables.
The "Customize" section in the settings allows you to personalize the table appearances according to your preferences.
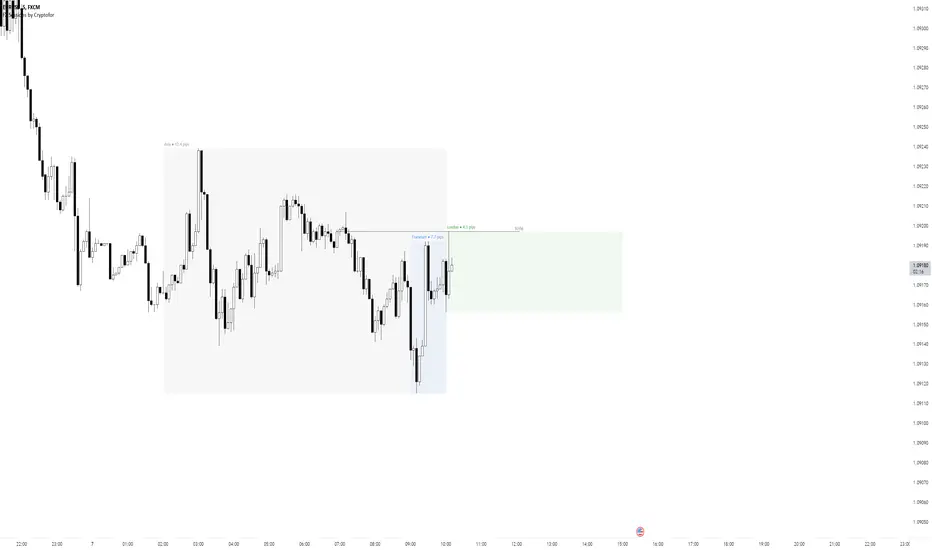
forex session - Opening-Range- JayyMy first try on anything forex. Let me know if it needs adjustment.
This is Opening Range for forex
Targets set at 127% , 162%, 200 %, 262 %, 362%, 423%, 685%, 1109% and 1794%
of the selected opening range. You can adjust targets as you like in the dialogue box
362%, 423%, 685%, 1109% and 1794% levels will not show unless selected in the dialogue box.
Check any one (only one) of the time periods to change the opening range period to suit.
New York opens at 8:00 am to 5:00 pm EST (EDT)
Tokyo opens at 7:00 pm to 4:00 am EST (EDT)
Sydney opens at 5:00 pm to 2:00 am EST (EDT)
London opens at 3:00 am to 12:00 noon EST (EDT)
Because the actual forex day starts at 5pm it is not possible to plot some time periods correctly
ie try 120 minutes on the New York session. (Although this is not a problem with the other sessions)
If you keep to an hour or less and use periods that divide evenly into an hour all will be fine. All periods will actually work but will start looking a little funny.
No such problem occurs if you just use 5pm est to 5 pm est. other sessions could be put in as options or hard wired in with a few lines of script changes
There is an option in the dialogue box to display fib targets within Opening Range itself.
In the far past I adapted some original work created by Chris Moody from a 7-07-2014 script - there have been multiple adaptations . The script layout/ structure remains similar and messages regarding targets achieved (lines 224 - 230) are from the original script. In the original Chris gave Special Thanks To "The Coding Genius Behind The Curtain" - so hat tip to both.

Forex Session + Volume Profile [RunRox]📊 Forex Session + Volume Profile is built especially for traders who work with intra-session liquidity concepts or any strategy that needs a clear visual of trading sessions and the liquidity inside them.
Our team created this indicator to give you better session visibility, flexible session styling, and extra tools that help you navigate the market more easily.
📌 Features:
6 fully customizable sessions
Kill Zone (the high-impact trading window)
Volume Profile for each session
POC / VAL / VAH / LVN levels (Point of Control, Value Area Low, Value Area High, Low Volume Node)
PDH / PDL levels (Previous Day High / Low)
PWH / PWL levels (Previous Week High / Low)
NYM level (New York Market level)
Active sessions table
5 style options for each session
All of this gives you the flexibility to set up exactly the layout you need for your trading. Below, you’ll find a more detailed look at each feature.
🗓️ 6 CUSTOMIZABLE SESSION
The indicator includes six sessions that you can fully customize to fit your needs—everything from naming each session and choosing line colors to adjusting opacity, showing the volume profile, or even turning off a session entirely if you don’t need it.
Plus, you can pick different display styles for each session. As shown in the screenshot below, there are five style options you can apply individually to every session.
5 Style Options for Sessions
BOX
AREA
ZONES
LINES
CURVED
These styles can be customized for each session individually to help you highlight the sessions you care about on your chart. Example below
📢 VOLUME PROFILE
We’ve also integrated a Volume Profile into the indicator to pinpoint important levels on the chart. On top of that, we’ve added extra volume-based levels. Below, you’ll find the settings and a visual demo of how it appears on your chart.
To identify optimal entry points, you can use the following key reference levels:
POC (Point of Control)
VAL (Value Area Low)
VAH (Value Area High)
LVN (Low Volume Node)
You can also customize colors and line styles, or hide any levels you don’t need on your chart.
📐 ADDITIONAL LEVELS
You can display the following levels on your chart:
NYM (New York Market)
PDH (Previous Day High)
PDL (Previous Day Low)
PWH (Previous Week High)
PWL (Previous Week Low)
All of these are fully customizable with color selection and the option to extend lines into the next period.
💹 ACTIVE SESSION TABLE
The active sessions table helps you quickly identify the trading times for the sessions you care about. It’s fully customizable, with options to choose border and background colors for the table itself.
🟠 USAGE
This indicator is highly versatile: use it to simply mark trading sessions on your chart, set up the Kill Zone at your chosen time, or identify the context of the previous session by its most traded range levels. All of this makes the indicator an invaluable tool for any trader!

Forex Heatmap█ OVERVIEW
This indicator creates a dynamic grid display of currency pair cross rates (exchange rates) and percentage changes, emulating the Cross Rates and Heat Map widgets available on our Forex page. It provides a view of realtime exchange rates for all possible pairs derived from a user-specified list of currencies, allowing users to monitor the relative performance of several currencies directly on a TradingView chart.
█ CONCEPTS
Foreign exchange
The Foreign Exchange (Forex/FX) market is the largest, most liquid financial market globally, with an average daily trading volume of over 5 trillion USD. Open 24 hours a day, five days a week, it operates through a decentralized network of financial hubs in various major cities worldwide. In this market, participants trade currencies in pairs , where the listed price of a currency pair represents the exchange rate from a given base currency to a specific quote currency . For example, the "EURUSD" pair's price represents the amount of USD (quote currency) that equals one unit of EUR (base currency). Globally, the most traded currencies include the U.S. dollar (USD), Euro (EUR), Japanese yen (JPY), British pound (GBP), and Australian dollar (AUD), with USD involved in over 87% of all trades.
Understanding the Forex market is essential for traders and investors, even those who do not trade currency pairs directly, because exchange rates profoundly affect global markets. For instance, fluctuations in the value of USD can impact the demand for U.S. exports or the earnings of companies that handle multinational transactions, either of which can affect the prices of stocks, indices, and commodities. Additionally, since many factors influence exchange rates, including economic policies and interest rate changes, analyzing the exchange rates across currencies can provide insight into global economic health.
█ FEATURES
Requesting a list of currencies
This indicator requests data for every valid currency pair combination from the list of currencies defined by the "Currency list" input in the "Settings/Inputs" tab. The list can contain up to six unique currency codes separated by commas, resulting in a maximum of 30 requested currency pairs.
For example, if the specified "Currency list" input is "CAD, USD, EUR", the indicator requests and displays relevant data for six currency pair combinations: "CADUSD", "USDCAD", "CADEUR", "EURCAD", "USDEUR", "EURUSD". See the "Grid display" section below to understand how the script organizes the requested information.
Each item in the comma-separated list must represent a valid currency code. If the "Currency list" input contains an invalid currency code, the corresponding cells for that currency in the "Cross rates" or "Heat map" grid show "NaN" values. If the list contains empty items, e.g., "CAD, ,EUR, ", the indicator ignores them in its data requests and calculations.
NOTE: Some uncommon currency pair combinations might not have data feeds available. If no available symbols provide the exchange rates between two specified currencies, the corresponding table cells show "NaN" results.
Realtime data
The indicator retrieves realtime market prices, daily price changes, and minimum tick sizes for all the currency pairs derived from the "Currency list" input. It updates the retrieved information shown in its grid display after new ticks become available to reflect the latest known values.
NOTE: Pine scripts execute on realtime bars only when new ticks are available in the chart's data feed. If no new updates are available from the chart's realtime feed, it may cause a delay in the data the indicator receives.
Grid display
This indicator displays the requested data for each currency pair in a table with cells organized as a grid. Each row name corresponds to a pair's base currency , and each column name corresponds to a quote currency . The cell at the intersection of a specific row and column shows the value requested from the corresponding currency pair.
For example, the cell at the intersection of a "EUR" row and "USD" column shows the data retrieved for the "EURUSD" currency pair, and the cell at the "USD" row and "EUR" column shows data for the inverse pair ("USDEUR").
Note that the main diagonal cells in the table, where rows and columns with the same names intersect, are blank. The exchange rate from one currency to itself is always 1, and no Forex symbols such as "EUREUR" exist.
The dropdown input at the top of the "Settings/Inputs" tab determines the type of information displayed in the table. Two options are available: "Cross rates" and "Heat map" . Both modes color their cells for light and dark themes separately based on the inputs in the "Colors" section.
Cross rates
When a user selects the "Cross rates" display mode, the table's cells show the latest available exchange rate for each currency pair, emulating the behavior of the Cross Rates widget. Each cell's value represents the amount of the quote currency (column name) that equals one unit of the base currency (row name). This display allows users to compare cross rates across currency pairs, and their inverses.
The background color of each cell changes based on the most recent update to the exchange rate, allowing users to monitor the direction of short-term fluctuations as they occur. By default, the background turns green (positive cell color) when the cross rate increases from the last recorded update and red (negative cell color) when the rate decreases. The cell's color reverts to the chart's background color after no new updates are available for 200 milliseconds.
Heat map
When a user selects the "Heat map" display mode, the table's cells show the latest daily percentage change of each currency pair, emulating the behavior of the Heat Map widget.
In this mode, the background color of each cell depends on the corresponding currency pair's daily performance. Heat maps typically use colors that vary in intensity based on the calculated values. This indicator uses the following color coding by default:
• Green (Positive cell color): Percentage change > +0.1%
• No color: Percentage change between 0.0% and +0.1%
• Bright red (Negative cell color): Percentage change < -0.1%
• Lighter/darker red (Minor negative cell color): Percentage change between 0.0% and -0.1%
█ FOR Pine Script™ CODERS
• This script utilizes dynamic requests to iteratively fetch information from multiple contexts using a single request.security() instance in the code. Previously, `request.*()` functions were not allowed within the local scopes of loops or conditional structures, and most `request.*()` function parameters, excluding `expression`, required arguments of a simple or weaker qualified type. The new `dynamic_requests` parameter in script declaration statements enables more flexibility in how scripts can use `request.*()` calls. When its value is `true`, all `request.*()` functions can accept series arguments for the parameters that define their requested contexts, and `request.*()` functions can execute within local scopes. See the Dynamic requests section of the Pine Script™ User Manual to learn more.
• Scripts can execute up to 40 unique `request.*()` function calls. A `request.*()` call is unique only if the script does not already call the same function with the same arguments. See this section of the User Manual's Limitations page for more information.
• Typically, when requesting higher-timeframe data with request.security() using barmerge.lookahead_on as the `lookahead` argument, the `expression` argument should use the history-referencing operator to offset the series, preventing lookahead bias on historical bars. However, the request.security() call in this script uses barmerge.lookahead_on without offsetting the `expression` because the script only displays results for the latest historical bar and all realtime bars, where there is no future information to leak into the past. Instead, using this call on those bars ensures each request fetches the most recent data available from each context.
• The request.security() instance in this script includes a `calc_bars_count` argument to specify that each request retrieves only a minimal number of bars from the end of each symbol's historical data feed. The script does not need to request all the historical data for each symbol because it only shows results on the last chart bar that do not depend on the entire time series. In this case, reducing the retrieved bars in each request helps minimize resource usage without impacting the calculated results.
Look first. Then leap.

Forex Relative Strength MatrixTraders often feel uncertain about which Forex pair to open a position with. This indicator is designed to help in that regard.
This indicator was created as described in the book Swing Trading with Heiken Ashi and Stochastics. In the original, the author suggests using it for swing trading. The author recommends applying it to a monthly chart with an 8-period moving average to analyze the context.
The logic of the indicator is to measure the relative strength of each currency by checking if the price of each Forex pair is above or below a chosen moving average. If the price is above the moving average, the base currency is awarded 1 point, indicating strength. If below, it scores 0, indicating weakness. By accumulating points across multiple pairs, the indicator ranks currencies from strongest to weakest, helping traders identify potential pairs for trading.
Trend Identification:
After identifying relative strength, the trader should observe the general trend using a 100-period SMA on 4-hour charts. If the price is above the SMA, the trend is bullish; if below, it is bearish.
Buy Logic:
A buy is triggered when the base currency is strong (price is above the moving average) and the quote currency is weak (price is below the moving average). After identifying the trend direction, the entry is confirmed by a color change in Heiken Ashi candles (from red to green in an uptrend) and a stochastic crossover in the trend’s direction.
Sell Logic:
A sell is triggered when the base currency is weak (price is below the moving average) and the quote currency is strong (price is above the moving average). The sell entry is confirmed by a color change in Heiken Ashi candles (from green to red in a downtrend) and a stochastic crossover aligned with the trend.
Entry Chart:
The entry chart used is the 4-hour chart. The trader should look for entry signals following a pullback in the trend direction, using Heiken Ashi candles. Entry is made when the Heiken Ashi candles change color (from red to green in an uptrend) and there is a smooth crossover of the stochastic indicator in the trend’s direction.
It would also be possible to adapt the indicator for day trading strategies with targets of 1 to 2 days. Here is a recommended setup:
Relative Strength Identification (1-Hour Chart):
Instead of monthly charts, use a 1-hour chart to identify currency strength with a 20-period moving average.
The 20-period moving average on the 1-hour chart captures a balanced view of short- to medium-term direction, covering nearly a day’s worth of trading but with enough sensitivity for day trading.
General Trend (5-Minute Chart with 100 SMA):
On the 5-minute chart, observe the 100-period SMA to identify the general trend direction throughout the day.
Price above the 100 SMA indicates an uptrend, and below indicates a downtrend, confirming the movement in shorter timeframes.
Entry Chart and Signals (5-Minute Chart):
Use the 15-minute chart to look for entry opportunities, focusing on pullbacks in the main trend direction.
Entry Signals: Enter the position when Heiken Ashi candles change color in the trend direction (from red to green in an uptrend) and the stochastic indicator makes a smooth crossover in the trend’s direction.

Forex Session Tracker [MacroGlide]Forex Session Tracker is a tool designed to track and visualize trading activity across the four key Forex market sessions: New York, London, Tokyo, and Sydney. The indicator helps traders see the time intervals of each session, their impact on price movements, and analyze volatility within these sessions.
Key Features:
• Session Visualization: The indicator highlights price ranges during the New York, London, Tokyo, and Sydney sessions using different colors, making data easier to visually interpret and analyze. Users can customize the color scheme for each session.
• Price Change Analysis: The indicator tracks the opening prices of each session and calculates the price changes by the session's close. This allows traders to assess market dynamics within each session and make informed trading decisions.
• Average Price Changes: The average price change for a specified number of sessions is calculated for each session, helping to identify trends and volatility levels.
• Time Zone Support: The indicator takes into account time zones, allowing users to adjust the display according to their location or use the market's time zone.
• Interactive Dashboard: The built-in dashboard shows the status of each session in real-time (active or inactive), recent price changes, and average changes, providing quick access to key information directly on the chart.
How to Use:
• Add the indicator to your chart and configure the displayed sessions according to your needs.
• Use color differentiation to easily identify active trading sessions and assess their impact on price movements.
• Monitor price changes in each session and analyze averages for a deeper understanding of market trends.
Methodology:
The indicator uses the time intervals of each trading session to calculate and display opening prices, price ranges, and price changes for the session. Based on this data, the Forex Session Tracker visualizes the session's high and low prices and calculates the average price change over the last several sessions. All data is displayed in real-time, considering the user's time zone settings or the market's time zone.
Originality and Usefulness:
Forex Session Tracker stands out for its ability to combine price change information from several key trading sessions into one indicator, providing traders with a simple and clear way to analyze market activity across different time zones.
Charts:
The indicator displays clean and clear charts, where each trading session is highlighted with its own color, making visual interpretation easier. The charts focus only on essential information for analysis: opening prices, session ranges, and price changes. The integrated dashboard provides quick access to key session metrics, such as activity status, recent price changes, and average values for the selected period. These features make the charts highly useful for rapid analysis and trading decision-making.
Enjoy the game!

[Forex Fondamental Overview SGM]Fundamental analysis tool designed for currency trading in financial markets. The script generates a dashboard that displays key economic indicators for two selected currencies. Here is what makes this script particularly interesting for a trader:
1. Direct comparison between two currencies: The script allows you to choose two currencies (from a predefined list) and directly compare their key economic indicators such as interest rate, GDP growth, debt-to-GDP ratio, unemployment rate, inflation (CPI and PPI), and the services and manufacturing PMI indices. This gives you immediate insight into the economic strengths and weaknesses of each currency, which is crucial for making informed trading decisions.
2. Automatic data updating: Indicator values are updated automatically using security requests (request.security) that pull the most recent data available. This means you don't need to manually update data or check multiple sources; the script takes care of that for you.
3. Currency Relative Strength Calculation: The script calculates a strength index for each currency based on its economic indicators, and then it determines a relative strength index for the currency pair. This allows you to quickly see which currency is currently strongest, providing a basis for "buy strength, sell weakness" trading strategies.
4. Intuitive visualization: Results are presented in clear tables with colored indicators, making the information quickly digestible. For example, the background color changes depending on the relative strength of the currency pair, giving you an immediate visual signal of the overall trend.
5. Adaptability to different trading strategies: Whether you are a swing trader, a day trader, or a scalper, understanding the economic state of currencies can help you align your trading positions with underlying macroeconomic trends. This script gives you this information without requiring detailed economic analysis on your part.
In short, this script is a powerful tool for any Forex trader who wants to integrate fundamental analysis into their trading routine without bothering with the complexity of tracking and analyzing a multitude of economic indicators manually.

Forex Sessions by CryptoforForex Sessions Boxes
Killzones are the period of greatest volatility, and volatility is one of the main factors for finding the optimal trade time (OTT/Optimal Trade Time). That is, in a period of high volatility, we as traders have the most chances to open a good position, and at the same time not to sit on the charts for too long waiting for its closing.
Sessions:
1. Asian Session:
2. Frankfurt Session:
3. London Session:
3. New York Session:
Features:
Time zone change
Session time change
Show/hide Historical Data
Show/hide Pips
Show/hide Previous Day High/Low
Show/hide New York Midnight/True Daily Open
Text size and align customization
Borders style
Line and border sizes
Full customization of colors: borders, price lines, text, background
FOREX MASTER PATTERN Companion ToolWhat This Indicator Does
The Forex Master Pattern uses candlesticks, which provide more information than line, OHLC or area charts. For this reason, candlestick patterns are a useful tool for gauging price movements on all time frames. While there are many candlestick patterns, there is one which is particularly useful...
The Engulfing Pattern
An engulfing pattern provides an excellent trading opportunity because it can be easily spotted and the price action indicates a strong and immediate change in direction. In a downtrend, an up candle real body will completely engulf the prior down candle real body (bullish engulfing). In an uptrend a down candle real body will completely engulf the prior up candle real body (bearish engulfing).
Used in conjunction with the FOREX Master Pattern value line, the Engulfing Pattern can assist the trader with reversal timing or trend confirmation during the expansion and trend phases.
As shown in the screenshot below. Engulfing Candles usually precede a sharp move in price in the direction of the engulfing candle.
As shown in the screenshot below, when the Show Lines option is ON while using the indicator, both red and green lines are drawn on the chart automatically when engulfing candles form. These lines are projected forward 100 bars and tend to be reliable support and resistance areas. These areas are typically hidden from view.
In addition to the Show Lines option, the indicator (by default) creates boxes around trading zones that are created when an engulfing candle is formed. (There is an option to hide these from view if desired).
As seen in the screenshot below, these areas / zones are wider than a line and encompass a resistance / support zone rather than a specific price. Liquidity is usually high in these areas and a lot of selling / buying occurs here. These zones are drawn in advance out into the future giving the trader an idea of where price will revert to eventually.
A combination of LINES and AREAS can be used giving the user a better idea of where within the zone price will go.
As seen on the screenshot below, this combination provides a pretty accurate indication of the reversal point well in advance.
As seen in the screenshot below, when a ZONE / AREA has been fully breached (crossed) by price, the area is deactivated an no longer continues forward on the chart. Until price breaches an area, it remains valid and continues on the chart until and only if it is breached by price.
The Indicator is fully customizable.
The use can change the color of the engulfing candles, the color of the zones, transparency etc. You can turn OFF or ON any of the features such as lines, zones, bar coloring, and plotted arrows.
I really hope you get value from this indicator and... HAPPY TRADING!!

Forex Dogs Moving Averages with Distance TableThis is an indicator based on the book【Forex】ForexDog’s Vacuum Zone Trading 2021: Trading Strategy to “not lose” based on Experience and Logic written by Forex Dog (yes, this is his author name on Amazon; he is a trader popular mostly in Japan). It consists of simple moving averages which should somewhat correspond to the higher timeframes moving averages. The original was traded on a 15m chart and the periods are as follows: 5, 20, 40, 50, 80, 100, 200, 400, 640, 1600, 1920, 3200.
Then, there is a big table with a distances overview. This should give you an idea of how far each average is in ticks. The minus in front of the ticks_total signifies direction.
I expect some feedback on this because I don't think the user convenience is very with tables being so bright. My goal is to create a system that limits the number of "noodles" on the chart but still carries the information via the tables on the side.
Moving Average Length is not adjustable by design. The book says to use these quite explicitly, although the logic would work just fine with some other levels, it would not be the original strategy.
Good luck!

Forex Fractal EMA ScalperThis is a forex scalper designed for very short timeframes 1-5 min max.
At the same time due to the short timeframe, is recommend to re optimize it weekly .
Its components are
Fractals
Triple EMA with different lengths
Rules for entry:
For long : we have an up fractal and all 3 ema are in ascending order
For short: we have a down fractal and all 3 ema are in descending order.
Rules for exit
We exit when we either get a reverse order or when we hit the take profit or stop loss calculated in fixed pips.

Forex Session Volume ExplorerFigure out the best time to trade your favorite Currency Pair, Commodity, or Crypto!
This indicator is an exploration of how Forex Sessions affect volume. The colored plots below represent the accumulative volume during each of the four major trading sessions: London, New York, Tokyo, and Sydney.
Plots have been normalized as a percentage of total volume, i.e. London = 34.2 signifies that 34.2% of all volume occurs during the London Session.
Trading the session with the highest volume will greatly benefit your Win Rate, especially when using "typical" indicators and strategies.
Use in conjunction with my previous tool for a clean & customizable visual representation of Forex Sesssions:
Forex Trading Sessions
Cheers,
EFX (@DasanC)

Forex Trading SessionsThere are a million Forex Trading Session indicators out there, but I couldn't find one with all of the following requirements:
1. Automatically show the Sessions that actually affect the current pair (for instance, Tokyo session doesn't matter when trading EURGBP)
2. Editable colors or at the very least no distracting colors
3. Editable times for each exchange session
4. Unique indication of the start of a session vs the end of a session. (Sometimes, I don't notice a background going from Navy Blue to Black)
This indicator has everything I could ever want in a Sessions Tool:
Subdued default colors
Editable colors
Editable session ranges
Obvious, but not obnoxious indication of start and stop
Automatically hide irrelevant Sessions
Cheers. EFX
Forex Scalping 1min Bollinger Bands, RSI and ADX Trading SystemThis is a Forex Scalping Trading Sytem based on the Bollinger Bands.
Its suited for major pairs, with lowest possible comission (below 1 pip) and with timeframes ranging between 1-15 min.
Indicators:
Bollinger bands
ADX
RSI
Rules for entry:
Long Entry: price to move below the upper Bollinger Bands RSI raise above the 30 line and ADX<32 at the same time.
Short Entry: price to move above the upper Bollinger Bands, RSI raise below the 70 line and ADX<32 at the same time.
Rules for exit
Profit Exit: 3 options: 1, exit position when the price touches the middle band, 2) when the price touches the opposite band, X pips target profit.
Loss Exit: X pips loss

Forex bot full strategy with risk managementThis is a full strategy designed for forex major pairs, specially EUR/USD using 1h time frame chart.
Its components are
200 EMA
MACD
OBV
PSAR
RIsk management with tp and sl movements
Rules for entry
For long = Previous histogram from MACD was below 0 and current one is above 0. CLose of a candle is above EMA 200 , OBV oscillator is negative and we have an uptrend from PSAR
For short = Previous histogram from MACD was above 0 and current one is below 0. CLose of a candle is below EMA 200 , OBV oscillator is positive and we have an downtrend from PSAR
Rules for exit
For tp and sl values we calculate the distance from the close of candle until the psar values.
If you have any questions, let me know !

Forex scalper 2xEMA + SRSI + MACDThis is a forex scalping strategy designed for the most liquid pairs, like major forex pairs.
Its made of
1 EMA 50
1 EMA 100
Stochastic RSI
MACD
Rules
For long :close of the candle is above moving average 50, moving average 50> moving average 100, macd histogram is positive and cross over of stochastic rsi with the oversold level.
For short :close of the candle is below moving average 50, moving average 50 < moving average 100, macd histogram is negative and cross under of stochastic rsi with the overbought level.
Exit
For exit we have take profit and stop loss using fixed pip points.
For this example on EURUSD we use 20 pips for both tp and sl
IF you have any questions let me know !
