[Yorsh] BJN MTF FVG/iFVG v1.01. Executive Summary
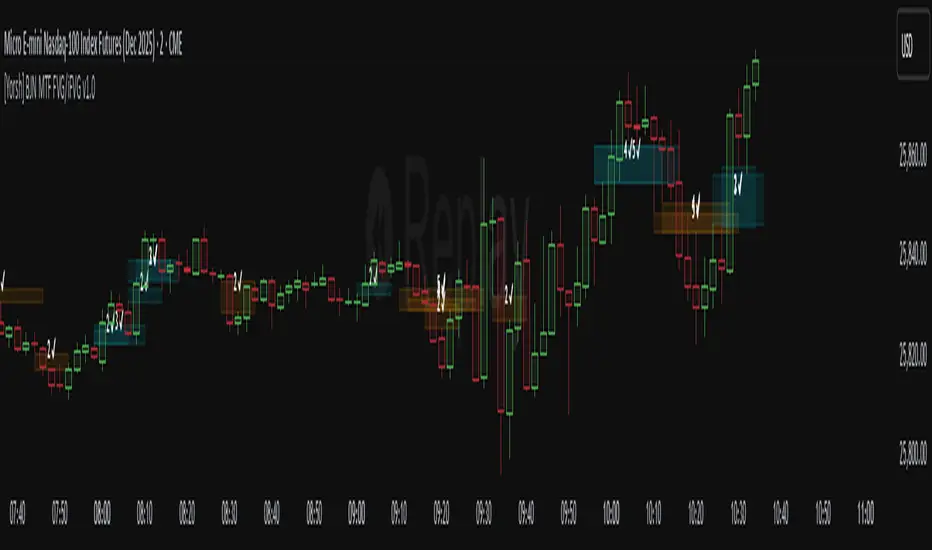
The BJN MTF FVG/iFVG v1.0 is a highly specialized and performance-optimized tool for TradingView that provides a multi-layered view of market imbalances. Built on the modern PineScript v6, its sole purpose is to detect and display Fair Value Gaps (FVGs) from up to five user-defined higher timeframes directly onto a single chart.
In a market saturated with "all-in-one" tools that slow down trading platforms, this indicator's primary competitive advantage is its unrelenting focus on speed and clarity. It is engineered from the ground up to be a lightweight, efficient, and "noise-reducing" utility. It provides traders with essential higher-timeframe context without the lag, clutter, or performance degradation typical of other multi-timeframe (MTF) indicators.
2. Core Features Overview
The indicator is designed with a "do one thing well" philosophy, concentrating on the accurate and efficient plotting of multi-timeframe FVGs.
A. Multi-Timeframe (MTF) FVG Plotting
Up to Five Custom Timeframes: You can monitor FVGs from any five timeframes of your choice (e.g., 1m, 3m, 5m, 15m, 1H) simultaneously, all from your main trading chart. This eliminates the need to constantly switch between charts to understand the broader market structure.
Clear Labeling: Each FVG box is cleanly labeled with its corresponding timeframe (e.g., "5 ✔"), so you can instantly identify its origin and significance.
B. Intelligent FVG Validation & Sizing
Dynamic Sizing Rules: The indicator intelligently validates FVGs based on their size in points. It automatically applies a larger minimum size requirement during the volatile NY session and a smaller requirement for non-NY hours, effectively filtering out minor, insignificant gaps and focusing only on meaningful imbalances.
Validity Markers: FVGs that meet the minimum size criteria are marked with a checkmark ("✔") and extended slightly into the future, signifying them as potent support/resistance zones. Undersized FVGs are marked with an "✖" and treated as potential areas of weakness.
C. Unique "iFVG" Noise Reduction
This is a key feature for maintaining a clean chart. The indicator tracks undersized, "invalid" FVGs and waits to see how the market reacts to them.
Automatic Deletion or Recolor: When the price closes through an invalid FVG (creating an "iFVG" or inverted FVG), the user has two choices:
Delete Box (Default): The box is automatically removed from the chart. This is the "Noise Reduction" mode, designed to keep the workspace free of irrelevant, broken levels.
Recolor Box: The box is recolored to a faded gray. This option is ideal for traders who want to backtest and study how these broken, minor FVGs behave as future support or resistance.
D. Smart Visibility Options
Prevents Duplication: The indicator includes an intelligent option to automatically hide an MTF box if its timeframe matches your current chart's timeframe. This is designed to work seamlessly with a Current Timeframe (CTF) FVG indicator, preventing redundant, overlapping boxes.
3. The Performance Advantage: A Lag-Free MTF Experience
Multi-timeframe indicators are notoriously resource-intensive and are the primary cause of chart lag on TradingView. The BJN MTF FVG indicator was specifically engineered to solve this problem, making it far superior to its competitors.
Optimized timeframe.change() Trigger: Instead of recalculating its logic on every single price tick, the script only runs its intensive request.security calls when a candle closes on the specified higher timeframe. This reduces the number of calculations by over 99% compared to poorly coded MTF indicators, resulting in a dramatic performance increase.
Strict Historical Limits: The user can define a maximum history lookback (in hours or minutes) for each timeframe. For example, the 1-minute chart might only process the last 4 hours of data. This prevents the indicator from drawing thousands of historical boxes that are no longer relevant, which is the main cause of platform freezing and slow loading times.
Lightweight State Management: The script maintains a very small, active list of only the invalid FVGs it needs to monitor for inversion. Valid FVGs are simply "fire-and-forget" drawings, meaning they don't consume ongoing memory or processing power.
In short, this indicator delivers the critical higher-timeframe context traders need without ever compromising the speed and responsiveness of your trading platform.
4. Ideal User Profile
This indicator is the perfect tool for:
Day Traders and Scalpers: Who need to be aware of higher-timeframe support and resistance levels without leaving their execution chart.
SMC / ICT Traders: Who use multi-timeframe FVG confluence as a core part of their trading strategy.
Performance-Focused Traders: Anyone who has experienced chart lag from other indicators and desires a clean, fast, and reliable toolkit.
Traders Seeking Clarity: Individuals who prefer a decluttered workspace and want an indicator that intelligently removes irrelevant information.
5. Conclusion
The BJN MTF FVG/iFVG v1.0 excels through its simplicity, intelligence, and exceptional performance. It rejects the "kitchen-sink" approach of other tools and instead provides a refined, highly optimized solution to one of the most important tasks in modern trading: analyzing multi-timeframe market structure. It is a faster, cleaner, and more intelligent way to map higher-timeframe liquidity.
Search in scripts for "fvg"
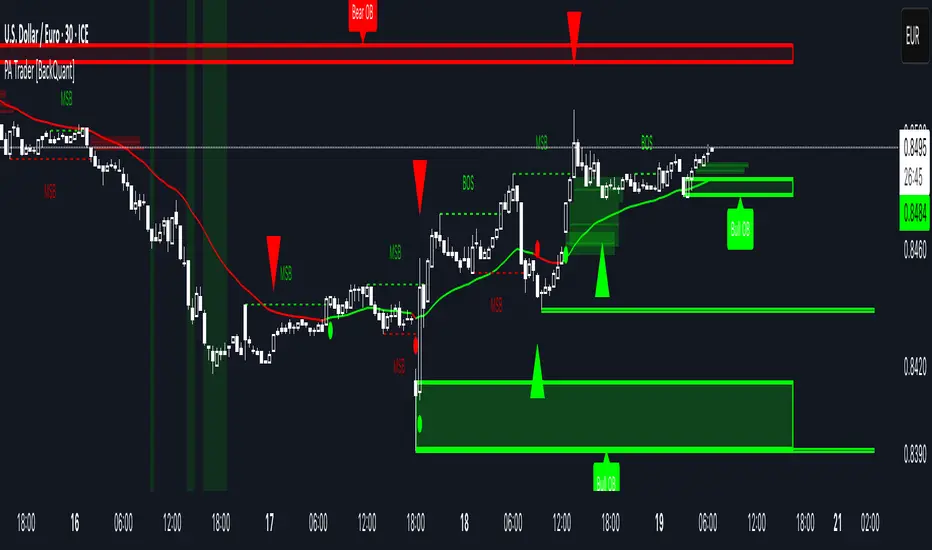
Price Action Trader [BackQuant]Price Action Trader
Introduction
Price Action Trader is an all-in-one, chart-side workflow for reading trend, timing impulses, and mapping high-probability zones the way discretionary traders actually trade. It blends an ensemble trend engine with clean price-action building blocks—Market Structure (BOS/MSB), Fair Value Gaps, Order Blocks, and Volumetric Support/Resistance—so you can form a bias, find confluence, and execute with context.
What is it
A modular “price-action stack” that:
Paints trend bias and impulse shifts on the chart (optional candle coloring).
Auto-annotates internal & swing structure (BOS / MSB).
Finds FVGs on your chosen timeframe and draws them cleanly.
Detects Order Blocks (with optional FVG confirmation).
Builds volumetric S/R levels that adapt to liquidity.
Emits alerts for key events (new levels, touches, breaks, OB creation/touch).
Everything is configurable—keep it minimal (trend + a few zones) or run the full toolkit.
What’s it used for
Bias first, trade second: establish direction/conviction, then execute where structure, gaps, blocks, and volume agree.
Timing: impulse flips and level touches provide actionable triggers.
Risk placement: OB edges, FVG midlines, and volumetric bands give logical stop/target references.
Review & journaling: optional session shading and labeled structures make post-trade notes simple.
Composite Trend Model
A lightweight signal line (default: 30-period) that turns green when the composite regime is bullish and red when bearish. Under the hood, multiple cues (adaptive momentum, de-noised oscillation, volatility-aware filters) are blended into a single directional score; when thresholds flip, the line recolors and optional Long/Short dots appear.
How to use
Treat the line as your bias rail : favor longs while green, shorts while red.
Flat/rapid flips = stand down or reduce size.
Prefer clean charts? Keep only the line and (optionally) trend-painted candles.
Inputs to know
Show Trend Signal Line / Width.
Paint Candles by Trend.
Long/Bearish color controls.
Impulse Model
Highlights short-term pressure shifts with optional impulse candle coloring and ▲/▼ markers. Great for entries in the prevailing trend and for early warnings when impulses fire against bias.
How to use
Up-bias: look for the next impulse-up near structure/FVG/OB or volumetric support.
Down-bias: mirror the logic.
Frequent counter-impulses → expect chop or regime change.
Inputs to know
Show Impulse Signals.
Paint Impulse Candles.
Market Structure
Automatic Internal (tight lookback) and Swing (wider lookback) structure with BOS and MSB (CHoCH) labels. You decide what to show—All, BOS only, MSB only—independently for internal vs swing.
How to use
Use Swing labels for the primary map; Internal for entry refinement.
After a bullish MSB , seek the first HL back into support/FVG/OB.
After a bearish BOS , favor LH fades into resistance/FVG/OB.
Inputs to know
Swing Lookback / Internal Lookback.
Swing/Internal Structure: All | BOS | MSB | None .
Separate bull/bear color controls for both layers.
Fair Value Gaps
Detects bullish/bearish FVGs on the current or higher TF, draws boxes, and can extend them forward. Midlines provide quick visual targeting.
How to use
In-trend fills: in an up-bias, tags of bullish FVGs often offer high-quality continuation entries, especially with structure/OB confluence.
Failed fills: rejections at the midline can signal emerging strength/weakness.
Inputs to know
Show FVG / Show Last N / Extend.
Timeframe (blank = chart TF; set higher TF for macro FVGs).
Bull/Bear colors (tune opacity to taste).
Volumetric Support and Resistance
Builds adaptive S/R from price interaction + relative volume over a rolling lookback. Levels store touch counts; you can show volume stats on labels or inside boxes. Transparency and border thickness can scale with volume so stronger levels are visually louder. Broken levels can auto-remove.
How to use
Use as confluence with structure, OBs, and FVGs. A long at volumetric support + Bull OB + FVG midline is qualitatively different from a naked level.
If a level breaks on strong volume, stop fading—flip expectations or wait for a clean retest.
Inputs to know
Detection Sensitivity / Volume Multiplier.
Analysis Period / Max Levels / Min Distance (%).
Remove Broken / Extend Right / Show Volume Info / Text Inside.
Support/Resistance colors (+ high-vol variants).
Alerts
New Support/Resistance Level Created.
Level Touch.
Level Break.
Order Blocks
Detects bullish/bearish OBs using configurable fractals (3- or 5-bar) with a break confirmation (by Close or High/Low). Optional FVG proximity filter, right-extension, and auto-delete when filled.
How to use
Bullish bias: stalk pullbacks into fresh Bull OBs aligned with a bullish FVG or volumetric support.
If price fills an opposing OB and fails to continue, reassess bias—context may be shifting.
Inputs to know
Fractal Type & Break Method (Close / HL).
Filter with FVG + Max FVG Distance.
Extend Blocks / Delete When Filled / Show Labels.
Alerts
New Order Block Created.
Order Block Touch.
Final Notes
Suggested workflow
Start with Composite Trend (bias).
Mark Swing structure in that direction.
Wait for an Impulse in-direction near an OB / FVG / Volumetric level.
Risk = nearest opposite level or OB edge; targets = FVG midlines / next S/R.
Timeframes & assets
Defaults suit liquid intraday and 1–4H swing.
Slower markets → lengthen lookbacks, lower sensitivity.
Very noisy crypto → keep trend visible, trim drawings (e.g., MSB only, last 3–5 FVGs, 8–12 volume levels).
Keep it readable
Turn off modules you don’t need today—fewer, higher-quality signals beat clutter.
About this release
Internal scoring, smoothing, and detection logic are proprietary. Behavior is controlled via inputs described above.
Trade with a plan, test your settings, and let confluence do the heavy lifting.
ICT First FVG - 9:30am & Custom (v4)ICT First FVG - 9:30am & Custom Time Ranges (v4)
📖 DESCRIPTION
This comprehensive Pine Script indicator identifies and displays Fair Value Gaps (FVGs), Volume Imbalances (VIs), and Liquidity Voids (LVs) based on Inner Circle Trading (ICT) concepts. The indicator offers dual functionality: traditional 9:30am New York session FVG detection and customizable time range analysis for maximum flexibility.
🚀 KEY FEATURES
Dual Detection System
9:30am NY Open FVG: Classic ICT first presentation detection after market open
Custom Time Range FVG: User-configurable time periods for specialized analysis
Independent Operations: Both systems work simultaneously without interference
Separate Controls: Each system has its own settings and previous days configuration
Advanced Gap Detection
Fair Value Gaps (FVG): Three-candle patterns showing price inefficiencies
Volume Imbalances (VI): Single candle volume-related gaps
Liquidity Voids (LV): Areas where price moved too fast, creating liquidity gaps
Consequent Encroachment (CE): Midpoint lines of detected inefficiencies
Precision Sizing System
Multi-Asset Support: Automatic point/pip calculation for Forex, Futures, and Indices
Forex Handling: Specialized pip calculation for major pairs and JPY crosses
Size Filtering: Minimum gap size filter to eliminate noise
Real-Time Display: Shows exact gap sizes in labels (e.g., "15.3 pips" or "12.7 pts")
Professional Visualization
Dual Display Modes: Choose between solid blocks or line representations
Color Coding: Different colors for current vs. previous day imbalances
Smart Labels: Configurable date, time, type, and size information
Extension Options: Extend gaps to session end or current bar
M1 Data Integration
High Accuracy: Uses 1-minute data regardless of chart timeframe
Better Detection: More precise gap identification on higher timeframes
Flexible Usage: Works on any timeframe ≤15 minutes
⚙️ CONFIGURATION GUIDE
General Settings
Visualization Type: Choose "Blocks" for filled areas or "Lines" for boundaries
Previous Days: Number of historical days to display (0 = today only)
Extend Imbalances: Project gaps to session end or current bar
Use M1 Data: Recommended ON for better accuracy
FVG Size Filter
Minimum FVG Size: Filter out gaps smaller than specified points
Enable Filter: Toggle size filtering on/off
🎯 RECOMMENDED MINIMUM SIZES:
USD/JPY: 0.01 points (1 pip)
Gold (XAUUSD): 1.6 points
NQ (Nasdaq-100): 0.2 points
Nasdaq CFD: 2.0 points
Other instruments: Experiment and discover optimal values
Custom FVG System
Enable Custom FVG: Activate secondary time range detection
Custom Time Range: Use session format (e.g., "1430-1600" for 2:30-4:00 PM)
Custom Previous Days: Independent historical period for custom ranges
Custom Label Color: Distinct color for custom time range gaps
Delete Default FVG 9:30: Use when running multiple instances with different timeframes
Imbalance Types
Fair Value Gaps: Main three-candle inefficiency patterns
Include Open/Close Gap: Additional gap calculation method
Volume Imbalances: Single-candle volume-based gaps
Liquidity Voids: Fast price movement gaps
C.E. (Consequent Encroachment): Midpoint reference lines
Label Customization
Show Labels: Toggle date/time information display
Include Time: Add timestamp to labels
Include Type: Display gap type (FVG, VI, LV)
Include Size: Show calculated gap size in points/pips
Position: Configure label placement (left/center/right, top/center/bottom)
Size & Color: Customize label appearance
Visual Styling
Colors: Separate colors for FVG, VI, LV types
Previous Day Colors: Distinct styling for historical gaps
Border Styles: Solid, dashed, or dotted borders
Line Widths: Configurable border thickness
📊 TECHNICAL SPECIFICATIONS
Supported Markets
Forex: All major and minor pairs with proper pip calculation
Futures: ES, NQ, YM, RTY, GC, SI, CL, etc.
Indices: SPX, NDX, DJI, and CFD versions
Stocks: Individual equities (adjust size filter accordingly)
Time Frame Compatibility
Recommended: 1m, 3m, 5m, 15m charts
Maximum: 15-minute timeframe
Optimal: 1m or 5m for best precision
Session Handling
Timezone: America/New_York (Eastern Time)
Default 9:30am: Standard NY market open detection
Custom Sessions: Any time range using HHMM-HHMM format
Weekend Filtering: Automatic exclusion of non-trading days
🔧 USAGE INSTRUCTIONS
Basic Setup
Add indicator to chart (≤15m timeframe recommended)
Enable "Use M1 Data" for accuracy
Set "Minimum FVG Size" based on instrument (see recommendations above)
Configure "Previous Days Imbalances" (5 is good default)
Custom Time Range Setup
Enable "Enable Custom FVG"
Set "Custom Time Range" (e.g., "1430-1600" for 2:30-4:00 PM ET)
Adjust "Custom Previous Days" as needed
Choose distinct "Custom Label Color" for easy identification
Multiple Instance Usage
Add indicator multiple times for different time ranges
Enable "Delete Default FVG 9:30" on additional instances
Use different custom time ranges for each instance
Assign unique colors to distinguish between instances
Label Optimization
Enable size display to see gap magnitude
Position labels to avoid chart clutter
Use appropriate label size for your screen resolution
Consider disabling time display on crowded charts
🎯 PRACTICAL APPLICATIONS
ICT Trading Concepts
First Presentation: Initial FVG after 9:30am NY open
Return to Gap: Price revisiting inefficiency areas
Mitigation Levels: Using FVG boundaries as support/resistance
Liquidity Hunting: Understanding where price seeks efficiency
Multi-Session Analysis
London Close: Set custom range for 1600-1601 London close gaps
Asian Session: Configure overnight inefficiencies
Power Hour: Analyze 1500-1600 ET gaps
Lunch Hour: Study 1200-1300 ET price behavior
Risk Management
Size-Based Filtering: Focus on significant gaps only
Historical Context: Compare current gaps to previous days
Confluence Trading: Combine with other ICT concepts
Session-Specific: Target gaps from specific market sessions
⚠️ IMPORTANT NOTES
Performance Considerations
Maximum Objects: Indicator creates multiple visual elements
Historical Limit: Adjust "Previous Days" to balance history vs. performance
Chart Refresh: Allow time for initial loading on historical data
Data Quality
Broker Dependency: Gap detection accuracy depends on data feed quality
Weekend Gaps: Sunday gaps may appear due to data provider differences
Fast Markets: Extremely volatile periods may create false gaps
Best Practices
Timeframe Consistency: Use same timeframe for analysis and execution
Size Calibration: Adjust minimum sizes based on instrument volatility
Session Awareness: Understand which sessions produce most relevant gaps
Confirmation: Use additional ICT concepts to confirm gap validity

IFVG by Toño# IFVG by Toño - Pine Script Indicator
## Overview
This Pine Script indicator identifies and visualizes **Fair Value Gaps (FVG)** and **Inverted Fair Value Gaps (IFVG)** on trading charts. It provides advanced analysis of price inefficiencies and their subsequent inversions when mitigated.
## Key Features
### 1. Fair Value Gap (FVG) Detection
- **Bullish FVG**: Detected when `low > high ` (gap between current low and high of 2 bars ago)
- **Bearish FVG**: Detected when `high < low ` (gap between current high and low of 2 bars ago)
- Visual representation using colored rectangles (green for bullish, red for bearish)
### 2. Inverted Fair Value Gap (IFVG) Creation
- **IFVG Formation**: When a FVG gets mitigated (price fills the gap with candle body), an IFVG is created
- **Color Inversion**: The IFVG takes the opposite color of the original FVG
- Mitigated bullish FVG → Creates red (bearish) IFVG
- Mitigated bearish FVG → Creates green (bullish) IFVG
- **Mitigation Logic**: Uses only candle body (not wicks) to determine when a FVG is filled
### 3. Customizable Display Options
- **Show Normal FVG**: Toggle visibility of regular Fair Value Gaps
- **Show IFVG**: Toggle visibility of Inverted Fair Value Gaps
- **Smart FVG Display**: Even when "Show Normal FVG" is disabled, FVGs that are part of IFVGs remain visible
- **Extension Control**: Option to extend FVGs until they are mitigated
### 4. IFVG Extension Methods
- **Full Cross Method**: IFVG remains active until price completely crosses through it (including wicks)
- **Number of Bars Method**: IFVG remains active for a specified number of bars (1-100)
### 5. Visual Mitigation Signals
- **Cross Markers**: Shows X-shaped markers when IFVGs are mitigated
- Green cross above bar: Bearish IFVG mitigated
- Red cross below bar: Bullish IFVG mitigated
### 6. Comprehensive Alert System
- **IFVG Formation Alerts**: Notifications when new IFVGs are created
- **IFVG Mitigation Alerts**: Notifications when IFVGs are filled/mitigated
- **Separate Controls**: Individual toggles for bullish and bearish IFVG alerts
## How It Works
### Step-by-Step Process:
1. **FVG Detection**: Script continuously scans for 3-bar patterns that create price gaps
2. **FVG Tracking**: Each FVG is stored with its coordinates, type, and status
3. **Mitigation Monitoring**: Script watches for candle bodies that fill the FVG
4. **IFVG Creation**: Upon mitigation, creates an IFVG with opposite polarity at the same location
5. **IFVG Management**: Tracks and extends IFVGs according to chosen method
6. **Visual Updates**: Dynamically updates colors and visibility based on user settings
## Use Cases
- **Support/Resistance Analysis**: IFVGs often act as strong support/resistance levels
- **Market Structure Understanding**: Helps identify how market inefficiencies get filled and reversed
- **Entry/Exit Timing**: Can be used to time entries around IFVG formations or mitigations
- **Confluence Analysis**: Combine with other technical analysis tools for stronger signals
## Configuration Parameters
- **Colors**: Customizable colors for bullish/bearish FVGs and IFVGs
- **Extension**: Choose how long to display gaps on the chart
- **Alerts**: Full control over notification preferences
- **Visual Clarity**: Options to show/hide different gap types for cleaner charts
## Technical Specifications
- **Pine Script Version**: 5
- **Overlay**: True (displays directly on price chart)
- **Max Boxes**: 500 (supports up to 500 simultaneous gaps)
- **Performance**: Optimized array management for smooth operation
This indicator is particularly valuable for traders who use **Smart Money Concepts (SMC)** and **Inner Circle Trader (ICT)** methodologies, as it provides clear visualization of how institutional order flow creates and fills market inefficiencies.

Not All FVGs Are The Same
Overview:
"Not All FVGs Are The Same" is a powerful TradingView indicator designed to pinpoint high-quality Fair Value Gaps (FVGs) on your chart. Unlike generic FVG tools, this indicator uses advanced filtering to highlight only the most significant gaps, helping traders identify high-probability setups with precision and clarity. With customizable visuals and real-time alerts, it’s built for traders who want to focus on meaningful market opportunities.
Why It’s Different:
This indicator stands out by detecting FVGs that meet strict criteria for quality, ensuring you’re not distracted by minor or unreliable gaps. It analyzes price action patterns and market volatility to confirm that each FVG represents a significant imbalance, perfect for spotting potential reversal or continuation zones.
Key Features:
High-Quality Detection: Identifies FVGs formed by strong, consistent price movements, filtering out weak or noisy gaps for reliable trading signals.
Volatility-Based Filtering: Uses market volatility to ensure only substantial FVGs are displayed, adapting to different market conditions.
Customizable Visuals: Marks FVGs with clear, semi-transparent boxes that show the gap’s range and duration, with an option to toggle labels for a clean chart.
Real-Time Alerts: Get instant notifications when new bullish or bearish FVGs are detected, keeping you ahead of the market.
Focused Display: Limits the number of FVGs shown to keep your chart uncluttered, emphasizing the most recent and relevant gaps.
User-Friendly Settings: Easily adjust sensitivity, gap size, and visual styles to match your trading strategy and preferences.
How It Helps Traders:
By focusing on high-quality FVGs, this indicator helps you identify key price levels where the market is likely to react. Whether you trade breakouts, reversals, or trend continuations, the clear visuals and precise detection make it easier to spot opportunities with confidence.
Settings:
ATR Length: Adjusts the volatility filter for FVG detection (default: 10).
Minimum FVG Size: Sets the smallest gap size to consider (default: 2 bars).
Show Last X FVGs: Controls how many recent FVGs are displayed (default: 20).
Enable Sensitivity Check: Turn on/off volatility-based filtering (default: on).
Allow Gaps Between Bars: Choose whether to include gaps with price discontinuities (default: off).
Show Labels: Toggle FVG detection labels on or off (default: on).
Style Options: Customize bullish/bearish FVG colors, text color, and label size for clear visuals.
How to Use:
Apply the indicator to your chart and tweak the settings to suit your market and timeframe. Enable alerts to stay updated on new FVGs in real-time. Use the boxes to identify key support/resistance zones and combine with your strategy for optimal trading decisions.
Note: Designed for efficiency, this indicator works smoothly across timeframes and instruments. Experiment with settings to find the best fit for your trading style, and use the toggleable labels to keep your chart clean when needed.

Higher Time Frame Fair Value Gap [ZeroHeroTrading]A fair value gap (FVG) highlights an imbalance area between market participants, and has become popular for technical analysis among price action traders.
A bullish (respectively bearish) fair value gap appears in a triple-candle pattern when there is a large candle whose previous candle’s high (respectively low) and subsequent candle’s low (respectively high) do not fully overlap the large candle. The space between these wicks is known as the fair value gap.
The following script aims at identifying higher timeframe FVG's within a lower timeframe chart. As such, it offers a unique perspective on the formation of FVG's by combining the multiple timeframe data points in the same context.
You can change the indicator settings as you see fit to achieve the best results for your use case.
Features
It draws higher timeframe bullish and bearish FVG's on the chart.
For bullish (respectively bearish) higher timeframe FVG's, it adds the buying (respectively selling) pressure as a percentage ratio of the up (respectively down) volume of the second higher timeframe bar out of the total up (respectively down) volume of the first two higher timeframe bars.
It adds a right extended trendline from the most recent lowest low (respectively highest high) to the top (respectively bottom) of the higher timeframe bullish (respectively bearish) FVG.
It detects and displays higher timeframe FVG's as early as one starts forming.
It detects and displays lower timeframe (i.e. chart's timeframe) FVG's upon confirmation.
It allows for skipping inside first bars when evaluating FVG's.
It allows for dismissing higher timeframe FVG's if there is no update for any period of the chart's timeframe. For instance, this can occur at lower timeframes during low trading activity periods such as extended hours.
Settings
Higher Time Frame FVG dropdown: Selects the higher timeframe to run the FVG detection on. Default is 15 minutes. It must be higher than, and a multiple of, the chart's timeframe.
Higher Time Frame FVG color select: Selects the color of the text to display for higher timeframe FVG's. Default is black.
Show Trend Line checkbox: Turns on/off trendline display. Default is on.
Show Lower Time Frame FVG checkbox: Turns on/off lower timeframe (i.e. chart's timeframe) FVG detection. Default is on.
Show Lower Time Frame FVG color select: Selects the color of the border for lower timeframe (i.e. chart's timeframe) FVG's. Default is white.
Include Inside Bars checkbox: Turns on/off the inclusion of inside first bars when evaluating FVG's. Default is on.
With Consistent Updates checkbox: Turns on/off consistent updates requirement. Default is on.

Fair Value Gap [by Oberlunar]Fair Value Gap
This indicator is designed to identify and display Fair Value Gaps (FVG) on the price chart. Fair Value Gaps are areas between candles where the price lacks continuity, leaving a "gap" that can serve as a reference point for price retracements. These zones are often considered important by traders as they represent market imbalances that tend to be "mitigated" (i.e., filled or tested) over time.
Purpose of Publication
This indicator addresses a common gap in FVG indicators. Most existing FVG indicators do not visually distinguish between mitigated (touched) FVGs and those that remain intact. With this indicator:
Mitigated FVGs are clearly displayed with distinct colors, allowing traders to identify which zones have been partially or fully filled by the price.
Unmitigated FVGs remain prominent, representing potential points of interest.
Key Features
Identification of Fair Value Gaps:
A Bullish FVG (upward gap) forms when the high of the three previous candles (candle -3) is lower than the low of the next candle (candle -1).
A Bearish FVG (downward gap) forms when the low of the three previous candles (candle -3) is higher than the high of the next candle (candle -1).
Dynamic Coloring:
Unmitigated FVGs are highlighted with specific colors: green for Bullish and red for Bearish gaps.
When an FVG is "touched" by the price (i.e., mitigated), the color changes:
Yellow-green for mitigated Bullish FVGs.
Purple for mitigated Bearish FVGs.
Handling Mitigated FVGs:
When an FVG is touched by the price, it is visually updated with a different color.
An option can be enabled to "shrink" the mitigated zone, adjusting the box to reflect the remaining untested portion of the gap.
Customization:
Configure the maximum number of FVGs to display on the chart.
Set specific colors for mitigated and unmitigated FVGs.
Choose whether to automatically shrink mitigated zones.
How to Identify Support and Resistance Levels
Support:
Bullish FVGs represent potential support levels, as they indicate areas where the price might return to seek liquidity or fill the imbalance.
An FVG that is repeatedly touched without being fully filled becomes a significant support zone.
Resistance:
Bearish FVGs represent potential resistance levels, indicating zones where the price might stall or reverse direction.
Why a Repeatedly Mitigated FVG is Significant
When an FVG is touched or mitigated multiple times, it means the market recognizes that area as significant. This can happen for several reasons:
Accumulation or Distribution: Institutional traders may use these zones to accumulate or distribute positions without causing excessive market movement.
Presence of Liquidity: FVGs often represent areas with pending orders (stop-losses, limit orders), and the price revisits these zones to seek liquidity.
Market Equilibrium: When an FVG is repeatedly filled, it indicates the market's attempt to balance a demand-supply imbalance. This makes the zone an important level to monitor for potential breakouts or reversals.

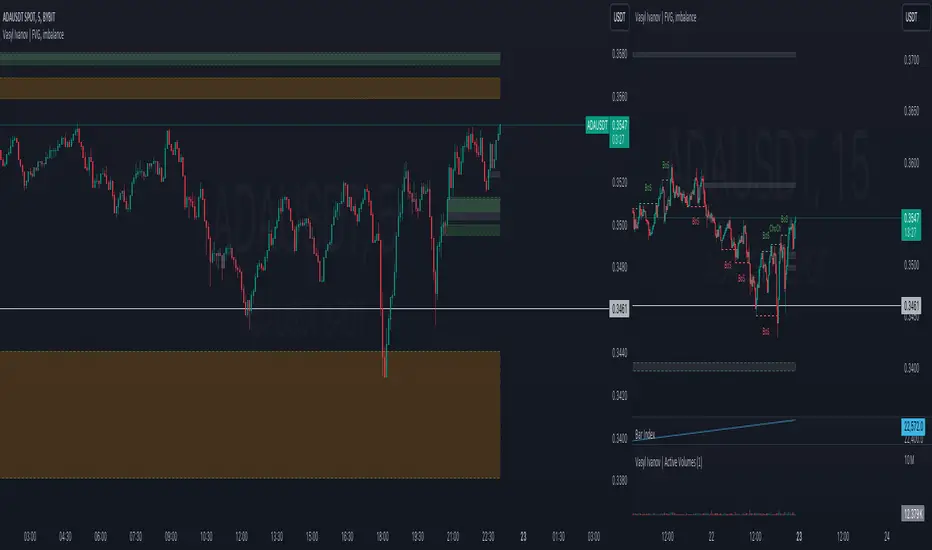
Vasyl Ivanov | FVG, imbalanceFair Value Gap (FVG) / Imbalance Indicator
This indicator is specifically designed to help traders detect Fair Value Gaps (FVG) and Imbalance in the market, highlighting key areas where price action may return to "fill the gap" or restore balance. Additionally, it detects strong FVG scenarios, where Break of Structure (BoS) intersects with an FVG, giving traders an extra level of insight.
Key Features:
Fair Value Gap (FVG) Detection:
The indicator identifies FVGs, which occur when the price leaves an unfilled gap between two bars. These gaps often act as key price targets for future market action, providing potential entry or exit points.
Imbalance Detection:
Imbalances occur when there is a discrepancy between buying and selling pressure, leaving price gaps that the market often seeks to fill. This feature highlights these imbalances on the chart.
Strong FVG Highlighting:
A Strong FVG is marked when there’s an intersection between a Break of Structure (BoS) and an FVG. This situation is highlighted with a distinct color, drawing attention to areas of higher importance where both a BoS and FVG are present, signaling potential significant price moves.
How It Works:
The FVG / Imbalance Indicator scans price action for gaps where price moves too quickly, leaving areas of imbalance:
Fair Value Gaps (FVG) are detected when price leaves a gap, signaling potential levels where the price may retrace.
Imbalance is identified when buying and selling pressure is uneven, leading to unfilled gaps in price action.
Strong FVG detection combines FVG with BoS, highlighting critical zones where price is likely to react significantly due to a structural shift and a gap in price action.
Use Cases:
Gap Trading: Use the FVG indicator to identify potential levels where the market may return to fill the gap, offering valuable entry and exit points.
Detecting Imbalance: Spot areas of price imbalance, which can act as magnets for price retracements.
Key Reversal Zones: Strong FVGs highlight potential reversal or continuation points where both a BoS and FVG intersect, making these zones crucial for high-probability trading opportunities.
Why It’s Unique:
This indicator goes beyond basic FVG and imbalance detection by introducing Strong FVGs, offering traders an advanced tool to identify crucial market zones where structural changes and gaps intersect. The distinct color for Strong FVGs ensures traders don’t miss these high-impact areas.
Smart Money Concept [TradingFinder] Major OB + FVG + Liquidity🔵 Introduction
"Smart Money" refers to funds under the control of institutional investors, central banks, funds, market makers, and other financial entities. Ordinary people recognize investments made by those who have a deep understanding of market performance and possess information typically inaccessible to regular investors as "Smart Money".
Consequently, when market movements often diverge from expectations, traders identify the footprints of smart money. For example, when a classic pattern forms in the market, traders take short positions. However, the market might move upward instead. They attribute this contradiction to smart money and seek to capitalize on such inconsistencies in their trades.
The "Smart Money Concept" (SMC) is one of the primary styles of technical analysis that falls under the subset of "Price Action". Price action encompasses various subcategories, with one of the most significant being "Supply and Demand", in which SMC is categorized.
The SMC method aims to identify trading opportunities by emphasizing the impact of large traders (Smart Money) on the market, offering specific patterns, techniques, and trading strategies.
🟣 Key Terms of Smart Money Concept (SMC)
• Market Structure (Trend)
• Change of Character (ChoCh)
• Break of Structure (BoS)
• Order Blocks (Supply and Demand)
• Imbalance (IMB)
• Inefficiency (IFC)
• Fair Value Gap (FVG)
• Liquidity
• Premium and Discount
🔵 How Does the "Smart Money Concept Indicator" Work?
🟣 Market Structure
a. Accumulation
b. Market-Up
c. Distribution
d. Market-Down
a) Accumulation Phase : During the accumulation period, typically following a downtrend, smart money enters the market without significantly affecting the pricing trend.
b) Market-Up Phase : In this phase, the price of an asset moves upward from the accumulation range and begins to rise. Usually, the buying by retail investors is the main driver of this trend, and due to positive market sentiment, it continues.
c) Distribution Phase : The distribution phase, unlike the accumulation stage, occurs after an uptrend. In this phase, smart money attempts to exit the market without causing significant price fluctuations.
d) Market-Down Phase : In this stage, the price of an asset moves downward from the distribution phase, initiating a prolonged downtrend. Smart money liquidates all its positions by creating selling pressure, trapping latecomer investors.
The result of these four phases in the market becomes the market trend.
Types of Trends in Financial Markets :
a. Up-Trend
b. Down Trend
c. Range (No Trend)
a) Up-Trend : The market breaks consecutive highs.
b) Down Trend : The market breaks consecutive lows.
c) No Trend or Range : The market oscillates within a range without breaking either highs or lows.
🟣 Change of Character (ChoCh)
The "ChoCh" or "Change of Character" pattern indicates an initial change in order flow in financial markets. This structural change occurs when a major pivot in the opposite direction of the market trend fails. It signals a potential change in the market trend and can serve as a signal for short-term or long-term trend changes in a trading symbol.
🟣 Break of Structure (BoS)
The "BoS" or "Break of Structure" pattern indicates the continuation of the trend in financial markets. This structure forms when, in an uptrend, the price breaks its ceiling or, in a downtrend, the price breaks its floor.
🟣 Order Blocks (Supply and Demand)
Order blocks consist of supply and demand areas where the likelihood of price reversal is higher. There are six order blocks in this indicator, categorized based on their origin and formation reasons.
a. Demand Main Zone, "ChoCh" Origin.
b. Demand Sub Zone, "ChoCh" Origin.
c. Demand All Zone, "BoS" Origin.
d. Supply Main Zone, "ChoCh" Origin.
e. Supply Sub Zone, "ChoCh" Origin.
f. Supply All Zone, "BoS" Origin.
🟣 FVG | Inefficiency | Imbalance
These three terms are almost synonymous. They describe the presence of gaps between consecutive candle shadows. This inefficiency occurs when the market moves rapidly. Primarily, imbalances and these rapid movements stem from the entry of smart money and the imbalance between buyer and seller power. Therefore, identifying these movements is crucial for traders.
These areas are significant because prices often return to fill these gaps or even before they occur to fill price gaps.
🟣 Liquidity
Liquidity zones are areas where there is a likelihood of congestion of stop-loss orders. Liquidity is considered the driving force of the entire market, and market makers may manipulate the market using these zones. However, in many cases, this does not happen because there is insufficient liquidity in some areas.
Types of Liquidity in Financial Markets :
a. Trend Lines
b. Double Tops | Double Bottoms
c. Triple Tops | Triple Bottoms
d. Support Lines | Resistance Lines
All four types of liquidity in this indicator are automatically identified.
🟣 Premium and Discount
Premium and discount zones can assist traders in making better decisions. For instance, they may sell positions in expensive ranges and buy in cheaper ranges. The closer the price is to the major resistance, the more expensive it is, and the closer it is to the major support, the cheaper it is.
🔵 How to Use
🟣 Change of Character (ChoCh) and Break of Structure (BoS)
This indicator detects "ChoCh" and "BoS" in both Minor and Major states. You can turn on the display of these lines by referring to the last part of the settings.
🟣 Order Blocks (Supply and Demand)
Order blocks are Zones where the probability of price reversal is higher. In demand Zones you can buy opportunities and in supply Zones you can check sell opportunities.
The "Refinement" feature allows you to adjust the width of the order block according to your strategy. There are two modes, "Aggressive" and "Defensive," in the "Order Block Refine". The difference between "Aggressive" and "Defensive" lies in the width of the order block.
For risk-averse traders, the "Defensive" mode is suitable as it provides a lower loss limit and a greater reward-to-risk ratio. For risk-taking traders, the "Aggressive" mode is more appropriate. These traders prefer to enter trades at higher prices, and this mode, which has a wider order block width, is more suitable for this group of individuals.
🟣 Fair Value Gap (FVG) | Imbalance (IMB) | Inefficiency (IFC)
In order to identify the "fair value gap" on the chart, it must be analyzed candle by candle. In this process, it is important to pay attention to candles with a large size, and a candle and a candle should be examined before that.
Candles before and after this central candle should have long shadows and their bodies should not overlap with the central candle body. The distance between the shadows of the first and third candles is known as the FVG range.
These areas work in two ways :
• Supply and demand area : In this case, the price reacts to these areas and the trend is reversed.
• Liquidity zone : In this scenario, the price "fills" the zone and then reaches the order block.
Important note : In most cases, the FVG zone of very small width acts as a supply and demand zone, while the zone of significant width acts as a liquidity zone and absorbs price.
When the FVG filter is activated, the FVG regions are filtered based on the specified algorithm.
FVG filter types include the following :
1. Very Aggressive Mode : In addition to the initial condition, an additional condition is considered. For bullish FVG, the maximum price of the last candle must be greater than the maximum price of the middle candle.
Similarly, for a bearish FVG, the minimum price of the last candle must be lower than the minimum price of the middle candle. This mode removes the minimum number of FVGs.
2. Aggressive : In addition to the very aggressive condition, the size of the middle candle is also considered. The size of the center candle should not be small and therefore more FVGs are removed in this case.
3. Defensive : In addition to the conditions of the very aggressive mode, this mode also considers the size of the middle pile, which should be relatively large and make up the majority of the body.
Also, to identify bullish FVGs, the second and third candles must be positive, while for bearish FVGs, the second and third candles must be negative. This mode filters out a significant number of FVGs and keeps only those of good quality.
4. Very Defensive : In addition to the conditions of the defensive mode, in this mode the first and third candles should not be very small-bodied doji candles. This mode filters out most FVGs and only the best quality ones remain.
🟣 Liquidity
These levels are where traders intend to exit their trades. "Market makers" or smart money usually accumulate or distribute their trading positions near these levels, where many retail traders have placed their "stop loss" orders. When liquidity is collected from these losses, the price often reverses.
A "Stop hunt" is a move designed to offset liquidity generated by established stop losses. Banks often use major news events to trigger stop hunts and capture liquidity released into the market. For example, if they intend to execute heavy buy orders, they encourage others to sell through stop-hots.
Consequently, if there is liquidity in the market before reaching the order block area, the validity of that order block is higher. Conversely, if the liquidity is close to the order block, that is, the price reaches the order block before reaching the liquidity limit, the validity of that order block is lower.
🟣 Alert
With the new alert functionality in this indicator, you won't miss any important trading signals. Alerts are activated when the price hits the last order block.
1. It is possible to set alerts for each "symbol" and "time frame". The system will automatically detect both and include them in the warning message.
2. Each alert provides the exact date and time it was triggered. This helps you measure the timeliness of the signal and evaluate its relevance.
3. Alerts include target order block price ranges. The "Proximal" level represents the initial price level strike, while the "Distal" level represents the maximum price gap in the block. These details are included in the warning message.
4. You can customize the alert name through the "Alert Name" entry.
5. Create custom messages for "long" and "short" alerts to be sent with notifications.
🔵 Setting
a. Pivot Period of Order Blocks Detector :
Using this parameter, you can set the zigzag period that is formed based on the pivots.
b. Order Blocks Validity Period (Bar) :
You can set the validity period of each Order Block based on the number of candles that have passed since the origin of the Order Block.
c. Demand Main Zone, "ChoCh" Origin :
You can control the display or not display as well as the color of Demand Main Zone, "ChoCh" Origin.
d. Demand Sub Zone, "ChoCh" Origin :
You can control the display or not display as well as the color of Demand Sub Zone, "ChoCh" Origin.
e. Demand All Zone, "BoS" Origin :
You can control the display or not display as well as the color of Demand All Zone, "BoS" Origin.
f. Supply Main Zone, "ChoCh" Origin :
You can control the display or not display as well as the color of Supply Main Zone, "ChoCh" Origin.
g. Supply Sub Zone, "ChoCh" Origin :
You can control the display or not display as well as the color of Supply Sub Zone, "ChoCh" Origin.
h. Supply All Zone, "BoS" Origin :
You can control the display or not display as well as the color of Supply All Zone, "BoS" Origin.
i. Refine Demand Main : You can choose to be refined or not and also the type of refining.
j. Refine Demand Sub : You can choose to be refined or not and also the type of refining.
k. Refine Demand BoS : You can choose to be refined or not and also the type of refining.
l. Refine Supply Main : You can choose to be refined or not and also the type of refining.
m. Refine Supply Sub : You can choose to be refined or not and also the type of refining.
n. Refine Supply BoS : You can choose to be refined or not and also the type of refining.
o. Show Demand FVG : You can choose to show or not show Demand FVG.
p. Show Supply FVG : You can choose to show or not show Supply FVG
q. FVG Filter : You can choose whether FVG is filtered or not. Also specify the type of filter you want to use.
r. Show Statics High Liquidity Line : Show or not show Statics High Liquidity Line.
s. Show Statics Low Liquidity Line : Show or not show Statics Low Liquidity Line.
t. Show Dynamics High Liquidity Line : Show or not show Dynamics High Liquidity Line.
u. Show Dynamics Low Liquidity Line : Show or not show Dynamics Low Liquidity Line.
v. Statics Period Pivot :
Using this parameter, you can set the Swing period that is formed based on Static Liquidity Lines.
w. Dynamics Period Pivot :
Using this parameter, you can set the Swing period that is formed based Dynamics Liquidity Lines.
x. Statics Liquidity Line Sensitivity :
is a number between 0 and 0.4. Increasing this number decreases the sensitivity of the "Statics Liquidity Line Detection" function and increases the number of lines identified. The default value is 0.3.
y. Dynamics Liquidity Line Sensitivity :
is a number between 0.4 and 1.95. Increasing this number increases the sensitivity of the "Dynamics Liquidity Line Detection" function and decreases the number of lines identified. The default value is 1.
z. Alerts Name : You can customize the alert name using this input and set it to your desired name.
aa. Alert Demand Main Mitigation :
If you want to receive the alert about Demand Main 's mitigation after setting the alerts, leave this tick on. Otherwise, turn it off.
bb. Alert Demand Sub Mitigation :
If you want to receive the alert about Demand Sub's mitigation after setting the alerts, leave this tick on. Otherwise, turn it off.
cc. Alert Demand BoS Mitigation :
If you want to receive the alert about Demand BoS's mitigation after setting the alerts, leave this tick on. Otherwise, turn it off.
dd. Alert Supply Main Mitigation :
If you want to receive the alert about Supply Main's mitigation after setting the alerts, leave this tick on. Otherwise, turn it off.
ee. Alert Supply Sub Mitigation :
If you want to receive the alert about Supply Sub's mitigation after setting the alerts, leave this tick on. Otherwise, turn it off.
ff. Alert Supply BoS Mitigation :
If you want to receive the alert about Supply BoS's mitigation after setting the alerts, leave this tick on. Otherwise, turn it off.
gg. Message Frequency :
This parameter, represented as a string, determines the frequency of announcements. Options include: 'All' (triggers the alert every time the function is called), 'Once Per Bar' (triggers the alert only on the first call within the bar), and 'Once Per Bar Close' (activates the alert only during the final script execution of the real-time bar upon closure). The default setting is 'Once per Bar'.
hh. Show Alert time by Time Zone :
The date, hour, and minute displayed in alert messages can be configured to reflect any chosen time zone. For instance, if you prefer London time, you should input 'UTC+1'. By default, this input is configured to the 'UTC' time zone.
ii. Display More Info : The 'Display More Info' option provides details regarding the price range of the order blocks (Zone Price), along with the date, hour, and minute. If you prefer not to include this information in the alert message, you should set it to 'Off'.
You also have access to display or not to display, choose the Style and Color of all the lines below :
a. Major Bullish "BoS" Lines
b. Major Bearish "BoS" Lines
c. Minor Bullish "BoS" Lines
d. Minor Bearish "BoS" Lines
e. Major Bullish "ChoCh" Lines
f. Major Bearish "ChoCh" Lines
g. Minor Bullish "ChoCh" Lines
h. Minor Bearish "ChoCh" Lines
i. Last Major Support Line
j. Last Major Resistance Line
k. Last Minor Support Line
l. Last Minor Resistance Line

ICT Concept [TradingFinder] Order Block | FVG | Liquidity Sweeps🔵 Introduction
The "ICT" style is one of the subsets of "Price Action" technical analysis. ICT is a method created by "Michael Huddleston", a professional forex trader and experienced mentor. The acronym ICT stands for "Inner Circle Trader".
The main objective of the ICT trading strategy is to combine "Price Action" and the concept of "Smart Money" to identify optimal entry points into trades. However, finding suitable entry points is not the only strength of this approach. With the ICT style, traders can better understand price behavior and adapt their trading approach to market structure accordingly.
Numerous concepts are discussed in this style, but the key practical concepts for trading in financial markets include "Order Block," "Liquidity," and "FVG".
🔵 How to Use
🟣Order Block
Order blocks are a specific type of "Supply and Demand" zones formed when a series of orders are placed in a block. These orders could be created by banks or other major players. Banks typically execute large orders in blocks during their trading sessions. If they were to enter the market directly with a small quantity, significant price movements would occur before the orders are fully executed, resulting in less profit. To avoid this, they divide their orders into smaller, manageable positions. Traders should look for "buy" opportunities in "demand order blocks" areas and "sell" opportunities in "supply order blocks".
🟣Liquidity
These levels are where traders aim to exit their trades. "Market Makers" or smart money usually collects or distributes their trading positions near levels where many retail traders have placed their "Stop Loss" orders. When the liquidity resulting from these losses is collected, the price often reverses direction.
A "Stop Hunt" is a move designed to neutralize liquidity generated by triggered stop losses. Banks often use significant news events to trigger stop hunts and acquire the liquidity released in the market. If, for example, they intend to execute heavy buy orders, they encourage others to sell through stop hunts.
As a result, if there is liquidity in the market before reaching the order block region, the credibility of that order block is higher. Conversely, if liquidity is near the order block, meaning the price reaches the order block before reaching the liquidity area, the credibility of that order block is lower.
🟣FVG (Fair Value Gap)
To identify the "Fair Value Gap" on the chart, one must analyze candle by candle. Focus on candles with large bodies, examining one candle and the one before it. The candles before and after this central candle should have long shadows, and their bodies should not overlap with the body of the central candle. The distance between the shadows of the first and third candles is called the FVG range.
These zone function in two ways :
•Supply and Demand zone: In this case, the price reacts to these zone, and its trend reverses.
•Liquidity zone: In this scenario, the price "fills" the zone and then reaches the order block.
Important Note: In most cases, FVG zone with very small width act as supply and demand zone, while zone with a significant width act as liquidity zone, absorbing the price.
🔵 Setting
🟣Order Block
Refine Order Block : When the option for refining order blocks is Off, the supply and demand zones encompass the entire length of the order block (from Low to High) in their standard state and remain unaltered. On the option for refining order blocks triggers the improvement of supply and demand zones using the error correction algorithm.
Refine Type : The enhancement of order blocks via the error correction algorithm can be executed through two methods: Defensive and Aggressive. In the Aggressive approach, the widest possible range is taken into account for order blocks.
Show High Levels : If major high levels are to be displayed, set the option for showing high level to Yes.
Show Low Levels : If major low levels are to be displayed, set the option for showing low level to Yes.
Show Last Support : If showing the last support is desired, set the option for showing last support to Yes.
Show Last Resistance : If showing the last resistance is desired, set the option for showing last resistance to Yes.
🟣 FVG
FVG Filter : When FVG filtering is activated, the number of FVG areas undergoes filtration based on the specified algorithm.
FVG Filter Types :
1. Very Aggressive : Apart from the initial condition, an additional condition is introduced. For an upward FVG, the maximum price of the last candle should exceed the maximum price of the middle candle. Similarly, for a downward FVG, the minimum price of the last candle should be lower than the minimum price of the middle candle. This mode eliminates a minimal number of FVGs.
2. Aggressive : In addition to the conditions of the Very Aggressive mode, this mode considers the size of the middle candle; it should not be small. Consequently, a larger number of FVGs are eliminated in this mode.
3. Defensive : Alongside the conditions of the Very Aggressive mode, this mode takes into account the size of the middle candle, which should be relatively large with the majority of it comprising the body. Furthermore, to identify upward FVGs, the second and third candles must be positive, whereas for downward FVGs, the second and third candles must be negative. This mode filters out a considerable number of FVGs, retaining only those of suitable quality.
4. Very Defensive : In addition to the conditions of the Defensive mode, the first and third candles should not be very small-bodied doji candles. This mode filters out the majority of FVGs, leaving only the highest quality ones. Show Demand FVG: Enables the display of demand-related boxes, which can be toggled between off and on. Show Supply FVG: Enables the display of supply-related boxes along the path, which can also be toggled between off and on.
🟣 Liquidity
Statics Liquidity Line Sensitivity : A value ranging from 0 to 0.4. Increasing this value reduces the sensitivity of the "Statics Liquidity Line Detection" function and increases the number of identified lines. The default value is 0.3.
Dynamics Liquidity Line Sensitivity : A value ranging from 0.4 to 1.95. Increasing this value enhances the sensitivity of the "Dynamics Liquidity Line Detection" function and decreases the number of identified lines. The default value is 1.
Statics Period Pivot : Default value is set to 8. By adjusting this value, you can specify the period for static liquidity line pivots.
Dynamics Period Pivot : Default value is set to 3. By adjusting this value, you can specify the period for dynamic liquidity line pivots.
You can activate or deactivate liquidity lines as necessary using the buttons labeled "Show Statics High Liquidity Line," "Show Statics Low Liquidity Line," "Show Dynamics High Liquidity Line," and "Show Dynamics Low Liquidity Line".

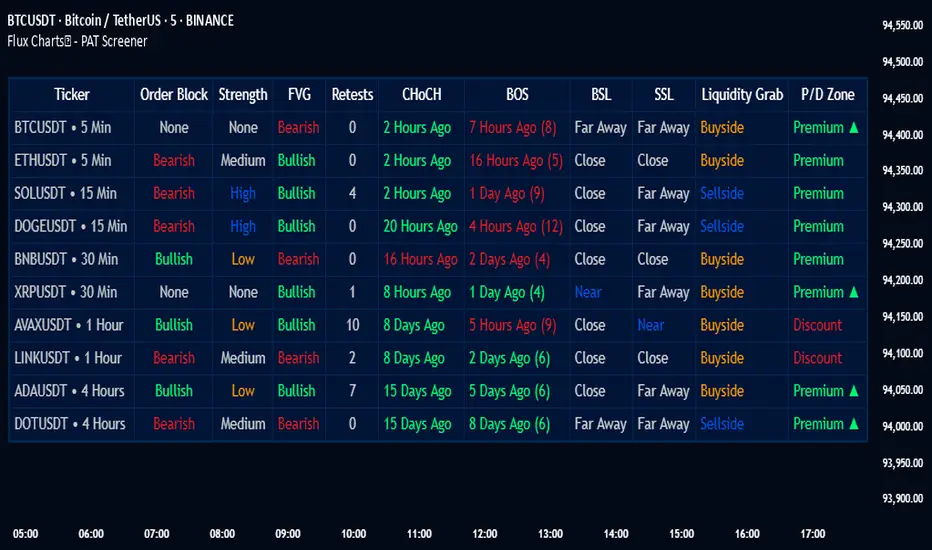
Fair Value Gap Screener | Flux Charts💎 GENERAL OVERVIEW
Introducing our new Fair Value Gap Screener! This screener can provide information about the latest Fair Value Gaps in up to 5 tickers. You can also customize the algorithm that finds the Fair Value Gaps and the styling of the screener.
Features of the new Fair Value Gap (FVG) Screener :
Find Latest Fair Value Gaps Accross 5 Tickers
Shows Their Information Of :
Latest Status
Number Of Retests
Consumption Percent
Bullish & Bearish Volume
Customizable Algoritm / Styling
📌 HOW DOES IT WORK ?
A Fair Value Gap generally occur when there is an imbalance in the market. They can be detected by specific formations within the chart. This screener then finds Fair Value Gaps accross 5 different tickers, and shows the latest information about them.
Status ->
Far -> The current price is far away from the FVG.
Approaching ⬆️/⬇️ -> The current price is approaching the FVG, and the direction it's approaching from.
Inside -> The price is currently inside the FVG.
Retests -> Retest means the price tried to invalidate the FVG, but failed to do so. Here you can see how many times the price retested the FVG.
Consumed -> FVGs get consumed when a Close / Wick enters the FVG zone. For example, if the price hits the middle of the FVG zone, the zone is considered 50% consumed.
Bullish / Bearish Volume -> Bullish & Bearish volume of a FVG is calculated by analyzing the bars that formed it. For example in a bullish FVG, the bullish volume is the total volume of the first 2 bars forming the FVG, and the bearish volume is the volume of the 3rd bar that forms it.
🚩UNIQUENESS
This screener can detect latest Fair Value Gaps and give information about them for up to 5 tickers. This saves the user time by showing them all in a dashboard at the same time. The screener also uniquely shows information about the number of retests and the consumed percent of the FVG, as well as it's bullish & bearish volume. We believe that this extra information will help you spot reliable FVGs easier.
⚙️SETTINGS
1. Tickers
You can set up to 5 tickers for the screener to scan Fair Value Gaps here. You can also enable / disable them and set their individual timeframes.
2. General Configuration
Zone Invalidation -> Select between Wick & Close price for FVG Zone Invalidation.
Zone Filtering -> With "Average Range" selected, algorithm will find FVG zones in comparison with average range of last bars in the chart. With the "Volume Threshold" option, you may select a Volume Threshold % to spot FVGs with a larger total volume than average.
FVG Detection -> With the "Same Type" option, all 3 bars that formed the FVG should be the same type. (Bullish / Bearish). If the "All" option is selected, bar types may vary between Bullish / Bearish.
Detection Sensitivity -> You may select between Low, Normal or High FVG detection sensitivity. This will essentially determine the size of the spotted FVGs, with lower sensitivies resulting in spotting bigger FVGs, and higher sensitivies resulting in spotting all sizes of FVGs.

[TehThomas] - ICT VI / FVG / IFVG / Liquidity📌 Overview
This TradingView indicator is designed to help traders spot key price inefficiencies and liquidity events based on ICT (Inner Circle Trader) concepts. The script automatically highlights important areas on the chart, such as Volume Imbalances (VI), Fair Value Gaps (FVG), Inverted Fair Value Gaps (IFVG), and Liquidity Sweeps, giving traders a clear view of where price might react.
By marking these zones visually, the indicator serves as a liquidity map, showing where smart money could be targeting orders or rebalancing price action.
🔑 How the Script Works
The indicator detects four major market inefficiencies and liquidity patterns, each offering valuable insights into how price might behave:
1️⃣ Volume Imbalance (VI)
Bullish VI: When the current candle has higher volume than the previous candle in an upward move, this suggests demand is pushing the price up, creating potential buying opportunities.
Bearish VI: When the current candle has higher volume than the previous candle in a downward move, this suggests supply is pushing the price down, highlighting potential selling opportunities.
How to take trades:
Buy: Enter a long position when a bullish VI appears and the price is near a support zone or key level (such as the previous swing low or FVG).
Sell: Enter a short position when a bearish VI appears and the price is near a resistance zone or key level (such as the previous swing high or FVG).
2️⃣ Fair Value Gap (FVG)
Bullish FVG: A gap in price action where the low of the second candle is higher than the high of the first candle. Price tends to return to fill these gaps before continuing upward.
Bearish FVG: A gap in price action where the high of the second candle is lower than the low of the first candle. Price tends to return to fill these gaps before continuing downward.
How to take trades:
Buy: Enter long after a pullback into a bullish FVG zone and if price action shows signs of rejection (such as bullish candlestick patterns or strong momentum).
Sell: Enter short after a pullback into a bearish FVG zone and if price action shows signs of rejection (such as bearish candlestick patterns or strong downward momentum).
3️⃣ Inverted Fair Value Gap (IFVG)
An Inverted Fair Value Gap (IFVG) refers to a Fair Value Gap (FVG) that has already been filled or broken through by price action. Essentially, it is a gap that has been revisited by price and has now been mitigated or broken.
Example:
For Continuation: After price fills the gap, it may continue in the same direction. If price breaks through a bullish FVG and shows continuation, it may signal that the market is still in a strong uptrend.
For Reversal: If the price returns to an inverted FVG after breaching it, and then starts showing signs of reversal (e.g., reversal candlestick patterns, or a shift in momentum), this could signal an entry point in the opposite direction.
How to take trades:
Buy: Consider entering long when price returns to an IFVG zone that aligns with other bullish confluences, such as a bullish VI or liquidity sweep.
Sell: Consider entering short when price returns to a bearish IFVG zone that aligns with other bearish confluences, such as a bearish VI or liquidity sweep.
4️⃣ Liquidity Sweeps
Liquidity sweeps occur when the market temporarily breaks a key high or low to trigger stop-loss orders or lure traders into the wrong direction before reversing.
How to take trades:
Buy: If a liquidity sweep breaks a key resistance or swing high but fails to close above it, enter long when price begins to reverse in the opposite direction, ideally near a previous support or FVG zone.
Sell: If a liquidity sweep breaks a key support or swing low but fails to close below it, enter short when price begins to reverse in the opposite direction, ideally near a previous resistance or FVG zone.
🎯 Trade Setup and Confirmation Strategy
Here’s how to combine these concepts for high-probability trade setups:
Liquidity Sweeps + Volume Imbalances:
If a liquidity sweep occurs in conjunction with a volume imbalance (especially on a higher timeframe), this can act as a confirmation signal to enter the trade.
Example: A liquidity sweep breaks a previous high, but the price fails to close above it. If this happens alongside a break of a Volume imbalance (VI) , it could be a strong signal to sell.
FVG/IFVG Mitigation + Liquidity Sweeps:
Price often returns to mitigate imbalances, and when a liquidity sweep occurs near an unfilled gap, it could trigger a reversal.
Example: After an upward trend, a bearish liquidity sweep breaks a previous swing low, and price then revisits a bearish FVG and creates an IFVG, signaling an opportunity to buy.
Directional Bias (Higher Timeframe Analysis):
Always consider the higher timeframe trend to confirm trade direction. A bullish FVG or bullish VI on the lower timeframe aligns with a bullish trend on the higher timeframe.
Confluence with Key Levels:
When these patterns align with important price levels such as support, resistance, or previously identified swing highs/lows, it enhances the probability of a successful trade.
⚙️ How It Helps in Trading Strategy
The indicator assists in several aspects of trading:
Liquidity Hunts: Price often sweeps liquidity before making major moves.
Entry Confirmation: Use imbalances or sweeps as extra confluence for trade entries.
Mitigation Zones: Price frequently returns to fill inefficiencies before reversing.
Directional Bias: Bullish or bearish gaps align with the higher timeframe narrative.
🔍 ICT Concepts Included
✅Volume Imbalance (VI): High-volume inefficiencies.
✅Fair Value Gap (FVG): Standard price gaps.
✅Inverted Fair Value Gap (IFVG): Filtered large price gaps.
✅Liquidity Sweeps: Stop-hunting patterns by smart money.
⚠️ Disclaimer
This indicator is built for educational purposes and should not be considered financial advice. Trading carries risk, and no tool guarantees profits. Always use proper risk management and perform your own analysis before entering any trade.

PAT Screener | Flux Charts💎 GENERAL OVERVIEW
Introducing our new Price Action Toolkit (PAT) Screener! This screener can spot trading opportunities that Price Action Toolkit offers across 8 different tickers! We believe that this screener will help you take a glimpse of the current state of the market much easier.
Features of the new Price Action Toolkit (PAT) Screener :
Finds Latest Across 8 Tickers:
Order Blocks
Breaker Blocks
Fair Value Gaps (FVG)
Inversion FVGs
Market Structures (BOS, CHoCH, CHoCH+)
Liquidity Zones
Liquidity Grabs
Premium / Discount Zones
Shows Additional Information Like :
Strength
Retests
(Bullish & Bearish) Volume
Consumption
Also :
All Features Support Tuning
Customizable Theme
📌 HOW DOES IT WORK ?
1. Order Blocks
Order blocks occur when there is a high amount of market orders exist on a price range. It is possible to find order blocks using specific formations on the chart.
The high & low volume of order blocks should be taken into consideration while determining their strengths. The determination of the high & low volume of order blocks are similar to FVGs, in a bullish order block, the high volume is the last 2 bars' total volume, while the low volume is the oldest bar's volume. In a bearish order block scenario, the low volume becomes the last 2 bars' total volume.
2. Breaker Blocks
Breaker blocks form when an order block fails, or "breaks". It is often associated with market going in the opposite direction of the broken order block, and they can be spotted by following order blocks and finding the point they get broken, i.e. price goes below a bullish order block.
The volume of a breaker block is simply the total volume of the bar that the original order block is broken. Often the higher the breaking bar's volume, the stronger the breaker block is.
The strength of Order & Breaker Blocks are calculated by the size of the block to the Average True Range (ATR) of the chart.
3. Fair Value Gaps
Fair value gaps often occur when there is an imbalance in the market, and can be spotted with a specific formation on the chart.
The volume when the FVG occurs plays an important role when determining the strength of it, so we've placed two bars on the FVG zone, indicating the high & low volumes of the FVG. The high volume is the total volume of the last two bars on a bullish FVG, while the low volume is - of the FVG. For a bearish FVG, the total volume of the last two bars is the low volume. The indicator can also detect FVGs that exist in other timeframes than the current chart.
4. Inversion Fair Value Gaps
A Fair Value Gap generally occur when there is an imbalance in the market. They can be detected by specific formations within the chart. An Inverse Fair Value Gap is when a FVG becomes invalidated, thus reversing the direction of the FVG.
IFVGs get consumed when a Close / Wick enters the IFVG zone. Check this example:
5. Market Structures
Sometimes specific market structures form and break as the market fills buy & sell orders. Formed Change of Character (CHoCH) and Break of Structure (BOS) often mean that market will change direction, and they can be spotted by inspecting low & high pivot points of the chart.
The number of times the chart recently had a BOS is displayed between brackets, Ex : (3)
6. Liquidity Zones
Buyside & Sellside Liquidity zones are where most traders place their take-profits and stop-losses in their long / short positions. They are spotted by using high & low pivot points on the chart.
7. Liquidity Grabs
Liquidity grabs occur when one of the latest pivots has a false breakout. Then, if the wick to body ratio of the bar is higher than 0.5 (can be changed from the settings) a liquidity grab has occurred.
8. Premium & Discount Zones
The premium zone is a zone that is over the fair value of the asset's price, and the discount zone is the opposite. They are formed by the latest high & low pivot points.
If the latest close price is outside the Premium or Discount zone, you will see "Premium ⬆️" or "Discount ⬇️". These mean that the price is currently higher than the premium zone or lower than the discount zone.
🚩UNIQUENESS
This screener offers a comprehensive dashboard for traders, combining multiple analytical elements with customizable settings to aid in decision-making across different tickers and timeframes. We believe that this will help traders spot trading opportunities much easier by providing crucial information in a single dashboard. Our new screener contains of common elements like Order & Breaker Blocks, Fair Value Gaps & IFVGs as well as rather unique elements like Liquidity Grabs . With the use of up to 8 tickers & timeframes , you can easily take a look at the bigger picture of the market. We recommend reading the "How Does It Work" section of the description to get a better understanding about how this indicator is unique to others.
⚙️SETTINGS
1. Tickers
You can set up to 8 tickers for the screener to scan here. You can also enable / disable them and set their individual timeframes.
You can enable / disable Retests, Strength, Consumption and (Bullish & Bearish) Volume for :
Order Blocks (Retests, Strength, Bullish & Bearish Volume)
Breaker Blocks (Retests, Strength, Volume)
Fair Value Gaps (Retests, Consumption, Strength, Bullish & Bearish Volume)
Inversion Fair Value Gaps (Retests, Consumption, Strength, Volume)
2. Order Blocks
Enabled -> Enables / Disables Order Blocks
Zone Invalidation -> Select between Wick & Close price for Order Block Invalidation.
Swing Length -> Swing length is used when finding order block formations. Smaller values will result in finding smaller order blocks.
3. Breaker Blocks
Enabled -> Enables / Disables Breaker Blocks
Zone Invalidation -> Select between Wick & Close price for Breaker Block Invalidation.
4. Fair Value Gaps
Enabled -> Enables / Disables Fair Value Gaps
Zone Invalidation -> Select between Wick & Close price for FVG Zone Invalidation.
Zone Filtering -> With "Average Range" selected, algorithm will find FVG zones in comparison with average range of last bars in the chart. With the "Volume Threshold" option, you may select a Volume Threshold % to spot FVGs with a larger total volume than average.
FVG Detection -> With the "Same Type" option, all 3 bars that formed the FVG should be the same type. (Bullish / Bearish). If the "All" option is selected, bar types may vary between Bullish / Bearish.
Detection Sensitivity -> You may select between Low, Normal or High FVG detection sensitivity. This will essentially determine the size of the spotted FVGs, with lower sensitivities resulting in spotting bigger FVGs, and higher sensitivities resulting in spotting all sizes of FVGs.
5. Inversion Fair Value Gaps
Zone Invalidation -> Select between Wick & Close price for IFVG Zone Invalidation. This setting also switches the type for IFVG consumption.
6. Market Structures
Break Of Structure (BOS) -> If the current structure of the market is broken in a bullish or bearish direction, it will be displayed.
Change Of Character (CHoCH) -> If the market shifts into another direction, it will be displayed.
Change Of Character+ (CHoCH+) -> This will display Change Of Characters detected with higher sensitivity if enabled.
7. Liquidity Zones
Buyside Liquidity -> Enables / Disables Buyside Liquidity
Sellside Liquidity -> Enables / Disables Sellside Liquidity
8. Liquidity Grabs
Pivot Length -> This setting determines the range of the pivots. This means a candle has to have the highest / lowest wick of the previous X bars and the next X bars to become a high / low pivot.
Wick-Body Ratio -> After a pivot has a false breakout, the wick-body ratio of the latest candle is tested. The resulting ratio must be higher than this setting for it to be considered as a liquidity grab.
9. Premium & Discount Zones
Enabled -> Enables / Disables Premium & Discount Zones.
10. Style
You can customize the visual looks of the screener here.
BK AK-FVG/SR Institutional⚔️ BK AK-FVG/SR Institutional — Smart Money Gaps. True Support/Resistance. ⚔️
There are already some excellent FVG tools out there—built by traders who’ve put in real work studying imbalance, liquidity, and smart money behavior.
BK AK-FVG/SR Institutional is simply my version of that idea: my attempt to take what I learned from those great frameworks and push it further into volume, structure, lifecycle, and accountability—so every zone is treated as a living, graded object, not just a static box on a chart.
This is my 12th script release—and that number matters to me. Twelve is structure: twelve tribes, twelve months, twelve divisions of ordered space. It’s the number of complete arrangement. So for script twelve, I’m releasing what I consider my institutional map—a tool built specifically around boundaries, alignment, and where real money chooses to defend and attack.
This script is invite-only. Access is controlled. It’s built for traders who actually respect structure, not tourists looking for colors on a chart.
“AK” in the name is not branding—it’s honor. It belongs to my mentor A.K., whose standard of discipline and clarity sits behind every decision in this tool. Above that, all glory and gratitude to Gd—the real source of any wisdom, edge, or endurance we have in this game.
🧠 What BK AK-FVG/SR Institutional Actually Does
This is a full institutional FVG/SR system, not a paintbrush. It:
Detects and manages bullish & bearish FVG zones using ATR/percent filters and aging logic
Assigns a 0–100 institutional strength score and 1–5★ rating to every zone
Builds a per-zone lower-timeframe volume profile with POC, volume delta, and optional volume text
Tracks historical touches, breaks, role reversals, merging, clustering, and divergence at the zone
Runs per-zone backtest stats and feeds that into an adaptive/ML-style confidence weight
Compresses the whole environment into a real-time Info Table: bias, market position, nearest S/R, risk, session
Fires alerts only when something actually matters: strong FVGs, magnetic pull, divergence at a level
If price is the map, this is the layer that tells you which levels are real and which are noise.
🧱 Core Engine — Institutional Zone Logic
Smart FVG Detection
Clean 3-bar gap logic for bullish & bearish FVGs
ATR or % based minimum gap size + optional distance filter from price
Zone aging with max life in bars and optional “reset on touch”
Overlap & proximity control:
Prevent overlapping zones
Enforce minimum bar spacing
Or keep only the strongest zone in a cluster
Institutional Strength & Rating
Each zone gets a score (0–100) + star rating (1–5★) based on:
Volume vs average (with optional lower timeframe split)
Gap size vs ATR
Pivot confluence
Historical meaningful touches
Role reversal (support ↔ resistance)
MTF FVG alignment
Session weighting (Asian / London / NY / overlaps)
Order block overlap & imbalance behavior
VWAP proximity/extremes
Fib level alignment
Delta divergence
Zone clustering & consolidation
Adaptive “performance weight” from historical reactions
Bad zones don’t just look weaker—they literally get filtered out when you enable minimum star / institutional filters.
📊 In-Zone Volume & Profile Intelligence
Each zone can be backed by lower-timeframe volume:
Per-zone volume histogram inside the gap
POC line at the most traded price in that zone
Optional total volume label
POC line color shifts with volume delta (buy vs sell pressure)
Additional bull/bear volume bars alongside the zone and/or numeric volume text inside the box
You’re not just staring at a gap—you’re seeing the liquidity pocket inside the gap.
🎯 Structure, Confluence & Role Reversal
The engine includes deep structural context:
Pivots: stored swing highs/lows for S/R confluence
MTF FVG Confluence: two extra timeframes for higher-timeframe alignment
Fibonacci Levels: auto-mapped 0.236 / 0.382 / 0.5 / 0.618 / 0.786 with optional lines & labels
Order Blocks & Imbalance: engulfing OB detection + volume/imbalance filters
VWAP Intelligence: VWAP proximity/extreme bonuses, optional short-form plotting
Delta Divergence: volume-based confirmation flags for zones under real internal pressure
Smart S/R Positioning & Role Flip
Hide “wrong side” zones or auto-flip roles when broken & retested
Track broken zones for N bars, then retire them
Mark role reversals with badges and strength bonuses
Support/resistance is treated like behavior, not just lines.
🤖 Adaptive Learning & Backtesting
Each zone is monitored when price touches it:
Checks if price respects the zone and moves X points away (success)
Or violates beyond failure threshold (failure)
Tracks successes, failures, and win rate per zone
Feeds a confidence score into an adaptive weight so consistently performing zones matter more
Zones that meet the bar get ML/🤖 marking when enabled
The script doesn’t just say “this looks strong”—it tracks how it actually behaved.
📋 Info Table & Sessions — On-Chart War Room
On the latest bar, an Info Table summarizes:
Zone count (bull vs bear)
Market position (NEAR SUPPORT / NEAR RESISTANCE / ABOVE RESISTANCE / BELOW SUPPORT / NEUTRAL)
Nearest S/R levels
Trade bias (BULLISH / BEARISH / NEUTRAL)
Active session (ASIAN / LONDON / NY / OVERLAP / OFF)
Risk level (LOW / MED / HIGH)
Sessions are coded in EST with multipliers so you can weight London/NY more heavily than Asia if that matches your playbook.
Hover the table for a strategy tooltip: live market posture, suggested behavior near the zones, and context around the current environment.
⚠ Divergence & Alerts
Real-time RSI/OBV/ADX divergence detection at the zone
Flexible visual modes: border, icon, color change, or combinations
Alerts included:
Magnetic Zone Pull (price entering ATR-based “field” of a strong zone)
Strong Bullish FVG
Strong Bearish FVG
Divergence at Zone
Let the chart call you when a real decision point appears, instead of forcing you to stare all day.
🕹 How to Use BK AK-FVG/SR Institutional
1️⃣ Build Bias With Structure
Use the Info Table, star ratings, and where the 4–5★ zones cluster relative to price to decide which side of the tape you’re allowed to trade on.
2️⃣ Only Trade From Strong, Aligned Zones
Focus on 4–5★ zones with confluence (pivots, Fib, OB, VWAP, clustering).
Use the zone body/wick region as your execution area, not some random mid-air candle.
3️⃣ Treat Role Reversal & Clusters as Campaign Nodes
When a strong zone breaks, flips role, and collects touches, that’s campaign territory—not scalp noise.
4️⃣ Use Divergence/Delta as a Brake, Not a Toy
If divergence lights up at your level, respect it: size down, wait for confirmation, or stand down.
5️⃣ Let the Engine Filter Junk For You
Tune volMultiplier, star thresholds, session multipliers, distance filters, and min star rating to match your timeframe and instrument.
This script’s job is to remove your excuse for taking low-quality trades.
📜 Boundaries & Wisdom
King Solomon wrote:
“Do not remove the ancient boundary stone that your fathers have set.”
This tool is built around that idea. It maps where the real boundaries live—where smart money defends, attacks, traps, and reverses.
It will not give you discipline. It will simply remove the illusion that “you didn’t know the level was there.”
🔒 Access & Usage
This is an invite-only TradingView script.
Access is granted at my discretion to traders who take structure, risk, and discipline seriously.
⚔️ BK AK-FVG/SR Institutional — Map the Smart Money Gaps. Trade Only the Real Levels.
May Gd bless your vision, your patience, and every decision you make at the edge. 🙏

15m ORB + FVG (ChadAnt)Core Logic
The indicator's logic revolves around three main phases:
1. Defining the 15-Minute Opening Range (ORB)
The script calculates the highest high (rangeHigh) and lowest low (rangeLow) that occurred during the first 15 minutes of the trading day.
This time window is defined by the sessionStr input, which defaults to 0930-0945 (exchange time).
The high and low of this range are plotted as small gray dots once the session ends (rangeSet = true).
2. Identifying a Fair Value Gap (FVG) Setup
After the 15-minute range is set, the indicator waits for a breakout of either the range high or range low.
A "Strict FVG breakout" requires two conditions on the first candle that closes beyond the range:
The candle before the breakout candle ( bars ago) must have been inside the range.
The breakout candle ( bar ago) must have closed outside the range.
A Fair Value Gap (FVG) must form on the most recent three candles (the current bar and the two previous bars).
Bullish FVG (Long Setup): The low of the current bar (low) is greater than the high of the bar two periods prior (high ). This FVG represents a price inefficiency that the trade expects to fill.
Bearish FVG (Short Setup): The high of the current bar (high) is less than the low of the bar two periods prior (low ).
If a valid FVG setup occurs, the indicator marks a pending setup and draws a colored box to highlight the FVG area (Green for Bullish FVG, Red for Bearish FVG).
3. Trade Entry and Management
If a pending setup is identified, the trade is structured as a re-entry trade into the FVG zone:
Entry Price: Set at the outer boundary of the FVG, which is the low of the current bar for a Long setup, or the high of the current bar for a Short setup.
Stop Loss (SL): Set at the opposite boundary of the FVG, which is the low for a Long setup, or the high for a Short setup.
The trade is triggered (tradeActive = true) once the price retraces to the pendingEntry level.
Risk/Reward (RR) Targets: Three Take Profit (TP) levels are calculated based on the distance between the Entry and Stop Loss:
$$\text{Risk} = | \text{Entry} - \text{SL} |$$
$$\text{TP}n = \text{Entry} \pm (\text{Risk} \times \text{RR}n)$$
where $n$ is 1, 2, or 3, corresponding to the input $\text{RR}1$, $\text{RR}2$, and $\text{RR}3$ values (defaults: 1.0, 1.5, and 2.0).
Trade Lines: Upon triggering, lines for the Entry, Stop Loss, and three Take Profit levels are drawn on the chart for a specified length (lineLength).
A crucial feature is the directional lock (highBroken / lowBroken):
If the price breaks a range level (e.g., simpleBrokeHigh) but without a valid FVG setup, the corresponding directional flag (e.g., highBroken) is set to true permanently for the day.
This prevents the indicator from looking for any subsequent trade setups in that direction for the rest of the day, suggesting that the initial move, without an FVG, exhausted the opportunity.

Dynamic FVG & Trap Zones📘 Dynamic FVG & Trap Zones (DFTZ)
A Hybrid Model Combining Imbalance Mapping, Volume Behavior, and Trap Detection
Concept Overview
“Dynamic FVG & Trap Zones” is built to visualize real-time Fair Value Gaps (FVGs) and identify liquidity trap events inside those gaps using adaptive volume filters and wick-based logic.
Traditional FVG indicators merely mark imbalance zones between consecutive candles, but this model goes further — it measures how volume reaction and price penetration inside those zones reveal potential f alse moves or trap formations by smart money.
⚙️ How It Works
1. FVG Detection
• A Bullish FVG is detected when low > high , showing a price void left by aggressive buying.
• A Bearish FVG forms when high < low , implying a selling imbalance.
• These zones are automatically drawn as semi-transparent boxes that extend forward for 10 bars and decay once they exceed the configurable lookback window.
2. Volume Normalization & Grading
• Every bar’s volume is compared against a dynamic SMA( volLookback ) average to calculate a Volume Grade = current vol / avg vol.
• Only bars exceeding the Min Volume Grade threshold are eligible to generate valid FVG zones, ensuring that low-participation moves are ignored.
• The Trap Volume Threshold sets how quiet the reaction bar must be (relative to average volume) to qualify as a trap event.
3. Trap Detection Logic
• Each active FVG zone monitors incoming candles.
• A potential trap is triggered when price re-enters the zone (body or wick depending on settings) but fails to expand with confirming volume.
• If the event occurs inside a Bullish FVG, it marks a Bear Trap (green zone turned red).
If it happens inside a Bearish FVG, it flags a Bull Trap (red zone turned green).
• This reversal in zone color visually conveys trapped liquidity and potential directional fade.
4. Exclusivity and Cooldown Control
• To avoid signal clustering, you can choose exclusivity modes:
Allow Both, Bear over Bull, or Bull over Bear.
• A built-in per-signal cooldown timer prevents back-to-back plots of the same type, enhancing signal clarity during rapid price action.
5. Adaptive Visualization
• Wick-based vs body-based trap detection (toggleable).
• Optional cooldown filtering on shapes ensures the chart only displays validated events.
• Old FVG boxes are pruned automatically beyond the chosen lookback horizon.
🧠 Why It’s Different
Unlike static FVG detectors or simple liquidity sweep tools, DFTZ blends:
• Volume context (Smart Volume Grade filtering)
• Behavioral trap detection within imbalance zones
• Dynamic cooldown mechanics that control over-signaling
• Forward-propagating zones that self-expire gracefully
This synergy makes it a compact yet powerful tool for visualizing imbalances + liquidity traps in one framework — ideal for discretionary traders combining SMC concepts with volume analytics.
📈 How to Use
• Primary Context: Use on 15 min to 1 h charts to spot active FVG zones forming after impulsive moves.
• Trap Signal Interpretation:
• 🔴 “Trap” below bar → Bullish reversal (Bear Trap).
• 🟢 “Trap” above bar → Bearish reversal (Bull Trap).
• Combine With: Market structure breaks, VWAP, or delta volume tools to confirm true reversal intent.
• Alerts: All major events (FVG creation & trap confirmation) trigger ready-to-use alerts for automation or back-testing.
🧩 Customization
Setting Function
Max FVG Lookback Controls how long old zones remain active.
Volume SMA Period Defines the baseline for volume grading.
Min Volume Grade & Trap Volume Threshold Tune the sensitivity of trap confirmation.
Wick-Based Trap Detection Enable to capture wick rejections inside zones.
Signal Cooldown Prevents rapid multiple plots on successive bars.
⚠️ Disclaimer
This tool is designed for educational and analytical purposes only. It does not constitute financial advice or guarantee trading performance. Always conduct your own analysis and risk management before entering a position.

[Yorsh] BJN CTF FVG & Trade Helper v1.01. Executive Summary
The BJN CTF FVG & Trade Helper v1.0 is an advanced, systematic trading tool designed for precision and objectivity in the futures market. Built on the high-speed PineScript v6, this indicator moves beyond simple FVG plotting by integrating a complete, rules-based trade execution model known as the "iFVG" (inverted Fair Value Gap) setup.
Its core purpose is to identify specific, high-probability trade scenarios, validate their structural integrity, and provide an automated position sizing and risk management visual directly on the chart. The indicator's primary competitive advantage lies in its strict, logical trade validation engine and its unwavering focus on performance, ensuring it can analyze complex market structures in real-time without causing chart lag. It is a complete "trade helper" designed to enforce discipline and automate complex analysis.
2. Core Features Overview
This indicator is built around a proprietary trade logic engine that automates a sophisticated trading model from start to finish (www.bjnfx.com).
A. Intelligent Fair Value Gap (FVG) Detection
Dynamic Sizing Rules: The indicator doesn't just find FVGs; it qualifies them. It automatically applies different minimum size requirements (in points) for the volatile NY session versus quieter, non-NY hours, filtering out insignificant noise.
Composite FVG Merging: In a unique and advanced feature, the script can identify two small, back-to-back, invalid FVGs and merge them into a single, valid composite FVG. This allows it to find powerful trade setups that other FVG indicators would miss entirely.
Live FVG Hints: An optional feature shows potential FVGs forming on the live, developing candle, giving you a valuable edge in anticipating the next setup.
B. The "iFVG" Trade Logic Engine
This is the heart of the indicator. It's a complete, long/short trading model that operates in distinct states:
Detection: Identifies a valid FVG.
Inversion: Waits for price to decisively close through the FVG, turning it from a potential continuation area into an "inversion" point (iFVG).
Structural Validation: This is the critical step. Before confirming a trade, the engine performs a rigorous, automated scan of the entire price leg to ensure:
The Invalidation Point (IP)—the last protective swing high/low—has not been contaminated.
No opposing "Hazard" FVGs have been touched, which would compromise the setup.
Confirmation: If the structure is clean, the indicator signals a confirmed trade setup with a marker ('L' for Long, 'S' for Short) and highlights the trigger candle.
C. Automated Position Sizing & Risk Management
Upon a confirmed trade signal, the "Trade Helper" instantly activates:
Dynamic Stop Loss Calculation: The SL is not placed arbitrarily. It is intelligently calculated based on the most logical structural point within the trading leg, using other nearby FVGs as potential support/resistance.
Bracketed Sizing: Based on the calculated SL in points, the indicator references a built-in risk matrix to determine the appropriate number of contracts to trade (e.g., a 5-point SL might suggest 10 contracts, while a 10-point SL suggests 5). This enforces consistent risk.
Full Visual Overlay: It draws a clear, color-coded box on your chart showing the precise Entry, Stop Loss (SL), Hard Stop (2x SL), and Take Profit (TP) levels, along with the calculated contract size.
D. Informative Status Panel
A clean, non-intrusive panel at the bottom of the screen keeps you constantly aware of the trade engine's status. It clearly displays whether the Bullish and Bearish engines are "Idle," "Armed" (a setup is developing), "Triggered," or "Invalidated," so you always know what the script is monitoring.
3. The Performance Advantage: Built for Speed and Scalpers
High-frequency logic can cripple a trading platform. This indicator was built from the ground up to prevent that, making it superior for traders who value a responsive, lag-free experience.
Strict Bar Lookback (maxLookbackBars): This is the key performance feature. The user defines a maximum number of historical bars (e.g., 200) for the script to analyze. Any FVG or price structure older than this limit is completely ignored and removed from memory. This prevents the script from bogging down your chart with thousands of irrelevant historical objects.
Timeframe-Specific History Limits: The script automatically applies even stricter history limits on lower timeframes (e.g., 15-second charts only process the last 15 minutes of data), ensuring it remains exceptionally fast for scalping.
Surgical Array Pruning: On every bar, the indicator actively scans its memory for "stale" FVG objects that have fallen outside the lookback window. It then deletes their drawings and removes them from the active array, ensuring the logic engine is only ever processing a small, relevant, and recent dataset.
Efficient State Management: The logic is contained within a highly structured "engine." This prevents redundant calculations and ensures complex structural scans are only performed when a potential trade is actively developing, not on every single price tick.
The result is an institutional-grade algorithmic tool that runs with the speed and lightness of a simple moving average, giving you a decisive edge in execution.
4. Ideal User Profile
This indicator is purpose-built for:
Systematic & Rules-Based Traders: Individuals who want to remove emotion and subjectivity and trade a precise, repeatable model.
Scalpers & Intraday Futures Traders: Particularly those on NQ/MNQ, who require a high-performance tool that can keep up with fast-moving markets.
ICT iFVG Traders: Traders familiar with FVGs/iFVGs, invalidation points, and structural validation will find this tool automates the most tedious and error-prone parts of their analysis.
5. Conclusion
The BJN CTF FVG & Trade Helper v1.0 is more than just an indicator; it is a semi-automated trading assistant. It provides a clear, objective, and highly-validated trade model designed to enforce discipline. Its defining characteristic is its sophisticated logic engine, combined with a performance-first architecture that sets a new standard for what traders should expect from their analytical tools. For the systematic trader, it offers an unparalleled blend of precision, automation, and speed.

CHOCH + FVG Signals [30m Optimized]CHOCH + FVG Signals
🎯 What It Does:
This script automatically scans your chart for high-probability Smart Money Concepts (SMC) setups based on two key institutional trading principles:
Change of Character (CHOCH) – A shift in market structure signaling potential reversal
Fair Value Gap (FVG) – An imbalance zone where price moved too fast, often acting as support/resistance
When both conditions align, the script plots clear Buy (▲) and Sell (▼) signals directly on your chart — ideal for intraday trading on the 30-minute timeframe (but works on any timeframe).
✅ Key Features:
🔹 Visual Fair Value Gaps
Green shaded zones = Bullish FVGs (potential support)
Red shaded zones = Bearish FVGs (potential resistance)
Toggle on/off in settings
🔹 Smart CHOCH Detection
Detects breaks of recent swing highs/lows with proper context
Avoids false signals by confirming prior price structure
🔹 Clear Trade Signals
Green ▲ below bar = Buy signal (Bullish CHOCH + FVG confluence)
Red ▼ above bar = Sell signal (Bearish CHOCH + FVG confluence)
🔹 Customizable Filters
Option to require FVG for a signal (recommended for higher accuracy)
Adjust sensitivity via swing detection settings (default optimized for 30m)
🔹 Alert-Ready
Built-in alert conditions for instant notifications on TradingView mobile/desktop
⚙️ How to Use:
Apply to a 30-minute chart (e.g., EURUSD, Gold, NAS100, BTC)
Wait for at least 50–100 bars to load (so swing points appear)
Look for:
A green triangle (▲) → consider long entry near FVG support
A red triangle (▼) → consider short entry near FVG resistance
Confirm with price action: Wait for a strong candle close or rejection at the FVG zone
Use stop-loss below/above the FVG and target recent liquidity pools
💡 Pro Tip: Best used during high-volume sessions (e.g., London Open 7–10 AM UTC, NY Open 12:30–3:30 PM UTC).
🛠️ Settings (Inputs):
Show Fair Value Gaps
✅ Enabled
Visualize FVG zones
Max FVG History
100 bars
Prevent chart clutter
Require FVG for Signal?
✅ Enabled
Higher-quality setups (disable to test CHOCH-only)
⚠️ Important Notes:
This is a signal generator, not financial advice. Always manage risk.
Works best in trending or breaking markets — avoid during low-volatility ranges.
FVGs may get filled (tested) before price continues — patience improves results.
Backtest on historical data before live trading.
📣 Ideal For:
Retail traders learning Smart Money Concepts (SMC)
Price action traders seeking institutional-level confluence
Intraday scalpers & swing traders on 30m–1H timeframes

ICT Multi-Timeframe FVG & Order Flow SuiteICT Multi-Timeframe FVG & Order Flow Suite
A comprehensive Inner Circle Trader (ICT) analysis tool that combines multiple timeframes, Fair Value Gap detection, order flow tracking, and smart money concepts into one powerful indicator.
🎯 Key Features
Higher Timeframe FVG Detection
Simultaneously tracks FVGs across 4H, Daily, Weekly, and Monthly timeframes
Visual differentiation between active and mitigated HTF FVGs
BAG (Breaker And Gap) identification
Intelligent filtering system to align with HTF bias
Real-time status table showing current HTF FVG states
Current Timeframe Analysis
Automatic bullish/bearish FVG detection
2CR (2 Candle Reversal) tracking with visual markers
Mitigation monitoring with color-coded states
Customizable display limits and filtering options
Order Flow Legs
Dynamic order flow box highlighting price expansion
50% equilibrium level marking
Smart locking mechanism based on FVG mitigation
Real-time updates as price extends
ITH/ITL Pivot System
Intermediate Term High/Low detection
Run vs Sweep identification with directional labels
Mitigated and unmitigated level tracking
Visual distinction between respected and disrespected levels
Advanced Filtering
Hide opposing timeframe FVGs based on HTF bias
Filter current TF FVGs by type (bullish/bearish)
"Last Mitigated Only" mode to reduce chart clutter
Customizable maximum display limits per timeframe
📈 What Makes This Different?
Multi-Timeframe Integration: See how HTF FVGs align with your trading timeframe in real-time
Smart Bias Detection: Automatically determines market bias from highest to lowest enabled timeframe
Comprehensive Alerts: 12 distinct alert conditions covering FVG creation, mitigation, 2CR events, and pivot breaches
Professional Visualization: Clean, customizable colors and styles with minimal chart clutter
Status Dashboard: Quick-reference table showing the state of all tracked HTF FVGs
⚙️ Customization Options
Individual toggle controls for each HTF
Adjustable colors for bullish, bearish, active, and mitigated states
Boundary lines, origin markers, and mitigation lines
Configurable label sizes and positions
Line extension controls
Optional EMA overlay
🔔 Alert System
Set alerts for:
New FVG creation (bullish/bearish)
FVG mitigation events
2CR respect/disrespect
ITH/ITL runs and sweeps
💡 Best Practices
Start with Daily/Weekly HTF FVGs to identify overall bias
Use filtering to focus on trade direction aligned with HTF
Monitor 2CR events for confirmation of price acceptance/rejection
Combine with order flow legs to identify high-probability setups
Use the status table for quick multi-timeframe analysis
📚 Suitable For
ICT methodology traders
Smart Money Concept (SMC) practitioners
Multi-timeframe analysts
Swing and intraday traders
Anyone seeking institutional order flow insights
Note: This indicator is designed for educational purposes and works best when combined with proper risk management and additional confirmation methods. Understanding ICT concepts is recommended for optimal use.
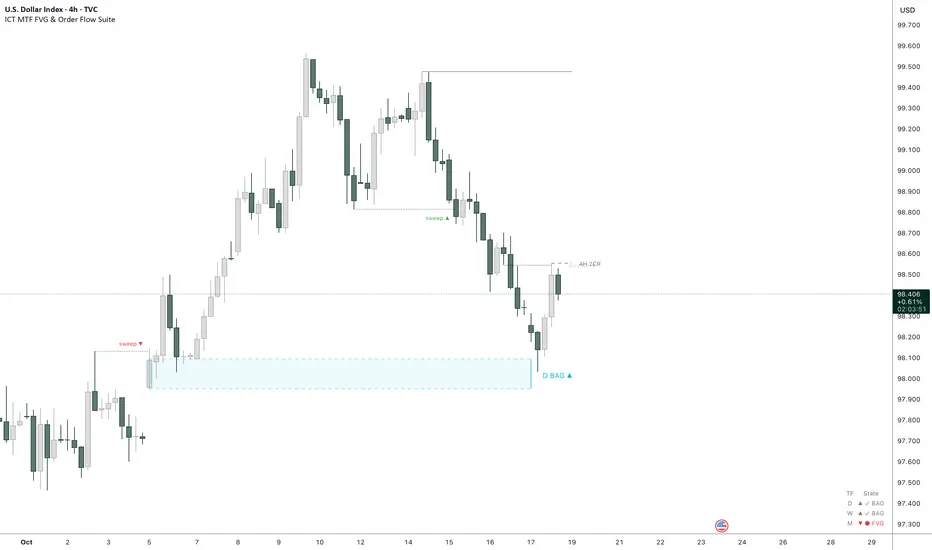
Market Imbalance Tracker (Inefficient Candle + FVG)# 📊 Overview
This indicator combines two imbalance concepts:
• **Squared Up Points (SUP)** – midpoints of large, "inefficient" candles that often attract price back.
• **Fair Value Gaps (FVG)** – 3-candle gaps created by strong impulse moves that often get "filled."
Use them separately or together. Confluence between a SUP line and an FVG boundary/midpoint is high-value.
---
# ⚡ Quick Start (2 minutes)
1. **Add to chart** → keep defaults (Percentile method, 80th percentile, 100-bar lookback).
2. **Watch** for dashed SUP lines to print after large candles.
3. **Toggle Show FVG** → see green/red boxes where gaps exist.
4. **Turn on alerts** → New SUP created, SUP touched, New FVG.
5. **Trade the reaction** → look for confluence (SUP + FVG + S/R), then manage risk.
---
# 🛠 Features
## 🔹 Squared Up Points (SUP)
• **Purpose:** Midpoint of a large candle → potential support/resistance magnet.
• **Detection:** Choose *Percentile* (adaptive) or *ATR Multiple* (absolute).
• **Validation:** Only plots if the preceding candle does not touch the midpoint (with tolerance).
• **Lifecycle:** Line auto-extends into the future; it's removed when touched or aged out.
• **Visual:** Horizontal dashed line (color/width configurable; style fixed to dashed if not exposed).
## 🔹 Fair Value Gaps (FVG)
• **Purpose:** 3-candle gaps from an impulse; price often revisits to "fill."
• **Detection:** Requires a strong directional candle (Marubozu threshold) creating a gap.
• **Types:**
- **Bullish FVG (Green):** Gap below; expectation is downward fill.
- **Bearish FVG (Red):** Gap above; expectation is upward fill.
• **Close Rules (if implemented):**
- *Full Fill:* Gap closes when the opposite boundary is tagged.
- *Midpoint Fill:* Gap closes when its midpoint is tagged.
• **Visual:** Colored boxes; optional split-coloring to emphasize the midpoint.
> **Note:** If a listed FVG option isn't visible in Inputs, you're on a lighter build; use the available switches.
---
# ⚙️ Settings
## SUP Settings
• **Candle Size Method:** Percentile (top X% of recent ranges) or ATR Multiple.
• **Candle Size Percentile:** e.g., 80 → top 20% largest candles.
• **ATR Multiple & Period:** e.g., 1.5 × ATR(14).
• **Percentile Lookback:** Bars used to compute percentile.
• **Lookback Period:** How long SUP lines remain eligible before auto-cleanup.
• **Touch Tolerance (%):** Buffer based on the inefficient candle's range (0% = exact touch).
## Line Appearance
• **Line Color / Width:** Customizable.
• **Style:** Dashed (fixed unless you expose a style input).
## FVG Settings (if present in your build)
• **Show FVG:** On/Off.
• **Close Method:** Full Fill or Midpoint.
• **Marubozu Wick Tolerance:** Max wick % of the impulse bar.
• **Use Split Coloring:** Two-tone box halves around midpoint.
• **Colors:** Bullish/Bearish, and upper/lower halves (if split).
• **Max FVG Age:** Auto-remove older gaps.
---
# 📈 How to Use
## Trading Applications
• **SUP Lines:** Expect reaction on first touch; use as S/R or profit-taking magnets.
• **FVG Fills:** Price frequently tags the midpoint/boundary before continuing.
• **Confluence:** SUP at an FVG midpoint/boundary + higher-timeframe S/R = higher quality.
• **Bias:** Clusters of unfilled FVGs can hint at path of least resistance.
## Best Practices
• **Timeframe:** HTFs for swing levels, LTFs for execution.
• **Volume:** High volume at level = stronger signal.
• **Context:** Trade with broader trend or at least avoid counter-trend without confirmation.
• **Risk:** Always pre-define invalidation; structures fail in chop.
---
# 🔔 Alerts
• **New SUP Created** – When a qualifying inefficient candle prints a SUP midpoint.
• **SUP Touched/Invalidated** – When price touches within tolerance.
• **New FVG Detected** – When a valid gap forms per your rules.
> **Tip:** Set alerts *Once Per Bar Close* on HTFs; *Once* on LTFs to avoid noise.
---
# 🧑💻 Technical Notes
• **Percentile vs ATR:** Percentile adapts to volatility; ATR gives consistency for backtesting.
• **FVG Direction Logic:** Gap above price = bearish (expect up-fill); below = bullish (expect down-fill).
• **Performance:** Limits on lines/boxes and auto-aging keep things snappy.
---
# ⚠️ Limitations
• Imbalances are **context tools**, not signals by themselves.
• Works best with trend or clear impulses; expect noise in narrow ranges.
• Lower-timeframe gaps can be plentiful and lower quality.
---
# 📌 Version & Requirements
• **Pine Script v6**
• Heavy drawings may require **TradingView Pro** or higher (object limits).
---
*For best results, combine with your existing trading strategy and proper risk management.*

Fair Value MSThis indicator introduces rigid rules to familiar concepts to better capture and visualize Market Structure and Areas of Support and Resistance in a way that is both rule-based and reactive to market movements.
Typical "Market Structure" or "Zig-Zag" methods determine swing points based on fixed thresholds (length or percentage). While this does provide rigid structure, the results may be lagging or confusing due to the timing, since it is fixed to static parameters.
I believe the concept of Fair Value Gaps can solve this problem.
As you will notice, there are no length settings in this indicator.
> FVG Market Structure
Fair Value Gaps are a well known concept used to indicate directional intent, forming when price moves aggressively in one direction, leaving behind an imbalance between buyers and sellers. While the term FVG was popularized by ICT, the underlying concept predates them, known historically as imbalances, inefficiencies, or liquidity voids in institutional trading.
Note: For simplicity, in this indicator they'll be called FVGs.
By reading into this, we are able to clearly and rigidly define market structure simply by "looking" at the chart, using objective price events rather than subjective interpretation, or lengths.
By using FVGs to determine structure direction, the length, and speed of identification lies entirely on the market. If an FVG Down occurs immediately after a New Higher High forms, it is reasonable to assume there was a seller at that point, so the script would indicate a New Swing High.
The script is NOT stuck, waiting for a % retrace, or # bars to pass to identify it as such.
Sometimes the market is in a steady trend in a single direction and no FVGs form; therefore, no structure forms. -> Why would we try to impose structure on a clear trend?
Ultimately, the FVG Structure Method uses real reactions from the market to determine Market structure, and is not fixed to specific parameters.
As with other market structure indicators, "Market Structure Breaks" are still identifiable when price moves outside the most recent swing points.
These are helpful to indicate larger direction. In the following section you will see how these help us determine when we should start the search for an "Area of Interest (AOI)".
> Areas of Interest (AOIs)
"Area of Interest (AOI)" is a generalized term, and could refer to many types of zones you might recognize under different names. While the AOIs in this indicator are specialized in their own way, I have chosen to simply use the term "Area of Interest" because it’s more important to understand how they behave and why they exist than to focus on what they’re called.
The goal of an AOI is to point out reasonable areas where buyers or sellers may be staging, as is typical with support and resistance.
In order to reasonably identify these areas, we look for cause and effect relationships. When considering these relationships, it's easier to understand the placement of the points to define each zone.
(Buyer Examples)
Cause: Strong Buyers step in at Swing Low
Effect: Fair Value Gap Forms
Cause: Sustained Buying Pressure
Effect: Market Structure Breaks
In this example, The zone is drawn from the Swing Low, to the Bottom of the FVG closest to the swing point.
In theory, the participation at the swing point was strong and aggressive enough to create the FVG imbalance. Which then found acceptance and continued into a Market Structure Break. So with these AOIs, we are trying to locate the aggressive Buyers or Sellers which were positioned BEFORE the FVG.
These Zones are intended to act as areas to look for reactions from market participants, to judge where price may be going. When revisiting these zones, we look for a reaction or a break, to further provide us information to if the buyers or sellers are still there.
As seen in the screenshot above, The information we gain is not from the creation of these zones, but from the behavior we witness when these zones are revisited.
Technical Note: In this indicator, Market Structure Breaks are only considered when price closes outside the recent swing points. Wicks are not considered as confirmation, therefore are not used to detect structural breaks.
Inside each AOI you can optionally display a readout of the volume which accumulated during the time starting at the swing point and going until the closing bar of the FVG.
Note: We are counting volume until the closing bar of the FVG since the FVG is a 3 bar formation, and aggressive volume is required throughout to create the imbalance.
There are multiple FVGs that typically occur in a single direction, but we do not look to every single one to be indicative of structure, only the first FVG in the opposite direction of the previous direction (which is determined by previous FVGs)
You will probably notice, the AOIs do not form from the closest swing or FVG to the break, this is because we are targeting larger directional changes to draw these AOIs from.
Since they do not always happen perfectly every time, the AOI formation waits for an FVG to occur AND a Market structure break to happen. One without the other will result in no Zone displaying.
> Reflection Lines
While they may seem slightly redundant, Reflection Lines serve as reminders of previous support and resistance pivots. They are drawn at the same Pivots where and AOI is formed, and extend beyond the mitigation of the AOI.
These lines are often points of price to look for "Support Flips", a re-test pattern where price trades through previous support (or resistance) then returns to it and rejects, continuing into a larger move or trend.
Their namesake is based on the behavior of price, "reflecting" at these levels.
The Reflection lines are simple and change color based on price's location.
If price is above, we would typically look to a reflection line in with support in mind.
As a basic filter, these lines use an average price to determine their color, this way they will not change their color as frequently in choppy situations.
> Session Start/End Lines
For analysis purposes and trade review, it is helpful to analyze with context.
For that reason, I have implemented start and end session lines into the indicator, these are helpful when reviewing historical charts to not provide additional context.
By default, they are set to the NYSE Session, but can be changed to fit any needs.
These lines are not advanced, and simply draw a line as the chart passes the start and end of the sessions. It's very likely that you may need to adjust the session for your specific needs.
Note: The Timezone can be adjusted within the code if needed. By Default, the indicator uses "America/New_York" Timezone.
> Conclusion
If you’ve ever felt like your structure tools were confusing or lagging, drawing zones too late, or zones that simply don't make sense, this should feel like a breath of fresh air.
By removing arbitrary length settings and instead using FVGs to define structure and as a basis for AOIs, you're getting a more accurate look at what price is doing and where it's reacting from.
This indicator is rule-based, reactive, and aims to keep things logical without fluff or false confidence.
Enjoy!

ACE FVG & IFVG Trading System1. What the Script Does
The "ACE FVG & IFVG Trading System " is a TradingView Pine Script (version 5) that identifies and trades Fair Value Gaps (FVGs) and Inverse Fair Value Gaps (IFVGs). It offers:
Detection of bullish/bearish FVGs and IFVGs with customizable parameters.
Multiple entry types: regular FVG retracement, Break of Structure (BOS), breakaway gaps, and Immediate/Retrace IFVG entries.
A pending setup system showing potential trades before they trigger.
Risk management with configurable stop loss (SL) and take profit (TP) based on FVG levels, swing points, or risk-reward ratios.
Market structure analysis using swing highs/lows, BOS, and Market Structure Shifts (MSS).
Time filters to restrict trading to specific sessions.
Visualizations including FVG boxes, trade boxes, pivot lines, and labels.
Entry and performance tables displaying trade details and metrics like win rates and P&L by entry type.
2. How It Works
The script is organized into modular sections for efficient execution:
Inputs: Extensive customization options (e.g., FVG size, entry types, SL/TP modes, time filters) grouped for clarity.
Data Structures: Custom types (FVGData, SwingPoint, EntryData) store FVG, pivot, and trade data in arrays.
Utility Functions: Handle calculations like risk-reward ratios, time validation, and trade size filtering.
Swing Point Detection: Uses ta.pivothigh/ta.pivotlow to identify pivots, supporting BOS/MSS and SL/TP calculations.
FVG Detection: Identifies regular FVGs (low > high or high < low ) and IFVGs (mitigated FVGs with immediate or retrace signals).
Entry Logic: Triggers trades based on user-enabled conditions (e.g., retracement, BOS, breakaway gaps) with dynamic SL/TP.
Trade Management: Tracks active/pending trades, updates visualizations (boxes, lines, labels), and handles cancellations/invalidations.
Main Logic: Executes on each bar to detect FVGs, process entries, update trades, and manage visualizations.
Tables: Displays recent trades and performance stats (e.g., win rates by entry type) on the last bar.
Pivot Visualization: Plots swing points with dynamic extensions and mitigation status (solid/dotted lines).
3. How to Use It
Add to TradingView:
Open Pine Editor, paste the script, save it, and add to chart.
Configure Inputs:
Access settings via chart (right-click indicator > Settings).
Adjust:
fvgMinSize for market volatility (e.g., 5 for forex).
Entry types (e.g., enable IFVG, disable breakaway gaps).
SL/TP modes and minimum R:R (e.g., 2.0 for 1:2).
Time filters for active sessions (e.g., 09:30-16:00).
Visual settings (box transparency, table positions).
Interpret Output:
FVG Boxes: Green (bullish), red (bearish), purple (IFVG/mitigated).
Trade Boxes: Gray-green/red-gray (pending), green/red (active), updated for win/loss.
Pivot Lines: Solid (unmitigated), dotted (mitigated).
Tables: Entry table shows trade details; performance table shows win rates/P&L.
Trading:
Monitor pending setups for entry signals.
Enter manually at active trade levels, following SL/TP.
Use performance stats to refine settings.
Test on demo charts and adjust for market/timeframe.
Best Practices:
Use higher timeframes (e.g., 1H, 4H) for less noise.
Combine with other analysis (e.g., support/resistance).
Backtest using TradingView’s replay feature.
Originality
The script is original due to its unique combination of features:
Enhanced IFVG Strategy: Dual Immediate/Retrace IFVG modes with a novel “Immediate Then Retrace” preference.
Pending Setup System: Proactive visualization of potential trades with auto-cancellation.
Granular Performance Tracking: Detailed breakdown of win rates/P&L by entry type (regular FVG, IFVG, breakaway).
Dynamic Pivot Visualization: Real-time mitigation updates (solid to dotted lines).
Modular Design: Custom types and organized logic for extensibility. It builds on general FVG concepts (e.g., from ICT) but implements unique logic and features not found in standard
TradingView FVG scripts, distinguishing it from both open-source and premium indicators.
Credit of Concepts to ICT
Collaborations with JMAC and Timeless

CandelaCharts - 1st Presented FVG 📝 Overview
The ICT 1st Presented Fair Value Gap refers to the first FVG that forms after the market opens at 9:30 AM New York local time. In a sideways market, it often acts as a catalyst for price movement in either direction, while in trending conditions, it tends to support and reinforce the prevailing trend.
This indicator automatically identifies the first Fair Value Gap (FVG) that forms after the New York session opens at 9:30 AM local time. Based on concepts taught by Inner Circle Trader (ICT), the 1st Presented FVG is a key institutional price imbalance that often sets the tone for the trading day.
📦 Features
Customize FVG session time (e.g. 09:30 – 10:00)
Show/hide session dividers
FVG visibility filter (e.g. Bullish / Bearish)
Advanced styling
Hide overlapping FVGs
Extend FVGs
Opening prices
⚙️ Settings
Show: Controls whether all, bullish only, or bearish only FVGs are displayed on the chart.
Session: Sets a specific time window (e.g. 09:30–10:00) to filter which FVGs are displayed.
Dividers: Toggles vertical session divider on the chart for visual separation.
Midline: Displays a midpoint (CE) line through the FVG; customizable color and thickness.
Border: Adds a border around each FVG zone.
Labels: Toggles label display for FVGs.
Hide Overlap: Hides overlapping FVGs to reduce visual clutter.
Extend: Extends each FVG forward in time.
Alerts: Enables alerts when price interacts with an FVG zone.
Opening Prices: Allows defining custom time-based levels (e.g. 00:00–00:01 and 18:00–18:01) with color and style options.
⚡️ Showcase
Simple
Labels
Bordered
Consequent Encroachment
Extended
Dividers
📒 Usage
How to Use the ICT 1st Presented Fair Value Gap in Trading
To apply the ICT 1st Presented Fair Value Gap (FVG), identify the first fair value gap of the day and extend it across the chart until 3:45 PM New York time.
You’ll often notice that some of the best trade setups form around this level. It tends to act as a key reference point for price action during the day—especially on trending days, where price frequently returns to this gap before continuing in its direction.
This level can also serve as an inverse fair value gap, offering opportunities in the opposite direction under the right conditions.
How to Disqualify the 1st Presented Fair Value Gap?
When the first fair value gap forms after 9:30 AM New York time, check the candles that came just before it.
If the candlestick that creates the FVG doesn’t break above or below the range of those previous candles, then it’s not a true inefficiency. In that case, it’s considered a disqualified 1st Presented Fair Value Gap—meaning it shouldn’t be used as a key reference level.
Refer to the example below to see what this looks like on the chart.
🚨 Alerts
This script provides alert options for all signals.
Bearish Signal
A bearish signal is triggered when the bearish 1st P.FVG is formed in interval 09:30 - 10:00.
Bullish Signal
A bullish signal is triggered when the bullish 1st P.FVG is formed in interval 09:30 - 10:00.
⚠️ Disclaimer
Trading involves significant risk, and many participants may incur losses. The content on this site is not intended as financial advice and should not be interpreted as such. Decisions to buy, sell, hold, or trade securities, commodities, or other financial instruments carry inherent risks and are best made with guidance from qualified financial professionals. Past performance is not indicative of future results.
