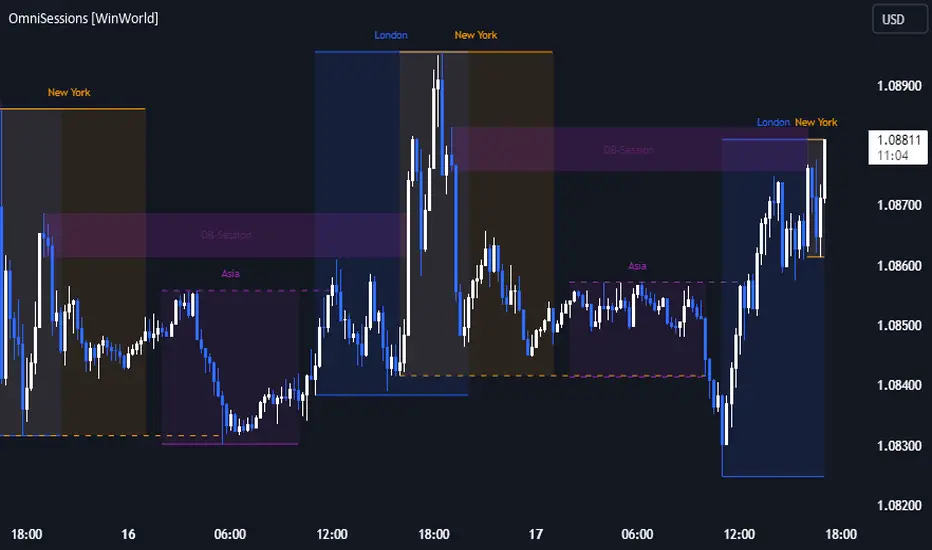
OmniSessions [WinWorld]The indicator shows the range of 4 most popular sessions (New York, Tokyo, London, Sydney). Sessions are used to identify zones with maximum volatility, as well as to find entry points. Session boundaries can act as POI no worse than OrderBlock.
In addition to sessions, you can use settings with KillZones - a range within a session that has potentially high volatility.
Silver Bullet is a more advanced range that allows you to identify the potential for maximum volatility. Excellent entry points can be obtained on the sweep of the range or from the nearest orderblock. We will explain it a bit deeply below.
Why use sessions?
During specific sessions big financial instutions from specific parts of the world enter the market, and this fact alone let us find the most "liquid" sessions in order to catch the best price movements. If talking about orderblocks, it is just a point of interest (more precisely, it is actually a zone of interest), which usually is a zone where the signficant amount of limit orders lies, and when price enter such zone, it immediately shows a strong reaction with either breakout from this zone or it bounces against this zone.
How is this indicator different from others?
There a lot of orderblocks indicator out here publicly available, but huge portion of them doesn't take into calculation important smart money concepts, such as valid pullbacks, for example. Valid pullbacks is a concept of price movement, which lets us indentify quite precisely price's impulses. Based on this impulses, we search our orderblocks. This approach allows to catch the most relevant and highly liquid orderblocks, which present traders with best trade entry opportunities, because usually, when entering with these orderblocks, you follow the moves of big money players, and that gives trader an edge in trading. None of open-source indicators uses such approach ( we've studied all of them ). Also an important notice: no public code is utilized in this indicato whatsoever. We've build our own flexible session mechanism, which allows you to quickly change between different type of sessions and also choose which session to use. And the big thing is our own alorithm to deal with asset, trading sessions of which are quite exotic (such as DAX and MEOX indexes, which close and open at different times of the day, which makes it hard for indicator to catch by default), so with indicator you can enjoy trading by sessions with no "bugs".
And the most user-desired and important thing: we've implemented feature to set winter and summer seasons for sessions, and this solves life-long struggle of traders to set correct trading session time, when forex exchanges switch trading hours, so now you don't need to info which our summer or winter is traded by, but just switch between seasons by one button in our indicator. And we can proudly state, no sesions indicator in the TradingView has such feature , so feel free to use it now on our indicator.
How orderblocks are built?
When London, New York or Asia ends, we find the closest orderblocks above and below closed session's high and low respectively. We do it by finding so called valid pullbacks ( was explained above ), then searching for valid fair value gap (FVG), that is inside of some valid pullbacks, and if we find it, then the orderblock is established and you will live orderblock and fair value gap (FVG) box ( both are colored in closed session's colour ).
How are orderblocks and FVG displayed on the chart?
Live orderblock and FVG are displayed as boxes on the chart, that are plolonged each bar if price didn't reach the orderblock.
Some important details:
When price touches FVG, FVG then is modified to reflect how much of untouched FVG is left. You will see it as decreasing of FVG box size in live mode. If price fully takes over FVG, FVG deletes;
When price touches orderblock, orderblock stops being prolonged and stays on the chart and is considered as worked-out.
These featues allow you to fully see live orderblocks and FVGs (if they exist) and already worked-out orderblocks to see how useful they were in the history.
Is that it?
No, because our indicator also shows sessions sweeps, which is historically a good indication that price grabbed the liquidity of previously closed sessions and now has enough "power" to do big movements, which is a good thing for traders, because it allows them to catch big movements and profit big.
Ok, we've covered the basics, now let's talk about what exactly this indicator can do.
OmnISessions is all-in-one sessions' indicator, that cointain:
Sessions (Automatic adaptation to your time zone)
Kill Zones
Silver Bullets
Session Sweeps
Order Blocks (Session, Killzone, SilverBullet)
Easily switch between summer and winter seasons
Now you don't need to look for opening and closing times of stock exchanges: the algorithm itself adjusts the session times according to your timezone. Just change the seasonality: winter/summer and the session times will be clearly displayed on your chart.
A quick view of the settings:
Show: Sessions, KillZones or SilverBullet
Season selection: Winter/Summer
Session Color Selection
Visuals:
Show/Hide session name - displays session name (ex.: London, New York, Silver Bullet and etc.) on the chart;
Show/Hide session box - displays session range as box with coloured background on the chart;
Show/Hide High/Low sessions - displays two horizontal lines for higher and lower borders of the session;
Show/Hide OrderBlocks - displays worked-out orderblocks in the history with live orderblocks and their fair value gaps (FVGs);
Show/Hide live Session High/Low - displays higher and lower border of the session as lines, that are prolonged each bar even after the session ends;
Show/Hide Session Sweeps - displays session sweeps of higher and lower border as dotted line;
Dividers (alternative session display):
Horizontal Divider
Backgrounder coloring
Customization: choose the display type: Sessions, Killzones or Silver Bullet.
The indicator displays orders that are above or below the previous session boundaries.
Below are Killzones with Order Blocks:
And this is Silver Bullet with Order Blocks:
Overall, you can clearly see that orderblocks, sessions sweeps and different type of sessions in one indicator allow you to fully utilize your time and mental energy, because finding orderblocks with valid pullbacks by hand is quite time-costly task, but finding them on different type of sessions, while not knowing trading hours of current trading session, is the true hell of work. OmniSessions indicator performs all of these calculations by itself, so you can focus on finding the best entries, while checking the situation on different sessions at the same time.
We hope that you will find great use of OmniSessions!
Search in scripts for "fvg"
Momentum Master v1# Momentum Master v1 - Multi-Strategy Trading System
## SCRIPT OVERVIEW
Momentum Master v1 is a multi-strategy trading system that integrates 6 distinct trading methodologies (EMA Crossover, RSI Mean Reversion, Breakout, MACD Crossover, Bollinger Bands, Volume Breakout) through a shared risk management pipeline. This script implements a proprietary integration framework that creates synergistic value beyond what individual indicators provide, combining advanced technical analysis techniques with institutional flow analysis.
## TECHNICAL METHODOLOGY
### Multi-Strategy Signal Generation Framework
The script operates on a shared execution framework where all six trading strategies share the same risk management system, but each strategy uses its own unique entry logic:
1. **EMA Crossover System**: Detects momentum shifts using configurable fast/slow EMA periods (Standard 9/21, Fast 7/17, Slow 13/26, or Custom)
2. **RSI Mean Reversion**: Identifies overbought/oversold conditions for counter-trend opportunities
3. **Breakout Detection**: Captures price breakouts from consolidation zones
4. **MACD Crossover**: Uses MACD line crossovers to confirm trend changes
5. **Bollinger Bands**: Trades bounces from band extremes and breakouts
6. **Volume Breakout**: Confirms moves with above-average volume
**Why This Integration Creates Unique Value:**
This is not a simple indicator mashup. The proprietary integration framework creates synergistic value through:
- **Shared Risk Management**: All strategies share ATR-based stop loss calculation and multiple take profit levels (TP1-TP6 with ratios 1:2, 1:4, 1:6, 1:8, 1:10, 1:12)
- **Adaptive Confidence Scoring**: The system evaluates market context from multiple perspectives simultaneously
- **Shared Filter System**: Optional filters (RSI extremes, ADX trend strength, Volume confirmation, POC proximity) apply uniformly across all strategies
## FLOW ANALYSIS INTEGRATION
### Fair Value Gap (FVG) Retracement Validation
The script implements proprietary FVG detection with retracement validation logic:
- **200-bar lookback** with **20% ATR tolerance** for gap identification
- **Retracement confirmation**: Signals can require price to retrace into a recent FVG before entry (optional filter)
- **Size filtering**: Only displays FVGs above minimum ATR threshold (configurable)
- **Visual tracking**: Shows last N FVGs with color-coded boxes (bullish green, bearish red)
**How FVG Integration Enhances Strategy Signals:**
When a strategy generates a signal, the FVG system validates whether price has recently retraced into an institutional order flow gap. This adds a layer of confirmation that the move is supported by institutional activity, not just retail momentum.
### Order Block Detection with Directional Alignment
- **Institutional accumulation/distribution zones**: Identifies the last bullish/bearish candle before a significant move
- **Directional filter**: Optional setting to only allow trades aligned with the most recent order block direction
- **ATR-based size filtering**: Filters out noise by requiring minimum order block size
- **Visual display**: Shows order blocks as colored boxes extending N bars forward
**Integration Logic:**
Order blocks represent areas where institutions accumulated or distributed positions. When a strategy signal occurs near an order block, it indicates higher probability that the move will continue in the block's direction.
### Multi-Timeframe POC (Point of Control) Analysis
The script calculates and displays POC levels from multiple timeframes:
- **Volume Profile POC**: Highest volume price over last N bars (configurable lookback)
- **Session POC**: Point of control for current trading session
- **Daily POC**: Daily volume-weighted average price
- **Weekly POC**: Weekly volume-weighted average price (optional)
**POC Proximity Filtering:**
Optional filters allow signals only when price is within X ATR of a POC level. This ensures entries occur at statistically significant price levels where liquidity is concentrated.
## FIBONACCI EXTENSION SYSTEM
### Dynamic Fibonacci Calculation
- **Swing-based detection**: Automatically identifies swing highs and lows using configurable lookback period
- **Extension levels**: Calculates Fibonacci extension levels (0.618, 0.786, 1.0, 1.272, 1.414, 1.618, 2.0, 2.618)
- **Retracement levels**: Shows standard retracement levels (0.236, 0.382, 0.5, 0.618, 0.786)
- **Negative levels**: Optional negative Fibonacci levels (-0.27, -0.618) for extended targets
**How Fibonacci Enhances Risk Management:**
Take profit levels are automatically calculated using Fibonacci extension mathematics. The system identifies the swing structure and projects potential reversal zones, allowing traders to set targets based on mathematical probability rather than arbitrary price levels.
## LIQUIDITY ZONE DETECTION
### Buy and Sell Side Liquidity
- **Swing-based liquidity zones**: Identifies recent swing highs (sell-side liquidity) and swing lows (buy-side liquidity)
- **Configurable lookback**: Adjustable period for liquidity zone detection
- **Visual display**: Horizontal lines extending N bars forward to show liquidity targets
- **Maximum zones**: Limits display to most recent N zones to avoid chart clutter
**Trading Application:**
Liquidity zones represent areas where stop losses are likely clustered. Price often moves to "sweep" these liquidity zones before reversing, creating high-probability entry opportunities.
## RISK MANAGEMENT SYSTEM
### ATR-Based Stop Loss Calculation
- **Dynamic stop placement**: Stop loss calculated using ATR (Average True Range) with configurable multiplier
- **Adaptive to volatility**: Stop loss automatically adjusts to current market volatility conditions
- **Configurable ATR period**: Default 14-period ATR, adjustable from 5-30 periods
- **SL multiplier**: Adjustable from 0.5x to 10x ATR for different risk profiles
### Multiple Take Profit Levels
The system supports up to 6 take profit levels with fixed risk-reward ratios:
- **TP1**: 1:2 risk-reward ratio
- **TP2**: 1:4 risk-reward ratio
- **TP3**: 1:6 risk-reward ratio
- **TP4**: 1:8 risk-reward ratio (optional)
- **TP5**: 1:10 risk-reward ratio (optional)
- **TP6**: 1:12 risk-reward ratio (optional)
**Why Multiple TP Levels:**
This allows partial profit-taking at key Fibonacci extension levels while letting winners run. The system tracks win rates for each TP level, helping traders optimize their exit strategy.
## SIGNAL FILTERS (OPTIONAL ENHANCEMENTS)
### RSI Extreme Filter
- **Avoid overbought/oversold extremes**: Prevents entries when RSI is in extreme zones (default: >70 overbought, <30 oversold)
- **Configurable thresholds**: Adjustable RSI levels and calculation period
- **Purpose**: Reduces false signals in exhausted moves
### ADX Trend Strength Filter
- **Avoid choppy markets**: Only allows trades when ADX indicates trending conditions (default: ADX > 20)
- **Configurable threshold**: Adjustable ADX minimum value (10-50)
- **Purpose**: Filters out low-probability trades in ranging markets
### Volume Confirmation
- **Volume multiplier**: Requires volume above X times average (default: 1.1x)
- **Purpose**: Ensures moves are supported by institutional participation
### POC Proximity Filters
- **Volume POC filter**: Only enter when price is near Volume Profile POC
- **Session POC filter**: Only enter when price is near Session POC
- **Daily POC filter**: Only enter when price is near Daily POC
- **Weekly POC filter**: Only enter when price is near Weekly POC
- **Proximity threshold**: Configurable ATR multiplier for "near" definition (default: 2.0x ATR)
---
## DIVERGENCE DETECTION
### MFI (Money Flow Index) Divergence
- **Bullish divergence**: Price makes lower low, MFI makes higher low (potential reversal up)
- **Bearish divergence**: Price makes higher high, MFI makes lower high (potential reversal down)
- **Configurable lookback**: Adjustable period for divergence detection (default: 100 bars)
- **Minimum bars between divergences**: Prevents duplicate signals (default: 10 bars)
- **Advanced thresholds**: Separate thresholds for RSI, price, and MFI divergence strength
**Note**: Divergence detection is visual-only and does not filter trades. It provides additional market context for discretionary traders.
## MARKET CONTEXT TOOLS
### Session High/Low Lines
- **Recent session extremes**: Displays horizontal lines for session high and low
- **Configurable lookback**: Adjustable period for session calculation (default: 10 bars)
- **Purpose**: Identifies key intraday support/resistance levels
### Swing Point Detection
- **Automatic swing identification**: Marks significant swing highs and lows
- **Visual reference**: Helps identify market structure and trend direction
### Signal Overview Table
Real-time technical analysis overview:
- **Current RSI**: Relative Strength Index value
- **ATR**: Current Average True Range
- **ADX**: Average Directional Index (trend strength)
- **EMA status**: Current fast/slow EMA relationship (Bullish/Bearish/Neutral)
- **POC levels**: Current price relative to POC levels
- **Confidence score**: Calculated confidence percentage based on confluence
- **Volume trend**: Current volume trend direction
## CHART DISPLAY OPTIONS
### Entry/SL/TP Lines
- **Visual trade management**: Displays entry price, stop loss, and all take profit levels as horizontal lines
- **Configurable length**: Lines extend N bars forward (default: 30 bars)
- **Color-coded**: Different colors for entry, stop loss, and each TP level
### Win/Loss Labels
- **Trade verification**: Displays up to 500 individual win/loss labels on chart
- **Visual feedback**: Green labels for wins, red labels for losses
- **Performance tracking**: Helps verify strategy performance visually
## USAGE INSTRUCTIONS
### Initial Setup
1. **Select Strategy Mode**: Choose your preferred trading strategy from the dropdown (EMA Crossover, RSI Mean Reversion, Breakout, MACD Crossover, Bollinger Bands, Volume Breakout, or Disabled)
2. **Configure Risk Management**:
- Set ATR Length for stop loss calculation (default: 14)
- Set SL ATR Multiplier (default: 1.0)
- Enable additional TP levels if desired (TP4-TP6 are optional)
3. **Adjust Strategy Parameters**: Each strategy has its own settings group. Configure EMA periods, RSI settings, MACD parameters, etc., based on your selected strategy.
### Recommended Settings by Market Type
**Forex/Crypto (High Volatility)**:
- EMA Mode: Fast (7/17) or Custom (3/21)
- SL ATR Multiplier: 1.5-2.0
- Enable FVG retracement filter
- Enable Order Block directional filter
**Stocks (Moderate Volatility)**:
- EMA Mode: Standard (9/21)
- SL ATR Multiplier: 1.0-1.5
- Enable ADX filter to avoid choppy markets
- Enable Volume confirmation
**Indices (Lower Volatility)**:
- EMA Mode: Slow (13/26)
- SL ATR Multiplier: 0.8-1.2
- Enable POC proximity filters
- Enable RSI extreme filter
### Advanced Configuration
1. **Enable Optional Filters**: Navigate to "Signal Filters" section and enable filters that match your trading style
2. **Configure Market Analysis Tools**: Adjust FVG, Order Block, Fibonacci, and POC settings in their respective sections
3. **Customize Display**: Toggle chart display options to show/hide various elements based on your preference
---
## WHY THIS INDICATOR COMBINATION CREATES UNIQUE VALUE
### Multi-Layered Confluence Analysis
This script is not a simple indicator mashup. It implements a proprietary integration framework that creates synergistic value through three layers of analysis:
**Layer 1: Fibonacci Mathematics**
- Golden Zone identification (61.8%-78.6% retracement zone) using three-point trend-based calculation
- Extension targets based on swing structure mathematics
- Statistically significant retracement areas where price is likely to reverse
**Layer 2: Institutional Flow Analysis**
- Fair Value Gaps (FVGs) identify order flow gaps where price must return
- Order Blocks mark institutional accumulation/distribution zones
- Multi-timeframe POC analysis shows where liquidity is concentrated
- Liquidity zones identify where stop losses cluster
**Layer 3: Multi-Strategy Signal Generation**
- Six different entry methodologies provide multiple perspectives
- Shared risk management ensures consistent position sizing
- Adaptive confidence scoring evaluates confluence from all three layers
- Optional filters allow customization for different market conditions
### Proprietary Integration Framework
The unique value comes from how these components work together:
1. **Strategy generates signal** → 2. **FVG/Order Block validates institutional support** → 3. **POC confirms liquidity level** → 4. **Fibonacci provides target zones** → 5. **Risk management calculates optimal SL/TP placement**
This creates a complete trading system, not just a collection of indicators.
---
## TECHNICAL SPECIFICATIONS
- **Pine Script Version**: v6
- **Chart Type**: Overlay (displays on price chart)
- **Max Bars Back**: 5000 (for historical analysis)
- **Max Labels**: 500 (for win/loss tracking)
- **Compatibility**: Works on all timeframes and instruments
- **Performance**: Optimized for real-time execution
---
## DISCLAIMER
This script is a technical analysis tool and does not constitute financial, investment, trading, or other types of advice. Past performance does not guarantee future results. Always use proper risk management and never risk more than you can afford to lose. The script's signals are based on mathematical calculations and should be used in conjunction with your own analysis and risk management practices.
---
## SUPPORT AND ACCESS
This is an invite-only script. To request access:
1. Visit: www.pinescriptedge.com
2. Include your TradingView username and brief trading experience
3. Access will be reviewed and granted within 24 hours
**Note**: TradingView does NOT recommend paying for or using a script unless you fully trust its author and understand how it works. You may also find free, open-source alternatives in our community scripts.
---
## VERSION INFORMATION
**Momentum Master v1** - Initial release with multi-strategy framework and institutional flow analysis integration.
For updates and new features, follow the script or check the author's profile for version announcements.

كلاستر
Detailed Description – Fibonacci Cluster Zones + OB + FVG (AR34)
This script is an advanced multi-layer confluence system developed under the AR34 Trading Framework, designed to identify high-accuracy reversal zones, liquidity imbalances, institutional footprints, and trend direction using a unified analytic engine.
It combines Fibonacci mathematics, Smart Money Concepts, market structure, and smart trend signals to produce precise, reliable trading zones.
⸻
🔶 1 — Fibonacci Retracement Zones + Custom Smart Levels
The script calculates the highest and lowest prices over a selected lookback period to generate key Fibonacci retracement levels:
• 0.236
• 0.382
• 0.500
• 0.618
• 0.786
• 1.000
You can also add up to three custom Fibonacci levels (0.66, 0.707, 0.88 or any value you want).
✔ Each level is drawn as a horizontal line
✔ Optional label display for every level
✔ Color and activation fully customizable
These levels help identify pullback zones and potential turning points.
⸻
🔶 2 — True Fibonacci Cluster Detection
The script automatically identifies Cluster Zones, which occur when:
1. A Fibonacci level
2. An Order Block
3. A Fair Value Gap
all overlap in the same price range.
When all three conditions align, the script prints a CLUSTER marker in yellow.
These zones represent:
• High-probability reversal areas
• Strong institutional footprints
• Highly reactive price levels
⸻
🔶 3 — Automatic Order Block (OB) Detection
The indicator detects Order Blocks based on structural candle behavior:
• Bearish candle → followed by bullish
• Price interacts with a Fibonacci level
• Area aligns with institutional order flow
When detected, the OB is marked for easy visualization.
⸻
🔶 4 — Fair Value Gap (FVG) Mapping
The script scans for liquidity imbalances using the classic FVG logic:
• low > high
When an FVG exists, it draws a green liquidity box.
This highlights:
• Gaps left by institutional moves
• High-value return zones
• Efficient price retracement levels
⸻
🔶 5 — Fibonacci Extension Projections
The script calculates extension targets using:
• 1.272
• 1.618
• 2.000
These are drawn as dashed teal lines and help forecast:
• Breakout continuation targets
• Wave extension objectives
• Take-profit areas
⸻
🔶 6 — Smart Trend Signal (EMA-200 Engine)
Trend direction is determined using the EMA 200:
• Price above EMA → uptrend
• Price below EMA → downtrend
A green or red signal icon appears only when the trend flips, reducing noise and improving clarity.
This helps detect:
• Trend shifts early
• Cleaner entries and exits
• Trend-based filtering
⸻
🔶 7 — Four-EMA Multi-Trend System
The indicator includes optional visualization of four moving averages:
• EMA 20 → Short-term
• EMA 50 → Medium-term
• EMA 100 → Long-term
• EMA 200 → Major trend
All are fully customizable (length + color + visibility).
⸻
🔶 8 — Dynamic Negative Fibonacci Levels (Green Only)
When enabled, the script calculates deep retracement zones using:
• –0.23
• –0.75
• –1.20
These negative Fibonacci levels are drawn in green and help identify:
• Deep liquidity capture points
• Hidden structural supports
• Potential reversal bottoms
⸻
🔶 9 — Complete User Control
Users maintain full control over:
✔ Enabling/disabling OB detection
✔ Enabling/disabling FVG detection
✔ Activating custom Fibonacci levels
✔ Showing or hiding labels
✔ Selecting timeframe for Fib calculations
✔ Adjusting moving average parameters
✔ Activating dynamic Fibonacci
The script is designed to be flexible, scalable, and suitable for any trading style.
⸻
🎯 Summary
This indicator is a powerful all-in-one analytical system that merges:
✔ Fibonacci Mathematics
✔ Smart Money Concepts (OB + FVG)
✔ Trend-based filtering
✔ Institutional cluster detection
✔ Dynamic extensions + retracements
✔ Multi-EMA trend mapping
شرح السكربت بالتفصيل – Fibonacci Cluster Zones + OB + FVG (AR34)
هذا السكربت هو نظام تحليل احترافي متكامل من تطوير AR34 Framework يجمع بين أقوى أدوات التداول الحديثة في مؤشر واحد، ويهدف إلى كشف مناطق الانعكاس القوية، والتجميع الذكي، والاتجاه العام، باستخدام مزيج علمي من فيبوناتشي + السيولة + الاتجاه.
يعمل هذا المؤشر بأسلوب Confluence Trading بحيث يدمج عدة مدارس مختلفة في طبقة واحدة لتحديد مناطق الانعكاس والارتداد والاختراق بدقة عالية.
⸻
🔶 1 — مناطق فيبوناتشي (Retracement) + الكلاستر الذكي
يقوم المؤشر بحساب أعلى وأدنى سعر خلال عدد محدد من الشموع (Retracement Length) ثم يرسم مستويات فيبوناتشي الكلاسيكية:
• 0.236
• 0.382
• 0.500
• 0.618
• 0.786
• 1.000
مع إمكانية إضافة 3 مستويات خاصة من اختيارك (0.66 – 0.707 – 0.88 وغيرها).
✔️ كل مستوى يتم رسمه بخط مستقل
✔️ يظهر بجانبه رقم المستوى إذا تم تفعيل خيار Show Fib Labels
✔️ يمكن تغيير لونه، قيمته، وتفعيله حسب رغبتك
⸻
🔶 2 — كاشف الكلاستر الحقيقي (Cluster Detection)
الكلاستر يُعتبر أقوى مناطق الارتداد في التحليل الفني.
السكربت يحدد الكلاستر عندما تتداخل 3 عناصر مع مستوى فيبوناتشي:
1. مستوى فيبوناتشي مهم
2. Order Block
3. Fair Value Gap
إذا اجتمعت الثلاثة في نفس المنطقة، يتم رسمها باللون الأصفر وتظهر كلمة CLUSTER.
هذا يعطيك:
• أقوى منطقة انعكاس
• أعلى دقة في تحديد نقاط الدخول
• مناطق ذات سيولة مرتفعة
⸻
🔶 3 — دمج Order Blocks تلقائياً
يكتشف المؤشر الـ OB الحقيقي باستخدام شروط حركة الشموع:
• bearish candle → bullish candle
• السعر لمس مستوى فيبوناتشي
• منطقة محتملة لتجميع المؤسسات
إذا تحققت الشروط يظهر OB باللون الأحمر.
⸻
🔶 4 — دمج Fair Value Gaps (FVG)
يكتشف الفجوات السعرية بين الشمعتين الأولى والثالثة:
• low > high
ويقوم برسم بوكس أخضر حول الفجوة (FVG Zone).
يساعدك على معرفة:
• مناطق اختلال السيولة
• أهداف السعر القادمة
• مناطق “العودة” المحتملة
⸻
🔶 5 — امتدادات فيبوناتشي (Fibonacci Extensions)
يقوم بحساب الامتدادات من مستويات:
• 1.272
• 1.618
• 2.0
ويظهرها بخطوط متقطعة (Teal Color).
هذه المستويات مهمة لتوقع:
• أهداف اختراق
• مناطق TP
• امتداد موجات السعر
⸻
🔶 6 — إشارة الاتجاه الذكية (Smart Trend Engine – EMA200)
يعتمد على EMA 200 لتحديد الاتجاه العام:
• إذا السعر فوق EMA200 → اتجاه صاعد
• إذا السعر تحت EMA200 → اتجاه هابط
ويظهر المؤشر:
🟢 سهم أخضر عند تحول الاتجاه لصعود
🔴 سهم أحمر عند تحول الاتجاه لهبوط
ميزة التحول فقط عند تغيير الاتجاه (No Noise).
⸻
🔶 7 — أربع موفنقات احترافية (EMA 20 – 50 – 100 – 200)
المؤشر يعرض الموفنقات الأربعة الأساسية:
• EMA 20 → اتجاه قصير
• EMA 50 → متوسط
• EMA 100 → طويل
• EMA 200 → الاتجاه الرئيسي
مع إمكانية:
• تغيير اللون
• تغيير الطول
• إخفائها وإظهارها
⸻
🔶 8 — فيبوناتشي الديناميكي (Dynamic Green Fib)
ميزة قوية جداً تظهر فقط عند تفعيلها.
تحسب أعلى وأدنى سعر في Lookback Period ثم ترسم مستويات سلبية:
• –0.23
• –0.75
• –1.20
هذه المستويات تظهر كخطوط خضراء تحت السعر وتستخدم لـ:
• تحديد مناطق الانعكاس المخفية
• رصد الدعم الديناميكي
• اكتشاف القيعان المحتملة
⸻
🔶 9 — المرونة الكاملة للمستخدم
المؤشر يسمح لك التحكم بكل شيء:
✔️ تفعيل/إلغاء الـ OB
✔️ تفعيل/إلغاء الـ FVG
✔️ تفعيل/إلغاء مستويات فيبوناتشي
✔️ إضافة مستويات مخصصة
✔️ اختيار الفريم المستخدم
✔️ تغيير الألوان
✔️ التحكم في الاتجاه والموفنقات
⸻
🎯 الخلاصة
هذا السكربت يعمل كنظام تحليلي متكامل يجمع:
✔️ فيبوناتشي
✔️ السيولة المؤسسية (OB + FVG)
✔️ الاتجاه الذكي
✔️ الكلاستر الاحترافي
✔️ الموفنقات
✔️ فيبوناتشي الديناميكي

Fair Value Gaps - Cucaracha📘 Fair Value Gaps (FVG) – Clean, Automatic Detection & Real-Time Tracking
The Fair Value Gaps (FVG) indicator automatically detects and visualizes Bullish and Bearish Fair Value Gaps directly on your chart. Built with precision, it highlights imbalance zones, continuously extends them in real time, and removes them the moment they’re mitigated — giving you a clean and accurate market structure view.
✅ Key Features
Automatic FVG Detection
Identifies bullish and bearish FVGs using a strict 3-candle imbalance model.
Dynamic Boxes
Each detected FVG is drawn as a shaded box and extends forward until price fills or mitigates the zone.
Auto-Cleanup (Mitigation Logic)
When price returns to the gap and fills it, the zone is instantly removed, keeping your chart clean and focused.
Custom Colors
Choose your own colors for bullish and bearish FVG boxes.
🎯 Why Traders Use This
Fair Value Gaps are widely used in:
Smart Money Concepts (SMC)
ICT-style trading
Market imbalance analysis
They highlight areas where price moved aggressively and may later return to rebalance.
This indicator helps you:
Spot institutional imbalances instantly
Track unmitigated FVGs without manually drawing boxes
Stay focused on key reaction zones
Improve entries based on premium/discount and liquidity concepts
🧠 How It Works
Bullish FVG:
Occurs when price leaves a gap where low > high , creating an upward imbalance zone.
Bearish FVG:
Occurs when high < low , indicating a downward imbalance zone.
Detected gaps are plotted as forward-extending boxes until price mitigates them.
Once mitigated (price fills the gap), the zone is automatically removed.
🟦🟥 Visuals
Blue (or your chosen color): Bullish FVG
Red (or your chosen color): Bearish FVG

CyberTradingV1.4 TRexCyberTradingV1.3 — Multi-TF Volatility/Structure + FVG Suite (by College Pips)
TL;DR
One utility to read volatility regime (ATR vs TH), map market structure & swings, and track FVG/CE imbalances—so you can gauge range, context and entries in one place. No signals or promises; it’s a contextual toolkit.
What it does
Volatility table (multi-TF): Shows ATR-style and TH proxies across 1m → Monthly, so you can compare current TF vs higher TFs.
Composite levels: LQC / GAM / Trigger / TRex quantify “how much is enough” for legs/impulses relative to the active TF.
Structure & swings: Validated swing highs/lows with optional time-anchored rectangles (height sized by LQC) and auto structure/diagonal lines.
Imbalances (FVG): Auto-detect UP/DOWN FVGs, extend forward, optional CE line; alerts fire on touches/entries/fills.
Candle sizing: Directional color map by fixed ATR-ratio buckets; Inside Bars are force-colored for clarity.
How components work together (mashup rationale)
Read regime with the table (ATR vs TH per TF).
Map structure with swings/lines to see HH/HL/LH/LL context.
Focus imbalances with FVG + optional CE; monitor with alerts.
Act with thresholds using LQC/GAM/Trigger/TRex to standardize expectations across symbols/TFs.
Method transparency
ATR/TH math: ATR is a smoothed multi-window blend; TH scales the daily range to TF via √time.
Composites: LQC ≈ √(ATR×TH) × C(TF); GAM2/3/4 and Trigger/TRex apply TF-specific scalars to min/max aggregates (see source for exact coefficients).
Multi-TF: Values come from request.security and finalize on higher-TF bar close (no look-ahead).
Swings: Confirmed using left/right strengths; labels are offset back to the pivot bar.
FVG/CE: Classic 3-bar definition; CE is the midpoint line. Boxes extend until touched/filled; optional auto-delete on fill.
Usage
Enable the table to gauge expansion/contraction.
Turn on swing rectangles for LQC-sized reaction zones.
Toggle FVG + CE on your execution TF; use alerts to catch re-entries/resolutions.
Combine with price action and your own trade plan.
Limitations & fair warnings (be honest)
Offsets/past plotting: Swing labels and rectangles are anchored to past bars (offset = -right_strength). They do not predict future bars.
Repainting notes: Swings confirm after right_strength bars; higher-TF values finalize on their close. Past markings can update as confirmations occur.
Tick handling: Uses syminfo.mintick (special cases for JPY/XAU/XAG). Validate on exotic symbols.
No promises: This is a context tool, not a buy/sell signal generator.
Alerts included
ABOVE/BELOW threshold: Price crossing CE or FVG bounds.
IOFED up/down: Price entering an FVG from above/below.
Inputs (high-level)
Layout/positioning, color palettes, swing rectangle styling (width/fill/border), detection strengths, label/line widths, FVG lookback, CE on/off & style, auto-delete filled boxes.
Credits & reuse
Concepts like FVG/CE are widely known in market-microstructure education.
This implementation—table architecture, LQC/GAM/Trigger framework, swing rectangles, candle bucketing, and alert logic—is original to College Pips / CyberTradingV1.4

PRIMO+ (dc_77)PRIMO+ (dc_77) - Advanced Multi-Session Trading System
Overview
This comprehensive trading indicator combines market structure analysis, Fair Value Gap (FVG) detection, and multi-timeframe bias assessment to identify high-probability trading opportunities during key market sessions. The system operates on a sophisticated framework that evaluates market sentiment across multiple reference points and provides complete trade management projections.
Core Features
Multi-Timeframe Bias System
The indicator establishes directional bias by analyzing price action relative to four critical reference points:
- 18:00 NY Open: Previous day's market opening level
- 00:00 Midnight: Daily reset reference price
- 09:30 NY Open: Current session market opening
- 09:45 NY Open: Key institutional entry timeframe
Bias Logic:
- LONGS Bias: Price trading below ALL reference levels (institutional accumulation zone)
- SHORTS Bias: Price trading above ALL reference levels (institutional distribution zone)
- BEWARE: Mixed signals across reference points (avoid trading)
Four-Session Architecture
The system monitors four distinct trading sessions, each representing different market participant activities:
1. Session 1 (09:45-10:20): London/NY overlap - high liquidity period
2. Session 2 (10:45-11:30): NY continuation - institutional positioning
3. Session 3 (13:50-14:10): Pre-close positioning - smart money moves
4. Session 4 (15:50-16:05): Market close - final institutional plays
Each session can be individually enabled/disabled with custom time ranges.
Advanced Fair Value Gap Detection
The indicator identifies three-candle imbalances using sophisticated filtering:
FVG Classification:
- Bullish FVGs: Gaps between candle 3 high and candle 1 low (upward imbalance)
- Bearish FVGs: Gaps between candle 1 high and candle 3 low (downward imbalance)
Dynamic Filtering System:
- Bias alignment filtering (only shows FVGs aligned with overall market bias)
- Trend direction filtering (FVGs must align with market structure)
- Session-based activation/deactivation
- Real-time gap validation and invalidation
Market Structure Shift (MSS) Detection
Proprietary swing-based algorithm identifies significant market structure changes:
- Bullish MSS: Price breaks above previous significant high with trend confirmation
- Bearish MSS: Price breaks below previous significant low with trend confirmation
- Dynamic Lookback: Configurable swing detection sensitivity (4-5 bar pivots)
Comprehensive Risk Management System
When conditions align, the indicator projects complete trade setups:
Entry Methodology:
- FVG center point calculated using mathematical precision
- Entry triggered only when MSS occurs with aligned bias
- Confirmation timer prevents false signals (22-second default validation)
Stop Loss Calculation:
- Dynamic SL placement based on FVG displacement
- 1.15x multiplier applied to gap distance for optimal risk positioning
- Adaptive to market volatility and gap size
Take Profit Projections:
- Five sequential TP levels (1:1 through 1:5 risk-reward ratios)
- Mathematical progression based on initial risk calculation
- Visual projection lines extend into future bars
Visual Signal System
Trade Signals:
- Green up arrows for bullish setups (positioned below stop loss level)
- Red down arrows for bearish setups (positioned above stop loss level)
- Optional date stamps showing signal generation time
Projection Lines:
- Entry level (gray dotted line)
- Stop loss level (red line)
- Multiple take profit levels (green lines with ratio labels)
- Customizable line styles and widths
Alert Integration
Real-time notifications when complete setups form:
- Bar-close confirmation prevents false alerts
- Separate bull/bear alert messages
- Integration with TradingView's alert system
- Optional sound notifications
Configuration Options
Display Settings
- Session Anchor Lines: Visual markers for session starts
- MSS Lines: Market structure shift visualization
- Trend Lines: ZigZag pattern display
- Signal Arrows: Entry point indicators
- Date Labels: Timestamp display for signals
Color Customization
- Bullish FVG color and transparency
- Bearish FVG color and transparency
- MSS line colors (separate bull/bear)
- Projection line colors
- Stop loss and take profit colors
Risk Parameters
- Confirmation time adjustment (prevents false signals)
- Risk-reward multiplier customization
- Projection line extension length
- Label and arrow size options
Usage Guidelines
Trading Sessions
Best performance during specified session times when institutional activity is highest. The system automatically adjusts for New York timezone.
Entry Criteria
All conditions must align for signal generation:
1. Appropriate market bias established
2. FVG present and validated within session
3. Market structure shift in aligned direction
4. Confirmation timer validation passed
Risk Management
- Always respect projected stop loss levels
- Consider partial profit-taking at projected TP levels
Important Disclaimers
This indicator is for educational and analytical purposes. All trading involves risk, and past performance does not guarantee future results. Users should:
- Practice proper risk management
- Backtest thoroughly before live trading
- Understand all system components before use
- Never risk more than affordable loss amounts
The system provides analysis tools and projections but does not guarantee profitable trades. Market conditions change rapidly, and no indicator can predict future price movements with certainty.
Additional Risk Warnings and Disclaimers
Trading Addiction and Mental Health: Trading can become psychologically addictive and may lead to compulsive behavior, financial ruin, and severe emotional distress. If you find yourself unable to stop trading, risking money you cannot afford to lose, neglecting personal relationships or responsibilities, or experiencing extreme emotional swings based on trading outcomes, please seek help from a qualified mental health professional. The excitement of potential profits can mask serious underlying issues with impulse control and risk-taking behavior.
No Guarantee of Performance: This indicator has not been independently verified or audited. Backtesting results may not reflect actual trading conditions due to market slippage, execution delays, spread variations, and changing market dynamics. Historical performance is not indicative of future results, and all trading strategies can and do lose money.
Market Risk Acknowledgment: Financial markets can experience extreme volatility, flash crashes, liquidity crises, and unprecedented events that render technical analysis ineffective. Economic announcements, geopolitical events, and central bank policies can cause rapid price movements that invalidate technical setups instantly.
Position Sizing and Capital Preservation: Never risk more than 1-2% of your total account on any single trade. Proper position sizing is more important than any trading signal. Multiple consecutive losses are normal and expected - ensure your account can withstand extended drawdown periods without impairing your ability to continue trading or meet personal financial obligations.
Educational Purpose Only: This tool is designed for educational analysis and should not be construed as personalized financial advice. Consult with qualified financial advisors before making investment decisions. The creators assume no responsibility for any financial losses incurred through use of this indicator.

HTF POI [TakingProphets]HTF POI – Higher Timeframe Points of Interest Detection
The HTF POI Indicator by Taking Prophets is designed for traders following ICT (Inner Circle Trader) concepts and smart money principles. This tool automatically detects higher timeframe (HTF) points of interest (POIs) such as Fair Value Gaps (FVGs), Inverse Fair Value Gaps (IFVGs), and Consequent Encroachment (CE) levels, helping traders spot high-probability trading zones used by institutions.
🔹 Key Features:
✅ Automatic Detection of FVGs & IFVGs – Identifies key price inefficiencies across multiple timeframes.
✅ Multi-Timeframe Analysis – Detect POIs on the current timeframe and up to five higher timeframes (HTF1 to HTF5).
✅ Customizable Sensitivity – Adjust detection settings to High, Medium, or Low based on price gap size.
✅ Fair Value Gap (FVG) Encroachment Lines – Optional midpoint levels to track potential price rebalancing.
✅ Volume Display Option – View volume within detected FVGs for additional confluence.
✅ Inverse Fair Value Gaps (IFVGs) – Tracks invalidated gaps that turn into new liquidity pools.
✅ Works Across All Markets – Ideal for Forex, Futures, Stocks, and Crypto.
🔹 How It Works:
📌 Fair Value Gaps (FVGs) – Price inefficiencies caused by fast institutional moves that often get revisited.
📌 Bullish FVGs (BISI) – Formed when price gaps up, creating a demand zone where price may return.
📌 Bearish FVGs (SIBI) – Formed when price gaps down, acting as a supply zone for potential reversals.
📌 Inverse Fair Value Gaps (IFVGs) – Previously unfilled FVGs that get mitigated and act as liquidity pools.
📌 Consequent Encroachment (CE) – The 50% midpoint of an FVG, where price often reacts.
📌 Multi-Timeframe Integration – Tracks higher timeframe gaps for confluence with lower timeframe setups.
🔹 How to Use:
Identify FVG zones for potential entries or exits in alignment with smart money concepts.
Use Consequent Encroachment (CE) levels to confirm reactions at the 50% level of an FVG.
Watch for IFVGs as they provide new liquidity pools after FVGs are invalidated.
Combine with CHoCH/BOS market structure shifts and Order Blocks for higher-probability trades.
🚀 Refine your trade entries with precision using the HTF POI Indicator by Taking Prophets!

Fair Value Gap DetectorHow this indicator works:
It detects two types of FVGs:
Bullish FVG: Occurs when the low of the current candle is higher than the high of the candle from 2 bars ago (creates an upward gap)
Bearish FVG: Occurs when the high of the current candle is lower than the low of the candle from 2 bars ago (creates a downward gap)
Features:
Allows users to toggle both bullish and bearish FVG detection independently
Customizable colors for both bullish (default green) and bearish (default red) FVGs
Visualizes FVGs using:
Boxes that highlight the gap area (with 80% transparency)
Labels that mark each FVG ("Bull FVG" or "Bear FVG")
Visual representation:
Bullish FVGs are marked with green boxes and downward-pointing labels
Bearish FVGs are marked with red boxes and upward-pointing labels
This indicator can be useful for :
Identifying potential areas where price might return to
Finding potential support and resistance zones
Understanding market structure and momentum shifts

Inversion Fair Value Gap Screener | Flux Charts💎 GENERAL OVERVIEW
Introducing our new Inverse Fair Value Gap Screener! This screener can provide information about the latest Inverse Fair Value Gaps in up to 5 tickers. You can also customize the algorithm that finds the Inverse Fair Value Gaps and the styling of the screener.
Features of the new Inverse Fair Value Gap (IFVG) Screener :
Find Latest Inverse Fair Value Gaps Across 5 Tickers
Shows Their Information Of :
Latest Status
Number Of Retests
Consumption Percent
Volume
Customizable Algorithm / Styling
📌 HOW DOES IT WORK ?
A Fair Value Gap generally occur when there is an imbalance in the market. They can be detected by specific formations within the chart. An Inverse Fair Value Gap is when a FVG becomes invalidated, thus reversing the direction of the FVG.
IFVGs get consumed when a Close / Wick enters the IFVG zone. Check this example:
This screener then finds Fair Value Gaps across 5 different tickers, and shows the latest information about them.
Status ->
Far -> The current price is far away from the IFVG.
Approaching ⬆️/⬇️ -> The current price is approaching the IFVG, and the direction it's approaching from.
Inside -> The price is currently inside the IFVG.
Retests -> Retest means the price tried to invalidate the IFVG, but failed to do so. Here you can see how many times the price retested the IFVG.
Consumed -> IFVGs get consumed when a Close / Wick enters the IFVG zone. For example, if the price hits the middle of the IFVG zone, the zone is considered 50% consumed.
Volume -> Volume of a IFVG is essentially the volume of the bar that broke the original FVG that formed it.
🚩UNIQUENESS
This screener can detect latest Inverse Fair Value Gaps and give information about them for up to 5 tickers. This saves the user time by showing them all in a dashboard at the same time. The screener also uniquely shows information about the number of retests and the consumed percent of the IFVG, as well as it's volume. We believe that this extra information will help you spot reliable IFVGs easier.
⚙️SETTINGS
1. Tickers
You can set up to 5 tickers for the screener to scan Fair Value Gaps here. You can also enable / disable them and set their individual timeframes.
2. General Configuration
FVG Zone Invalidation -> Select between Wick & Close price for FVG Zone Invalidation.
IFVG Zone Invalidation -> Select between Wick & Close price for IFVG Zone Invalidation. This setting also switches the type for IFVG consumption.
Zone Filtering -> With "Average Range" selected, algorithm will find FVG zones in comparison with average range of last bars in the chart. With the "Volume Threshold" option, you may select a Volume Threshold % to spot FVGs with a larger total volume than average.
FVG Detection -> With the "Same Type" option, all 3 bars that formed the FVG should be the same type. (Bullish / Bearish). If the "All" option is selected, bar types may vary between Bullish / Bearish.
Detection Sensitivity -> You may select between Low, Normal or High FVG detection sensitivity. This will essentially determine the size of the spotted FVGs, with lower sensitivities resulting in spotting bigger FVGs, and higher sensitivities resulting in spotting all sizes of FVGs.

IFVGs [NINE]Overview
The IFVG Indicator is a precision-engineered tool designed to identify and display Inversion Fair Value Gaps (IFVGs), a powerful price action concept rooted in ICT (Inner Circle Trader) methodology. This indicator automatically detects when price closes through an existing Fair Value Gap, causing the zone to "invert" and flip its directional bias, signaling potential areas of institutional interest for future price reactions.
What is an Inversion Fair Value Gap?
A Fair Value Gap (FVG) is a three-candle pattern where a gap exists between the wicks of the first and third candles, representing an imbalance in price delivery. These zones often act as magnets for price to return and "fill" the inefficiency.
An Inversion Fair Value Gap (IFVG) occurs when price doesn't just tap into an FVG, it closes through it with a candle body. This "inversion" transforms the zone:
A Bullish FVG that gets closed through becomes a Bearish IFVG (potential resistance/supply zone)
A Bearish FVG that gets closed through becomes a Bullish IFVG (potential support/demand zone)
IFVGs represent areas where the market has shown its hand — institutional order flow has aggressively moved through a prior inefficiency, and the inverted zone now becomes a point of interest for potential reversals or continuations.
Key Features
Automatic IFVG Detection
The indicator continuously monitors for Fair Value Gaps and automatically converts them to IFVGs when price body closes through the zone. No manual identification required.
Multiple Display Styles
Choose from four distinct visualization modes to match your chart aesthetic:
Level — Clean, minimal single line at the IFVG extreme (top for bullish, bottom for bearish)
Normal — Filled zone with dashed borders and dot label
Minimalist — High/low boundary lines with connecting link
Classic — Filled box with 50% midline only
Full Customization
Independent colors for bullish and bearish IFVGs
Adjustable transparency for zone fills
Optional 50% midline (Consequent Encroachment level)
Flexible label styles: "IFVG" or "+/−" notation
Multiple label sizes: Tiny, Small, Normal, Large
Smart Extension Options
Extend to Current Bar — Zones dynamically extend as price progresses
Extend to Confirmation — Zones end at the bar where inversion occurred
Manual Offset — Fine-tune extension length in bars
Clustered IFVG Filter
Prevents chart clutter by ensuring only one IFVG per direction forms within a 5-bar cooldown period. When a single candle closes through multiple FVGs, only the first IFVG of that directional series is displayed — eliminating redundant signals and keeping your chart clean.
FVG Lookback Control
Limit which FVGs can become IFVGs based on their age. Options include 10, 50, 100, 200, or 300 bars. This filters out old, stale FVGs that may create less relevant inversions.
Session Time Filters
Optional time-based filtering allows you to focus on specific trading sessions:
Configurable session windows (e.g., 9:30 AM - 12:00 PM)
Support for two independent session filters
Multiple timezone options including New York, London, Tokyo, and more
Volume Imbalance Detection
Optionally include Volume Imbalances (VIs) — gaps between candle bodies rather than wicks — expanding the scope of detectable inefficiencies.
Invalidation Tracking
IFVGs are automatically invalidated when price closes back through the zone in the opposite direction, with optional display of invalidated zones.
How to Use
Entry Confirmation
IFVGs serve as areas for trade entries. When price returns to a confirmed IFVG:
Bullish IFVG — Look for long entries as price taps the zone from above
Bearish IFVG — Look for short entries as price taps the zone from below
Settings Reference
Inversion Fair Value Gaps
Show IFVGs? — Master toggle for IFVG display
Style — Level, Normal, Minimalist, or Classic
Transparency % — Zone fill opacity (0-100)
Historical Display — Maximum IFVGs to show per direction
Bullish/Bearish Colors — Independent color selection
Show Invalidated? — Display IFVGs that have been invalidated
Extend IFVGs? — Enable dynamic zone extension
Extension Mode — Current Bar or Confirmation
Manual Offset — Additional bars to extend
High/Low Lines — Show boundary lines (Minimalist style)
50% Midline — Show Consequent Encroachment level
Show Labels? — Display zone labels
Label Style — IFVG or +/− notation
FVG Lookback — Maximum age of FVGs that can invert
Clustered Filter — Prevent multiple same-direction IFVGs in quick succession
Volume Imbalances — Include body gaps in detection
Session Filters
Enable 1st/2nd Time Filter — Activate session filtering
Session Times — Define active trading windows
Timezone — Reference timezone for session calculations
Disclaimer
This indicator is provided for educational and informational purposes only. It is not financial advice, and nothing contained herein constitutes a recommendation, solicitation, or offer to buy or sell any securities, options, or other financial instruments.
Trading involves substantial risk of loss and is not suitable for all investors. Past performance is not indicative of future results. You should carefully consider your investment objectives, level of experience, and risk appetite before making any trading decisions.
The developer of this indicator makes no representations or warranties regarding the accuracy, completeness, or reliability of the information provided. You are solely responsible for your own trading decisions and any profits or losses that may result.
Always conduct your own research and consider seeking advice from a licensed financial professional before trading.

BORSA 321 - Care PackageOverview
Care Package is a complete higher-timeframe and intraday context tool designed to map out every important environmental factor on your chart: sessions, opening levels, gaps, market structure, order blocks, fair value gaps, volume imbalance and more.
It automatically plots:
Sessions / killzones (Asia, London, New York AM/Lunch/PM)
Key opening levels (00:00, 08:30, 09:30, 13:30)
Previous day AM/PM high–low ranges
New Day and New Week Opening Gaps (NDOG / NWOG)
RTH gap and RTH zone levels
Multi-timeframe Fair Value Gaps (up to 4)
Fractals and Order Blocks (with optional FVG confirmation)
Market structure (HH/HL/LL/LH, CHoCH, BOS)
Volume Imbalance zones with mitigation logic
All session logic runs on IANA time zones (like America/New_York), giving accurate sessions and market opens regardless of DST or broker feed.
Care Package serves as the full “context layer” for intraday execution charts.
What It Shows
1. Sessions / Killzones
The indicator automatically highlights:
Asia Session
London Session
New York AM
New York Lunch
New York PM
Each session displays:
A high–low range box
Labels for session high and session low
A midline showing the mean price
Optional forward extensions of session levels to the current bar
This cleanly outlines intraday phases for ICT/SMC execution.
2. Opening Price Levels
Key market open levels tracked:
00:00
08:30
09:30
13:30
For each open, the script draws:
A horizontal line at the opening price
A label showing time and price
An optional vertical line marking the opening bar
These opens often act as liquidity or reversal areas.
3. Previous Day AM/PM Levels
The script splits the prior day into:
Previous Day AM (first half)
Previous Day PM (second half)
Both provide:
PD AM High, PD AM Low
PD PM High, PD PM Low
Forward-projected levels
Labels for easy identification
Useful for navigating intraday targets and reaction zones.
4. Last N Days High/Low
Tracks a rolling daily range:
Each day’s High and Low
Labels containing the date
Forward extension into today’s price action
This shows where price sits relative to recent daily extremes.
5. New Day & New Week Opening Gaps (NDOG / NWOG)
The script automatically identifies:
NDOG (New Day Open Gap)
NWOG (New Week Open Gap)
Each gap includes:
A shaded zone between the two opens
Labels showing the gap type and date/week
Forward extension (optional)
Limiting the number of historical gaps (optional)
Critical for identifying unfilled imbalance zones across sessions and weeks.
6. RTH Gap & RTH Zone
You define RTH open/close times, and the indicator:
Detects RTH gaps
Draws a full zone based on direction
Plots subdivision lines (top, 75%, mid, 25%, bottom)
Extends the RTH Close reference line forward
Can extend old RTH zones automatically
Ideal for futures traders and equities.
7. Higher-Timeframe Fair Value Gaps (up to 4 TFs)
Supports up to four selectable FVG timeframes such as:
Chart timeframe
5m, 15m, 1H, 4H, 1D, 1W, 1M
Each FVG includes:
Top and bottom boundary
A midline (mean threshold)
Colored bullish or bearish fill
A label showing FVG + timeframe
Automatic cleanup when mitigated (close/wick based)
You get a clean and accurate HTF FVG map without clutter.
8. Fractals & Order Blocks
Fractals:
Standard or 5-bar fractals
Plotted as swing highs and lows
Order Blocks:
Bullish OB → down candle before up displacement
Bearish OB → up candle before down displacement
Optionally require OB to be near an FVG
Wick-based or body-based OB size
Forward-projected OB boxes
Auto-delete after mitigation
This keeps your OBs clean and execution-focused.
9. Market Structure (HH/HL/LL/LH, CHoCH, BOS)
The indicator automatically detects:
HH (Higher High)
HL (Higher Low)
LH (Lower High)
LL (Lower Low)
And also identifies:
CHoCH (Change of Character)
BOS (Break of Structure)
Each break includes:
A horizontal level at the break point
A color-coded label
Bullish (green) or bearish (red) styling
A complete market structure map is built automatically.
10. Volume Imbalances (VI)
Detects and displays:
Bullish VI (VI+)
Bearish VI (VI-)
Features:
Configurable colors
Custom label size
Max visible boxes
Extension until mitigation
Automatic mitigation detection (close or wick)
Highlight when price enters an active VI
Perfect for tracking aggressive buying/selling footprints.
11. Timezone & Date/Time Widget
Uses IANA timezones for:
Accurate session boundaries
Proper DST handling
Multi-market consistency
Also includes a small on-chart table showing:
Your timezone date/time
Exchange timezone date/time
Great for globally active traders.
12. Max Display Timeframe
To prevent clutter, the script disables visuals above a chosen timeframe.
If you exceed it:
A clean on-chart message appears
Tells you to lower your chart TF or adjust the Max Display TF
Keeps charts fast and clean
Key Inputs & Customization
Timezone (IANA format)
Max Display Timeframe
Session/Killzone toggles, colors, naming
Opening levels (00:00 / 08:30 / 09:30 / 13:30)
Previous Day AM/PM highs/lows
NDOG / NWOG gap settings
RTH gap settings
FVG batching (4 independent timeframes)
Fractal type
Order Block settings (range type, deletion, FVG filter)
Market structure settings
Volume Imbalance settings
Date/time widget settings
Everything is modular — turn features on/off individually.
How It Helps Traders
For Intraday Traders / Scalpers:
Session mapping for timing setups
Exact key opening prices
RTH gaps and internals
Precise daily AM/PM high–low context
HTF FVGs, OBs, VI zones for higher-timeframe bias
Real-time CHoCH/BOS for entry timing
For Swing Traders:
Daily/weekly context plotted automatically
NDOG, NWOG, RTH gap awareness
Macro structure levels
HTF FVGs and OBs for HTF targets

Ultimate SMC Dashboard — Pro v2.1 (ICT/SMC)
🔍 1. General Objective of the Script
This script is a complete visual and algorithmic SMC (Smart Money Concepts) analysis system that:
* Automatically identifies market structures (BOS / CHoCH / Liquidity Grab).
* Detects and dynamically maintains Fair Value Gaps (FVG) according to ICT methodology .
* Draws and tracks the evolution of Order Blocks (OB) and Breaker Blocks (BRK) .
* Calculates MACD / Volume divergences .
* Analyzes trend, volume, and buyer/seller dominance .
* Displays a clear and dynamic dashboard directly on the chart.
* Builds the foundation for reversal / continuation probability models .
---
⚙️ 2. Input Parameters
The script is highly configurable. Inputs are organized by sections:
Structure (ICT)
* Pivot left/right (swing length) → determines the swing size for HH/LL detection.
* OB lookback → number of candles to look back for an Order Block after a BOS.
* Show BOS / CHoCH / Liquidity Grab → enables or disables structural elements.
Imbalances (FVG)
* Enables the display of Fair Value Gaps .
* Manages minimum size, transparency, and **dynamic reduction** when partially filled.
* Limits the maximum number of FVGs displayed simultaneously.
Order Blocks / Breakers
* Enables Order Blocks and Breaker Blocks .
* Defines their colors, opacity , and dynamic behavior .
* Automatically removes outdated OBs exceeding the maximum limit.
Signal & Probabilities
* Sets the lookback period for structure calculation.
* Calculates average volume (MA) to detect dominance and momentum.
* Defines the probability threshold for signals (not yet visible in this snippet).
RSI / EMA / Divergences / Sentiment
* Prepares additional indicator modules, such as:
* MACD divergence detection
* RSI / EMA visualization
* Market sentiment and funding metrics
---
🧠 3. Market Structure Logic (ICT Core)
a. Pivot Detection
Uses ta.pivothigh and ta.pivotlow to detect Higher Highs (HH) and Lower Lows (LL) .
b. Break of Structure (BOS)
A BOS occurs when price breaks a validated swing high or low:
* bullBOS → bullish break.
* bearBOS → bearish break.
c. Change of Character (CHoCH)
A CHoCH is detected when BOS direction changes (e.g., a bullish BOS followed by a bearish BOS).
d. Liquidity Grab
Detection of liquidity sweeps :
* grabUp : wick above the last high, closing below.
* grabDown : wick below the last low, closing above.
All these signals feed into the main trend bias (Bull / Bear / Flat).
---
🧱 4. Fair Value Gaps (FVG)
The FVG logic strictly follows ICT principles :
* Bullish FVG: if `low > high `
* Bearish FVG: if `high < low `
Each FVG becomes a dynamic box :
* Shrinks in real time as price partially fills it.
* Automatically deletes itself once fully closed.
* Color and opacity depend on direction (green = bullish, red = bearish).
This is one of the most complex parts of the code, managing:
* Arrays of box objects (`array`)
* Real-time updates for every candle
* Automatic cleanup to prevent chart overload
---
🧱 5. Order Blocks (OB) and Breaker Blocks
An Order Block is generated:
* After a BOS,
* By identifying the last candle opposite to the trend before the break.
Examples:
* Bullish BOS → Bullish OB = last red candle before the breakout.
* Bearish BOS → Bearish OB = last green candle before the breakdown.
Each OB:
* Is visualized as a colored rectangle (cyan or orange).
* Becomes inactive once mitigated (touched).
* Is removed and converted into a Breaker Block if invalidated (opposite side broken).
The system uses arrays similar to FVGs to maintain visual cleanliness and chart efficiency .
---
📊 6. Volume and Dominance
The script computes:
* A moving average (SMA) of volume.
* Whether the current volume is abnormally high or low .
* Whether candles are buyer- or seller-dominant .
Simplified display:
* 🔥 High Volume
* 📉 Low Volume
* 🟩 Buyers Dominant
* 🟥 Sellers Dominant
* ⚪️ Neutral
---
🧩 7. Textual Dashboard
Text variables such as:
* `struct_txt` → displays BOS, CHoCH, Grab info
* `fvg_txt` → “🟢 Open” or “🔴 Close”
* `ob_txt` → “🟩 Open” or “🟥 Close”
These feed a visual dashboard (not yet displayed in this excerpt), summarizing the entire market state in real time.
---
💡 8. Summary
The script:
* Observes market structure (ICT) .
* Automatically draws institutional imbalance and interest zones (OB, FVG).
* Dynamically manages their evolution.
* Provides visual structural, volume, and sentiment signals .
* Builds a complete foundation for a professional ICT/SMC dashboard .

WorldCup Dashboard + Institutional Sessions© 2025 NewMeta™ — Educational use only.
# Full, Premium Description
## WorldCup Dashboard + Institutional Sessions
**A trade-ready, intraday framework that combines market structure, real flow, and institutional timing.**
This toolkit fuses **Institutional Sessions** with a **price–volume decision engine** so you can see *who is active*, *where value sits*, and *whether the drive is real*. You get: **CVD/Delta**, volume-weighted **Momentum**, **Aggression** spikes, **FVG (MTF)** with nearest side, **Daily Volume Profile (VAH/POC/VAL)**, **ATR regime**, a **24h position gauge**, classic **candle patterns**, IBH/IBL + **first-hour “true close”** lines, and a **10-vote confluence scoreboard**—all in one view.
---
## What’s inside (and how to trade it)
### 🌍 Institutional Sessions (Sydney • Tokyo • London • New York)
* Session boxes + a highlighted **first hour**.
* Plots the **true close** (first-hour close) as a running line with a label.
**Use:** Many desks anchor risk to this print. Above = bullish bias; below = bearish. **IBH/IBL** breaks during London/NY carry the most signal.
### 📊 CVD / Delta (Flow)
* Net buyer vs seller pressure with smooth trend state.
**Use:** **Rising CVD + acceptance above mid/POC** confirms continuation. Bearish price + rising CVD = caution (possible absorption).
### ⚡ Volume-Weighted Momentum
* Momentum adjusted by participation quality (volume).
**Use:** Momentum>MA and >0 → trend drive is “real”; <0 and falling → distribution risk.
### 🔥 Aggression Detector
* ROC × normalized volume × wick factor to flag **forceful** candles.
**Use:** On spikes, avoid fading blindly—wait for pullbacks into **aligned FVG** or for aggression to cool.
### 🟦🟪 Fair Value Gaps (with MTF)
* Detects up to 3 recent FVGs and marks the **nearest** side to price.
**Use:** Trend pullbacks into **bullish FVG** for longs; bounces into **bearish FVG** for shorts. Optional threshold to filter weak gaps.
### 🧭 24h Gauge (positioning)
* Shows current price across the 24h low⇢high with a mid reference.
**Use:** Above mid and pushing upper third = momentum continuation setups; below mid = sell the rips bias.
### 🧱 Daily Volume Profile (manual per day)
* **VAH / POC / VAL** derived from discretized rows.
**Use:** **POC below** supports longs; **POC above** caps rallies. Fade VAH/VAL in ranges; treat them as break/hold levels in trends.
### 📈 ATR Regime
* **ATR vs ATR-avg** with direction and regime flag (**HIGH / NORMAL / LOW**).
**Use:** HIGH ⇒ give trades room & favor trend following. LOW ⇒ fade edges, scale targets.
### 🕯️ Candle Patterns (contextual, not standalone)
* Engulfings, Morning/Evening Star, 3 Soldiers/Crows, Harami, Hammer/Shooting Star, Double Top/Bottom.
**Use:** Only with session + flow + momentum alignment.
### 🤝 Price–Volume Classification
* Labels each bar as **continuation**, **exhaustion**, **distribution**, or **healthy pullback**.
**Use:** Align continuation reads with trend; treat “Price↑ + Vol↓” as a caution flag.
### 🧪 Confluence Scoreboard & B/S Meter
* Ten elements vote: 🔵 bull, ⚪ neutral, 🟣 bear.
**Use:** Execution filter—take setups when the board’s skew matches your trade direction.
---
## Playbooks (actionable)
**Trend Pullback (Long)**
1. London/NY active, Momentum↑, CVD↑, price above 24h mid & POC.
2. Pullback into **nearest bullish FVG**.
3. Invalidate under FVG low or **true-close** line.
4. Targets: IBH → VAH → 24h high.
**Range Fade (Short)**
1. Asia/quiet regime, **Price↑ + Vol↓** into **VAH**, ATR low.
2. Nearest FVG bearish or scoreboard skew bearish.
3. Invalidate above VAH/IBH.
4. Targets: POC → VAL.
**News/Impulse**
Aggression spike? Don’t chase. Let it pull back into the aligned FVG; require CVD/Momentum agreement before entry.
---
## Alerts (included)
* **Bull/Bear Confluence ≥ 7/10**
* **Intraday Target Achieved** / **Daily Target Achieved**
* **Session True-Close Retests** (Sydney/Tokyo/London/NY)
*(Keep alerts “Once per bar” unless you specifically want intrabar triggers.)*
---
## Setup Tips
* **UTC**: Choose the reference that matches how you track sessions (default UTC+2).
* **Volume threshold**: 2.0× is a strong baseline; raise for noisy alts, lower for majors.
* **CVD smoothing**: 14–24 for scalps; 24–34 for slower markets.
* **ATR lengths**: Keep defaults unless your asset has a persistent regime shift.
---
## Why this framework?
Because **timing (sessions)**, **truth (flow)**, and **location (value/FVG)** together beat any single signal. You get *who is trading*, *how strong the push is*, and *where risk lives*—on one screen—so execution is faster and cleaner.
---
**Disclaimer**: Educational use only. Not financial advice. Markets are risky—backtest and size responsibly.

Multi-TF 👀### Multi-Timeframe Analysis (MTF-Analysis)
**Overview**
The Multi-Timeframe Analysis indicator is a powerful visualization tool designed for traders who incorporate multi-timeframe (MTF) strategies into their decision-making process. It overlays compact, customizable candle representations from up to four higher timeframes directly on your chart, positioned to the right of the last bar for quick reference. This allows you to monitor price action, momentum via EMAs, and key levels like Fair Value Gaps (FVGs) across multiple resolutions without switching charts. Built with efficiency in mind, it supports automatic timeframe detection, real-time updates, and a clean, non-intrusive design that enhances your trading workflow.
Ideal for day traders, swing traders, and scalpers, this indicator helps identify alignments between timeframes, spot potential reversals or continuations, and validate entries/exits based on higher-timeframe context. It leverages Pine Script v6 for smooth performance, with optimizations to handle up to 5000 bars back and extensive drawing limits.
**Key Features**
- **Multi-Timeframe Candle Display**: Renders recent candles (configurable from 5 to 100 per timeframe) from selected higher timeframes (e.g., 5m, 15m, 1H, 4H) as compact bars with customizable width, spacing, and padding. Bullish and bearish candles are color-coded for instant recognition.
- **Automatic Timeframe Adaptation**: When enabled, the indicator intelligently selects complementary timeframes based on your chart's resolution (e.g., on a 1m chart, it might show 5m, 15m, and 1H). Manual overrides are available for full control.
- **EMA Overlays**: Plots EMA9, EMA21, and EMA50 on each MTF section using a user-defined source (e.g., OHLC/4, close). EMAs can be dashed for clarity and enabled/disabled per timeframe, helping to gauge momentum and trend strength.
- **Fair Value Gaps (FVGs)**: Detects bullish (+FVG) and bearish (-FVG) gaps with a configurable lookback length (5-50 bars). Gaps are visualized as dotted boxes extending from the candle, highlighting potential support/resistance zones or imbalances.
- **Time Labels and Debugging**: Displays timestamp labels under every fourth candle for chronological context. A debug mode expands spacing and adds detailed labels (e.g., OHLC, volume, EMA values) for testing and verification.
- **Customization Options**: Extensive inputs for colors (bodies, wicks, EMAs, FVGs), label sizes/styles, and layout ensure seamless integration with your chart theme. Supports futures symbols with a time offset adjustment.
- **Performance Optimizations**: Uses arrays for efficient data management, clears drawings on realtime updates or timeframe changes, and limits buffer sizes to prevent overload.
**How to Use**
1. Add the indicator to your chart via TradingView's "Indicators" menu.
2. Configure timeframes: Enable/disable up to four TFs and set the number of candles to display. Use "Auto Timeframe" for smart defaults.
3. Adjust EMAs: Select the source type and toggle per TF to focus on relevant momentum signals (e.g., EMA9 crossovers for short-term trades).
4. Enable FVGs: Activate per TF and tweak the length to suit your market (shorter for volatile assets, longer for trends).
5. Fine-tune appearance: Modify padding, candle width, and colors to avoid clutter. Use debug mode during setup.
6. Interpret: Align your chart's price action with MTF candles—look for confluence in trends, FVGs filling as support/resistance, or EMA alignments for high-probability setups.
**Input Settings**
- **General**: Hour offset for time adjustments (useful for futures).
- **Timeframes**: Enable TFs 1-4, select resolutions (e.g., "5m"), and set candle counts. Auto mode simplifies this.
- **FVG/iFVG**: Toggle per TF, customize colors and detection length.
- **EMA**: Enable per TF, choose source, colors, and dashed style.
- **Candle Appearance**: Bull/bear colors for bodies/wicks, width/spacing/padding, label size/color.
- **Debug**: Expands view for detailed inspection.
**Notes**
- This indicator is non-repainting and updates in realtime, but performance may vary on lower timeframes with many candles—reduce counts if needed.
- FVGs are calculated locally on recent bars for efficiency; historical gaps beyond the buffer aren't shown.
- Compatible with all symbols, but best on volatile markets like forex, crypto, or indices.
- Feedback welcome—updates may include more MA types or advanced FVG filters.
Enhance your edge with multi-timeframe insights—try MTF-Analysis today!

ICT iFVG Detector and Alert [by ote618]Description
This script detects ICT - fair value gaps (FVG) formed by price gaps between Candle 1 and Candle 3, then monitors the next 5 candles for an inverse fair value gap (iFVG).
What It Detects
Bullish FVG: When Candle 1 high is below Candle 3 low (BISI)
Bearish FVG: When Candle 1 low is above Candle 3 high (SIBI)
Once an FVG is detected, the script checks the next 5 candles:
A Bullish FVG becomes a Bearish IFVG if price closes below Candle 1 high
A Bearish FVG becomes a Bullish IFVG if price closes above Candle 1 low
Only the first bar that validates the FVG triggers the transition to an IFVG.
Visual Output
A shaded rectangle is plotted to mark the original FVG zone (from Candle 1 to Candle 3)
Color-coded:
Red for Bearish IFVG (validated Bullish IG)
Green for Bullish IFVG (validated Bearish IG)
The rectangle extends from Candle 1 to the validating bar
Alerts
You can receive alerts when an FVG becomes an IFVG:
Configurable to fire only on selected timeframes (1m, 5m, 15m, 60m)
Alerts include the direction and the chart timeframe
Settings
Enable Alerts For Timeframe: Choose which timeframe(s) trigger alerts
This tool helps traders identify inverse FVGs (iFVG), a useful ICT concept.

Smart Stop-Loss (SSL)Smart Stop-Loss (SSL) Indicator
Overview
The Smart Stop-Loss (SSL) indicator is an advanced risk management tool designed to help traders set dynamic stop-loss levels based on market structure, volatility, and momentum. Unlike traditional fixed stop-loss methods, SSL adapts to changing market conditions, helping to avoid premature exits while protecting capital during true reversals.
Key Features
1. Volatility-Based Adjustments
- Uses Average True Range (ATR) to measure market volatility
- Automatically widens stop-loss during volatile periods and tightens during calm markets
- Customizable ATR multiplier (default: 1.5x) to adjust sensitivity
2. Market Structure Integration
- Identifies significant swing highs and lows to establish support/resistance levels
- Places stop-loss levels beyond these structural points to avoid common stop hunts
3. Fair Value Gap (FVG) Detection
- Identifies imbalances in order flow that often lead to strong directional moves
- Bullish FVG: A gap up where the current high is below previous low
- Bearish FVG: A gap down where the current low is above previous high
4. Smart Stop-Loss Tightening
- Automatically tightens stop-loss when FVGs are mitigated (filled)
- Uses RSI as a momentum filter to prevent premature adjustments
- Creates a trailing effect that locks in profits as trades move favorably
How to Use
For Long Positions:
1. **Entry**: Look for bullish FVG formations (green step line appears)
2. **Stop-Loss Placement**: Set your stop at or slightly below the green step line
3. **Stop Adjustment**: When price closes above the FVG zone and RSI > 50, the stop will automatically tighten
4. **Exit**: Exit the position when price closes below the green line or when your profit target is reached
For Short Positions:
1. **Entry**: Look for bearish FVG formations (red step line appears)
2. **Stop-Loss Placement**: Set your stop at or slightly above the red step line
3. **Stop Adjustment**: When price closes below the FVG zone and RSI < 50, the stop will automatically tighten
4. **Exit**: Exit the position when price closes above the red line or when your profit target is reached
Real-World Examples
Example 1: Trend Continuation
In an uptrend, when a bullish FVG appears, it often indicates institutional buying pressure. The SSL will place a stop below the swing low with an ATR buffer. As price continues upward and mitigates the FVG, the SSL tightens to protect profits while allowing the trend to continue.
Example 2: Avoiding Premature Exits
During normal market fluctuations, traditional fixed stops might get triggered too early. The SSL's adaptive nature accounts for volatility, keeping you in profitable trades longer by positioning stops beyond noise levels.
Example 3: Protecting Against Reversals
When a true reversal occurs, the momentum filter (RSI) will confirm the change in direction, allowing the SSL to maintain wider protection rather than prematurely tightening in a false move.
Tips for Best Results
1. **Timeframe Selection**: Works best on 1H, 4H and daily charts where market structure is more reliable
2. **Combine with Trend Analysis**: Use in conjunction with trend identification tools
3. **ATR Adjustment**: Increase the ATR multiplier for more volatile instruments
4. **Alert Setup**: Configure the built-in alerts to notify you when stop levels are breached
5. **Visual Confirmation**: The labels show exact stop values to help with order placement
Disclaimer
This indicator is provided for informational and educational purposes only. While it uses advanced techniques to determine potential stop-loss levels, no indicator can predict market movements with certainty. Always manage your risk appropriately and never risk more than you can afford to lose. Past performance is not indicative of future results. The developer of this indicator accepts no liability for trading losses incurred from its use. Always test thoroughly on demo accounts before using in live trading.

cd_mtg_CxThis indicator is designed to show discount / premium zones and price gaps (fvg) on the screen within a rule.
Overview:
As it is known, the price continues its movement with swings and uses some zones to continue or reverse its movement. Commonly used of these zones are named by different traders such as supply / demand, order block, suport/ resistance zone. And again, many traders prefer to be involved in the entry when the price determined with the help of market structure reaches the premium / discount zones.
Expectation from the indicator and how it works:
Identify areas where the price is likely to react.
Zones to be determined for this purpose:
1- Discount / premium zones
2- Mitigation zones with price retesting
3- Price gaps (FVG's)
How is it determined?
1- Tracks the price in the higher timeframe it is alignment with, when the price violates the previous candle in the new candle (high/low), the previous candle's zones between top/bottom - middle levels.
high - middle => premium zone
low - middle => discount zone
and displays it on the screen.
2- Mitigation zones: When the price retests the discount/premium zones, those zones appear on the screen by extending to the last bar and are named as mitigation zones in the indicator.
3- Price gaps (FVG's): It is shown on the screen with known rules and higher time frame option.
Zones where the price does not respect are deleted from the display.
Settings:
- HTF for mitigation zones : Alignment high time frame selection
- HTF for FVG zones : Alignment high time frame selection
- Show HTF boxes : Show / hide
- Show Mitigation zones : Show / hide
- Show Discount/Premium zones: Show / hide
- Show FVG zones : Show / hide
And colors….
Screenshots and example :
The 15m chart is open on the screen and I select the alignment time zone H4. I select the higher time zone H1 in FVGs.
Screenshot with Show HTF boxes and Show FVG zones selected:
With show discount / premium zones selected :
With show mitigation zones selected :
Final Word : When the price comes to our zone, we take action together with other confirmations.
Our expectation from the zones is to send the price back to the region it came from.
If it is not successful, we should plan a reverse transaction.
Cheerful trades...
-- Türkçe Açıklama
Bu indikatör, bir kural dahilinde ucuzluk / pahalılık bölgelerini ve fiyat boşluklarını (fvg) ekranda göstermek ve traderlara en uygun yerde işlem fırsatı sunmak üzere tasarlanmıştır.
Genel Bakış :
Bilindiği gibi fiyat hareketine salınımlarla devam eder ve hareketine devam etmek ya da tersine dönmek için bazı bölgeleri kullanır. Bu bölgelerin yaygın şekilde kullanılanları supply / demand, order block , support /resistance zone gibi farklı ekollerce adlandırılmıştır. Ve yine birçok trader market yapısı yardımla belirlediği fiyatın ucuzluk / pahalılık bölgelerine gelmesiyle işleme dahil olmayı tercih eder.
İndikatörden beklenti ve nasıl çalışır:
Beklenti; Fiyatın tepki alması muhtemel bölgeleri belirlemesidir.
Bu amaçla belirleyeceği bölgeler:
1- Ucuzluk / pahalılık bölgeleri
2- Fiyatın tekrar test etmesiyle “mitigasyon bölgeleri/mitige”
3- Fiyat boşlukları (FVG ler)
Nasıl belirler ?
1- Fiyatı uyumlu olduğu üst zaman diliminde takip eder, fiyat yeni mumda bir önceki mumu ihlal ettiğinde (high/low), önceki mumun tepe/dip - orta seviyeleri arasında kalan bölgeleri
high - middle => premium zone
low - middle => discount zone
olarak belirler ve ekranda gösterir.
2- Mitigasyon bölgesi: Fiyat ucuzluk/ pahalılık bölgeleri yeniden test ettiğinde, o bölgeler son bara uzatılarak ekranda görünür ve indikatörde ismi “mitigation zone” olarak geçer.
3- Fiyat boşlukları (FVG) : Bilinen kurallarla ve üst zaman dilimi seçeneğiyle ekranda gösterilir.
Fiyatın saygı göstermediği bölgeler ekrandan silinir.
Ayarlar:
- HTF for mitigation zones : Uyumlu üst zaman dilimi seçimi
- HTF for FVG zones : Uyumlu üst zaman dilimi seçimi
Gösterim ve renk seçenekleri.
Ekran görüntüleri ve örnek : (İngilizce kısımda)
Son söz : Fiyat bölgemize geldiğinde diğer konfirmelerle birlikte işlem alıyoruz.
Bölgelerden beklentimiz fiyatı geldiği bölgeye tekrar göndermesidir.
Eğer başarılı olamazsa tersi yönde işlem planlamalıyız.
Neşeli tradeler...

ICT HTF Liquidity Levels /w Alert [MsF]Japanese below / 日本語説明は英文の後にあります。
-------------------------
*This indicator is based on sbtnc's "HTF Liquidity Levels". It's a very cool indicator. thank you.
It has 3 functions: visualization of HTF liquidity (with alert), candle color change when displacement occurs, and MSB (market structure break) line display.
=== Function description ===
1. HTF liquidity (with alert)
Lines visualize the liquidity pools on the HTF bars. Alerts can be set for each TF's line.
Once the price reaches the line, the line is repaint.
To put it plainly, the old line disappears and a new line appears. The line that disappeared remains as a purged line. (It is also possible to hide the purged line with a parameter)
The alert will be triggered at the moment the line disappears. An alert will be issued when you touch the HTF's liquid pools where the loss is accumulated, so you can notice the stop hunting with the alert.
This alert is an original feature of this indicator.
The timeframe of the HTF can't modify. You can get Monthly, weekly, daily and H1 and H4.
Each timeframe displays the 3 most recent lines. By narrowing it down to 3, it is devised to make it easier to see visually. (This indicator original)
2. Displacement
Change the color display of the candlesticks when a bullish candle stick or bearish candle stick is attached. Furthermore, by enabling the "Require FVG" option, you can easily discover the FVG (Fair Value Gap). It is a very useful function for ICT trading.
3. MSB (market structure break)
Displays High/Low lines for the period specified by the parameter. It is useful for discovering BoS & CHoCH/MSS, which are important in ICT trading.
=== Parameter description ===
- HTF LIQUIDITY
- Daily … Daily line display settings (color, line width)
- Weekly … Weekly line display settings (color, line width)
- Monthly … Monthly line display settings (color, line width)
- INTRADAY LIQUIDITY
- 1H … 1H line display settings (color, line width)
- 4H … 4H line display settings (color, line width)
- PURGED LIQUIDITY … Display setting of the line once the candle reaches
- Show Purge Daily … Daily purged line display/non-display setting
- Show Purge Weekly … Weekly purged line display/non-display setting
- Show Purge Monthly … Monthly purged line display/non-display setting
- Show Purge 1H … 1H purged line display/non-display setting
- Show Purge 4H … 4H purged line display/non-display setting
- MARKET STRUCTURE BREAK - MBS
- Loopback … Period for searching High/Low
- DISPLACEMENT FOR FVG
- Require FVG … Draw only when FVG occurs
- Displacement Type … Displacement from open to close? or from high to low?
- Displacement Length … Period over which to calculate the standard deviation
- Displacement Strength … The larger the number, the stronger the displacement detected
-------------------------
このインジケータはsbtncさんの"HTF Liquidity Levels"をベースに作成しています。
上位足流動性の可視化(アラート付き)、変位発生時のローソク色変更、MSB(market structure break)ライン表示の3つの機能を有します。
<機能説明>
■上位足流動性の可視化
上位足の流動性の吹き溜まり(ストップが溜まっているところ)をラインで可視化します。ラインにはアラートを設定することが可能です。
一度価格がラインに到達するとそのラインは再描画されます。
平たく言うと、今までのラインが消えて新しいラインが出現する。という事です。
消えたラインはpurgeラインとして残ります。(パラメータでpurgeラインを非表示にすることも可能です)
アラートはラインが消える瞬間に発報します。上位足の損切り溜まってるところにタッチするとアラートを発報するので、アラートにてストップ狩りに気づくことができます。
このアラート発報については本インジケータオリジナルの機能となります。
表示可能な上位足のタイムフレームは固定です。月足、週足、日足およびH1とH4を表示することができます。
各タイムフレーム、直近から3つのラインを表示します。3つに絞ることで視覚的に見やすく工夫しています。(本インジケータオリジナル)
■変位発生時のローソク色変更
大きな陽線、陰線を付けた場合に、そのローソク足をカラー表示を変更します。
さらに"Require FVG"オプションを有効にすることで、FVG(Fair Value Gap)を容易に発見することができます。ICTトレードにを行うにあたり大変有用な機能となっています。
■MSB(market structure break)ライン表示
パラメータで指定した期間のHigh/Lowをライン表示します。ICTトレードで重要視しているBoS & CHoCH/MSSの発見に役立ちます。
<パラメータ説明>
- HTF LIQUIDITY
- Daily … 日足ライン表示設定(色、線幅)
- Weekly … 週足ライン表示設定(色、線幅)
- Monthly … 月足ライン表示設定(色、線幅)
- INTRADAY LIQUIDITY
- 1H … 1時間足ライン表示設定(色、線幅)
- 4H … 4時間足ライン表示設定(色、線幅)
- PURGED LIQUIDITY … 一度到達したラインの表示設定
- Show Purge Daily … 日足ライン表示/非表示設定
- Show Purge Weekly … 週足ライン表示/非表示設定
- Show Purge Monthly … 月足ライン表示/非表示設定
- Show Purge 1H … 1時間足ライン表示/非表示設定
- Show Purge 4H … 4時間足ライン表示/非表示設定
- MARKET STRUCTURE BREAK - MBS
- Loopback … High/Lowを探索する期間
- DISPLACEMENT FOR FVG
- Require FVG … FVG発生時のみ描画する
- Displacement Type … openからcloseまでの変位か?highからlowまでの変位か?
- Displacement Length … 標準偏差を計算する期間
- Displacement Strength … 変位の強さ(数字が大きいほど強い変位を検出)

Fair Value Gap Oscillator (Expo)█ Overview
The Fair Value Gap Oscillator (Expo) is an indicator based on the concept of Fair Value Gaps. It is a momentum indicator that helps traders identify mispricings in the market over time. The indicator also incorporates volume and volatility to increase its accuracy further. The indicator can be used in both trending and range-bound markets.
FVG occurs when there is an insufficient amount of buyers and sellers in the market for a particular asset. This can cause a sudden and large gap in the asset price, creating an imbalance in the price. This gap can be large enough to prevent traders from entering the market to take advantage of the price discrepancy. This, in turn, leads to a lack of liquidity and further price volatility.
█ How is the Fair Value Gap Oscialltor calculated?
The Fair Value Gap Oscillator is calculated by using historical Fair Value Gapa, volume, and volatility to determine if the market is trading at a discount or premium relative to its historical fair value. It is based on the idea that prices move in fair value cycles and that by looking at the oscillations of FVG data over time, traders can get a deeper insight into how imbalances impact the price over time.
█ Oscillator Trading
Oscillators are technical indicators that are used to measure momentum within a given market. These indicators measure the speed and magnitude of price movements. Traders use oscillators to identify potential entry and exit points in the market. They may look for overbought and oversold conditions, or they may look for divergence between the price of an asset and its oscillator. When these signals are identified, traders can then enter or exit positions accordingly.
█ How to use
It is a momentum indicator that helps traders identify mispricings in the market over time. In addition, the FVG Oscialltor can be used to identify overbought and oversold conditions in the market, as well as trends and leading trend changes.
Trending Indicator
The Fair Value Gap Oscillator can also be used to identify trends in the market. By tracking the FVG over time, investors can identify whether the market is trending up or down.
Leading Indicator
This indicator can be used to identify leading changes in the market’s momentum and price action. It will indicate beforehand when the momentum decreases and a potential trend change is about to come.
Divergences
Leading Indicators are great for identifying divergences. This Fair Value Gap Oscillator is a powerful yet simple tool to spot divergences in the market.
It is important to remember that the Fair Value Gap Oscillator is just one tool in your investment toolbox. It should be used in conjunction with other smart money concept indicators to identify excellent trading opportunities.
█ Indicator Features
Trend FVG
A Trend FVG feature is added to help Trend Traders get a long-term overview of the FVG trend. This feature can be used for the leading FVG calculation to get a predictive FVG trend.
Leading FVG Calculation
The leading calculation makes the Fair Value Gap oscillator sensitive to fair value changes and becomes more leading.
Trend Line
The Trend line feature is a combination of the leading and the long-term trend that can be used as trend confirmation.
-----------------
Disclaimer
The information contained in my Scripts/Indicators/Ideas/Algos/Systems does not constitute financial advice or a solicitation to buy or sell any securities of any type. I will not accept liability for any loss or damage, including without limitation any loss of profit, which may arise directly or indirectly from the use of or reliance on such information.
All investments involve risk, and the past performance of a security, industry, sector, market, financial product, trading strategy, backtest, or individual's trading does not guarantee future results or returns. Investors are fully responsible for any investment decisions they make. Such decisions should be based solely on an evaluation of their financial circumstances, investment objectives, risk tolerance, and liquidity needs.
My Scripts/Indicators/Ideas/Algos/Systems are only for educational purposes!
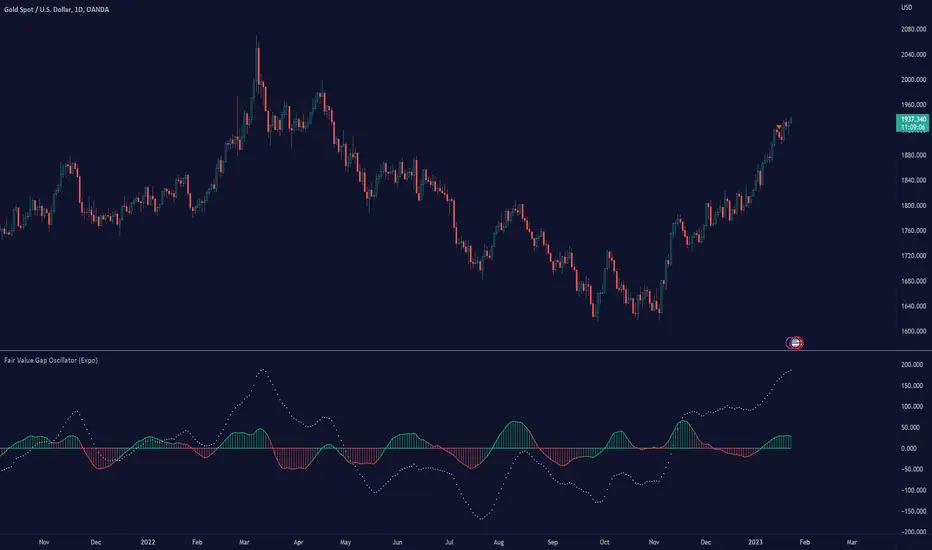
LVN Smart Liquidity📊 LVN SMART LIQUIDITY
═════════════════════════════════════════════════════════════
─────────────────────────────────────────────────────────────
🎯 OVERVIEW
LVN Smart Liquidity is an advanced Market Profile-based indicator that automatically identifies Low Volume Nodes (LVN) across multiple timeframes. Unlike traditional volume-based indicators, this tool uses TPO (Time Price Opportunity) calculations to detect price levels where minimal trading activity occurred, revealing potential breakout zones and rapid price movement areas.
These LVN zones often behave similarly to Fair Value Gaps (FVG) in Smart Money Concepts, representing "thin air" areas where price tends to move quickly with minimal resistance. The indicator provides dynamic zone management with an immunity period system to prevent premature zone closure.
─────────────────────────────────────────────────────────────
🔬 HOW IT WORKS
MARKET PROFILE TPO METHODOLOGY:
The indicator analyzes each higher timeframe period by:
1. Dividing the price range into 20 equal levels
2. Counting how many bars touched each level (TPO count)
3. Identifying levels with TPO counts below the threshold (default 30% of maximum)
4. Creating horizontal zones that extend until price touches them
MULTI-TIMEFRAME ANALYSIS:
• Supports up to 5 independent timeframes simultaneously
• Each timeframe generates its own LVN zones with unique colors
• Auto-timeframe mode adapts to your chart period
• Zones project from historical sessions onto current price action
SMART ZONE MANAGEMENT:
• Immunity Period: New zones are protected for N bars after creation (default 20)
• This prevents zones from disappearing immediately when price is already within them
• Zones extend right until price touches them, then stop extending
• Historical zones remain visible for reference (optional)
─────────────────────────────────────────────────────────────
💡 WHY LVN ZONES MATTER
Low Volume Nodes represent price levels where:
✓ Price spent minimal time (rejection zones)
✓ Few market participants were active
✓ Inefficient price discovery occurred
✓ Similar to Fair Value Gaps in ICT/SMC methodology
TRADING APPLICATIONS:
• Breakout Acceleration: Price moves rapidly through LVN zones
• Profit Targets: Place targets beyond LVN zones where momentum slows
• Stop Loss Placement: Avoid placing stops inside LVN zones (price likely to continue)
• Confluence with FVG: LVN zones often align with Fair Value Gaps
• Retest Opportunities: When price revisits LVN, expect quick moves
─────────────────────────────────────────────────────────────
⚙️ KEY FEATURES
TIMEFRAME FLEXIBILITY:
• 5 independent timeframe slots with enable/disable toggles
• Auto-mode intelligently selects higher timeframes
• Preset options: 5m, 15m, 30m, 1H, 2H, 4H, D, W, 2W, M, 3M, 6M, 12M
VISUAL CUSTOMIZATION:
• Individual color settings for each timeframe
• Adjustable box transparency and border width
• Toggle timeframe labels and period dates on/off
• Four text size options: tiny, small, normal, large
ADVANCED CONTROLS:
• LVN Threshold: 0-50% (default 30%) - lower = fewer, stronger zones
• Immunity Period: 0-50 bars (default 20) - prevents premature closure
• Show/Hide old boxes for clean chart appearance
• Maximum 500 boxes supported per timeframe
PROFESSIONAL DISPLAY:
• Zones show timeframe label (5m, 1H, D, etc.)
• Optional period dates (dd.MM-dd.MM format)
• Boxes extend right dynamically until price touch
• Clean visual hierarchy with bordered zones
─────────────────────────────────────────────────────────────
📈 HOW TO USE
SETUP:
1. Add indicator to chart
2. Enable desired timeframes (TF1, TF2, etc.)
3. Adjust LVN threshold based on your trading style:
• 20-25% = Very selective (only thinnest zones)
• 30-35% = Balanced (recommended for most markets)
• 40-50% = More zones (higher sensitivity)
INTERPRETATION:
• RED/DARK ZONES = Low trading activity occurred here
• Price tends to move THROUGH these zones quickly
• Similar behavior to Fair Value Gaps (FVG) in Smart Money theory
• Expect acceleration when price enters LVN zones
TRADING STRATEGIES:
1. BREAKOUT TRADING:
- Wait for price to approach LVN zone
- Enter when price breaks into the zone
- Expect rapid movement through the zone
- Target next support/resistance beyond LVN
2. CONFLUENCE ANALYSIS:
- Combine with other SMC concepts (Order Blocks, FVG, Liquidity)
- LVN + FVG overlap = high-probability acceleration zone
- Use higher timeframe LVN as directional bias
3. MULTI-TIMEFRAME:
- Daily LVN = major breakout zones
- 4H LVN = intraday momentum areas
- 15m LVN = scalping opportunities
─────────────────────────────────────────────────────────────
⚠️ IMPORTANT NOTES
WHAT THIS INDICATOR IS:
✓ Market Profile TPO-based LVN detector
✓ Multi-timeframe zone identification tool
✓ Visual representation of low trading activity areas
✓ Complementary to Smart Money Concepts (SMC/ICT)
WHAT THIS INDICATOR IS NOT:
✗ Not a standalone trading system
✗ Not a guaranteed profit generator
✗ Not financial advice
✗ Requires confirmation from price action and other tools
LIMITATIONS:
• Works best on liquid markets with reliable data
• Lower timeframes may produce excessive zones
• Requires understanding of Market Profile concepts
• Performance depends on proper threshold calibration
BEST PRACTICES:
• Start with 1-2 timeframes, add more as needed
• Use higher timeframes for swing trading
• Combine with support/resistance, trendlines, order blocks
• Backtest on your specific instrument before live trading
• Adjust immunity period based on market volatility
─────────────────────────────────────────────────────────────
🔧 SETTINGS GUIDE
TIMEFRAME GROUPS (1-5):
Each group contains:
• Enable toggle - Turn timeframe on/off
• Timeframe selector - Choose period or Auto
• Box color - Zone fill color
• Border color - Zone outline color
GENERAL SETTINGS:
• LVN Threshold (%) - Percentage of max TPO to qualify as LVN
• Show Old LVN Boxes - Keep historical zones visible
• Box Border Width - Visual thickness (1-4)
• Immunity Period - Protection bars for new zones
• Show Timeframe - Display TF label in boxes
• Show Period - Display date range in boxes
• Text Size - Label size adjustment
─────────────────────────────────────────────────────────────
📊 ORIGINALITY & UNIQUENESS
This indicator is original because:
1. TPO-BASED CALCULATION: Uses Market Profile Time-Price-Opportunity methodology instead of traditional volume analysis, making it work on all markets including those without real volume data (Forex, some indices).
2. IMMUNITY SYSTEM: Unique protection mechanism prevents zones from disappearing immediately when price is already within zone boundaries at creation time.
3. TRUE MULTI-TIMEFRAME: Independent calculation for each timeframe with separate zone management, not simple higher timeframe projection.
4. SMART ZONE LIFECYCLE: Zones dynamically extend until price touch, then become static historical references.
5. FVG-LIKE BEHAVIOR: Bridges traditional Market Profile analysis with modern Smart Money Concepts by identifying zones that behave similarly to Fair Value Gaps.
Unlike existing LVN indicators that rely on volume data, this tool uses time-based analysis, making it universal across all market types and compatible with brokers that don't provide accurate volume information.
─────────────────────────────────────────────────────────────
📚 TECHNICAL BACKGROUND
MARKET PROFILE THEORY:
Developed by J. Peter Steidlmayer in the 1980s, Market Profile analyzes market behavior by examining price and time relationships. Low Volume Nodes in traditional profile represent areas where market participants showed minimal interest.
TPO (TIME PRICE OPPORTUNITY):
Instead of counting volume, TPO counts how many time periods (bars) touched each price level. This approach:
• Works on all markets regardless of volume data quality
• Reflects actual time-based market acceptance/rejection
• Reveals psychological price levels through time distribution
CONNECTION TO SMART MONEY CONCEPTS:
Fair Value Gaps (FVG) in ICT methodology represent similar inefficiencies:
• Areas where price moved too quickly
• Imbalances in buying/selling pressure
• Zones that price may revisit or accelerate through
• LVN zones often overlap with FVG locations
─────────────────────────────────────────────────────────────
🎓 RECOMMENDED RESOURCES
To maximize this indicator's effectiveness, study:
• Market Profile fundamentals (TPO, POC, Value Area)
• Smart Money Concepts (FVG, Order Blocks, Liquidity)
• Multi-timeframe analysis techniques
• Volume Profile comparison (understand the difference)
COMPANION INDICATOR:
Consider using "HVN Smart Liquidity" (opposite concept) to identify both high and low volume zones for complete Market Profile analysis.
─────────────────────────────────────────────────────────────
💬 SUPPORT & FEEDBACK
Questions or suggestions? Feel free to comment below or send a private message.
If you find this indicator useful, please boost and share with other traders!
⚠️ DISCLAIMER: This indicator is for educational purposes only. Trading involves risk. Always do your own research and use proper risk management.

BORSA 321 - HTF Volume Delta Highlighter Overview
HTF Volume Delta Highlighter is a multi-timeframe tool that builds a compact higher-timeframe (HTF) candle panel on the right side of your chart and injects volume delta, fair value gaps (FVG) and volume imbalance (VI) directly into those candles.
Instead of constantly switching charts, you see:
Where buy vs sell volume is dominating on HTF
Which HTF candles left inefficiencies (FVG / VI)
Key open / high / low / close levels projected back onto your current timeframe
How much time is left for each HTF candle to close
All of this lives visually on your current chart, making it perfect for scalpers and intraday traders who rely on higher-timeframe context.
What It Shows
For up to six higher timeframes (default: 5m, 15m, 1H, 4H, 1D, 1W), the indicator plots:
1. HTF Candle Panel on the Right
Each HTF is drawn as a mini candle strip to the right of price.
You can control:
How many candles per HTF to display
Space between candles
Space between timeframes
Overall offset from current price
This creates a clean HTF “dashboard” without touching your main candles.
2. Volume Delta Inside Each HTF Candle
When delta mode is enabled:
Each HTF candle body is split into:
Buy volume segment (green)
Sell volume segment (red)
The split is proportional to cumulative buy vs sell volume across the entire HTF period.
Optionally, the delta value itself (buy volume − sell volume) is printed:
Positive delta inside the buy segment
Negative delta inside the sell segment
This gives a visual and numeric read of who is in control on that higher timeframe.
3. HTF Fair Value Gaps (FVG)
Within each HTF strip, the script detects and highlights fair value gaps:
Bullish FVG: shaded with a green tone, optionally labeled FVG+
Bearish FVG: shaded with a red tone, optionally labeled FVG-
A line is also drawn through the midpoint of the FVG zone.
These zones quickly show where price left inefficiencies on the higher timeframe that may act as magnets or reaction levels.
4. Volume Imbalance (VI) Zones
Between consecutive HTF candles, the script also marks volume imbalance zones:
Bullish VI zones shaded green (VI+)
Bearish VI zones shaded red (VI-)
These highlight thin or aggressively traded areas that often attract future interaction.
5. Trace Lines Back to Your Main Chart
From the most recent HTF candles, the indicator can project horizontal trace lines:
From Open, High, Low, Close of the monitored HTF candle
With separate styling for each (color, line style, width)
Optional price labels at the right edge for each level
You can choose whether these traces are anchored to the first selected timeframe or the last timeframe, giving you flexibility in what levels matter most.
6. Timeframe & Timer Labels
For each HTF strip, the indicator can show:
Timeframe label (e.g., 5m, 15m, 1H, 4H, 1D, 1W)
Countdown timer for the current HTF candle (time remaining until close)
Labels can appear at the top, bottom, or both ends of the HTF panel.
You can choose whether labels align across all HTFs or follow each strip’s own high/low.
7. Custom Daily Session Handling
For the daily timeframe, you can override the default daily open to match your session preference:
Midnight (standard calendar day)
08:30 New York time
09:30 New York time
The script then treats that custom time as the start of your “daily” candle — useful for traders who sync with cash session opens.
8. Day of Week Labels (For Daily)
On daily HTF candles, you can optionally print a day-of-week letter above the candle:
M, T, W, T, F, S, S
This gives a quick sense of where in the week the current candle sits.
Key Inputs & Customization
HTF 1–6 Enable & Timeframe
Turn each HTF strip on/off
Set timeframe (5m, 15m, 1H, 4H, 1D, 1W, etc.)
Choose how many candles per HTF to display
Max Sets
Limit how many HTFs are shown at once (e.g., only next 3 HTFs).
Styling
Body, border, and wick colors for bullish and bearish candles
Candle width, spacing, and panel offset
Label colors and sizes
Delta Settings
Toggle delta mode on/off
Toggle delta values text inside candles
Imbalance Settings
Toggle FVG on/off, with bullish/bearish colors, labels
Toggle Volume Imbalance on/off, with bullish/bearish colors, labels
Control label text size
Trace Settings
Turn trace lines on/off
Customize style, color, and thickness for O/H/L/C
Choose whether to anchor traces to the first or last timeframe
Label & Timer Settings
Enable/disable HTF labels and timers
Choose label position: Top / Bottom / Both
Alignment mode: Align all strips or Follow Candles
If the chosen HTF isn’t valid for the current chart (not a proper multiple or too low), the script will show a clear on-chart message telling you to increase your chart timeframe to match the selected HTF requirements.
How It Helps Traders
Scalpers & intraday traders can stay on their low timeframe (e.g., 1m / 3m / 5m) while still seeing:
Where HTF buy/sell volume is dominant
Which HTF candles left inefficiencies that may later act as magnets or rejection zones
The exact HTF O/H/L/C levels currently active
How much time remains before the HTF bar closes (key for timing entries around closes).
Swing traders can use it to track daily and weekly HTF structure and delta while drilling down to lower timeframes for precise execution.
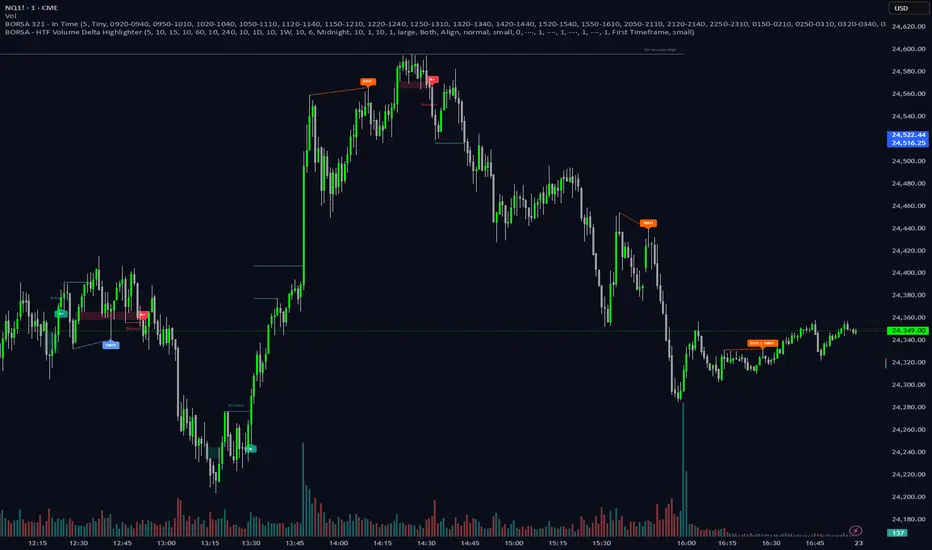
Mars Mission ModelIdentifies Fair Value Gaps (FVGs) during the New York AM session (8-11 AM EST) that form outside Bollinger Bands, then tracks Previous Day High/Low liquidity sweeps to generate inverse FVG signals when conditions align.
What makes this unique:
This is NOT a standard FVG indicator. Uniquely combines session-specific FVG detection with Bollinger Band volatility filtering AND PDH/PDL liquidity sweep confirmation to generate inverse signals. This triple-filter confluence approach is an original methodology not found in existing indicators.
Core Logic:
Detects 3-candle Fair Value Gaps (where candle 1's high/low doesn't overlap with candle 3's low/high). When the middle candle closes beyond the Bollinger Bands during NY AM session, a green box marks the qualified FVG.
The indicator simultaneously tracks Previous Day High/Low levels and monitors for liquidity sweeps (price trading through these levels) during the NY AM session, marked with rocket emojis 🚀.
Inverse FVG Signals:
When a qualified FVG gets mitigated (price closes back through it) AND the corresponding PDH/PDL was already swept in that session, an inverse signal appears (alien emoji 👽):
Bullish FVG mitigated + PDH swept = Bearish inverse signal
Bearish FVG mitigated + PDL swept = Bullish inverse signal
This proprietary combination of session timing, volatility expansion, liquidity sweeps, and FVG mitigation creates a focused reversal detection system that doesn't exist in any open-source indicator.
Let's go to Mars 🚀
For educational use only. Not financial advice.

ICT Trading SuiteThe ICT Trading Suite is a complete price-action toolkit designed for traders who follow ICT concepts such as Fair Value Gaps (FVGs), Order Blocks (OBs), Supply & Demand Zones, Market Structure pivots, Liquidity Zones, and Moving Averages.
This indicator combines multiple institutional concepts into a single clean, optimized, high-performance script — allowing you to see the market the same way smart money does.
Each module can be toggled on/off to match your personal strategy.
🔥 FEATURE SET
1️⃣ Moving Averages (Fully Customisable)
5 MA slots
Multiple MA types: EMA, SMA, RMA, WMA, HMA, VWMA
Custom colours & visibility toggles
Supports all timeframes
Ideal for bias recognition and trend filtering.
2️⃣ Fair Value Gaps (FVG) – ICT 3-Candle Model
The script detects bullish and bearish FVGs using the classic ICT logic:
Bullish FVG → high < low
Bearish FVG → low > high
Features:
Automatic gap detection
Custom colours for up/down FVGs
CE (consequent encroachment) line
Optional deletion when filled
Extend FVGs dynamically
Lookback days filter
FVG blocks automatically update until price fills the imbalance.
3️⃣ Supply & Demand Zones (Swing-Based)
Built from confirmed swing highs/lows using ta.pivothigh and ta.pivotlow.
Features:
ATR-based zone thickness
Zone overlap filtering
Auto-cleaning oldest zones
POI (Point of Interest) marker
3 types of arrays:
Supply zone boxes
Demand zone boxes
POI midline boxes
Zones extend 100 bars by default and update dynamically.
Zones are deleted instantly when price breaks them (converted into BOS behavior).
4️⃣ Smart Money Order Blocks (Simple Engulfing Pattern)
OBs are detected using the classic engulfing model:
Bullish OB
Bearish candle → Engulfed by bullish candle where
close > high
Bearish OB
Bullish candle → Engulfed by bearish candle where
close < low
Each OB stores:
Original top/bottom
Current top/bottom
POI line (optional)
Engulfing candle structure
Mitigation state
Features:
Dynamic boundaries (OB shrinks as price mitigates)
POI line update
Automatic deletion (or recolour) when completely mitigated
Limit how many OBs stay on chart
Support for adding HTF OBs later
This creates very clean and very accurate ICT order blocks.
5️⃣ Liquidity / Vector Zones (Volume-Spread Analysis)
A built-in PVSRA-style logic marks areas of institutional activity.
Vector candles detected using:
Volume ≥ 200% of average
Or candle spread × volume ≥ highest in last 10 bars
Medium-volume vectors (150%) also included
Colour-coded zones extend to the right
Auto-cleanup once price clears the zone
Useful for detecting areas where algorithms (MMXs) aggressively buy/sell.
6️⃣ Pivot Levels
Multiple pivot methods supported:
Traditional
Fibonacci
Woodie
Classic
DM
Camarilla
Features:
Auto / Daily / Weekly / Monthly / Quarterly / Yearly pivots
Dynamic line extension
Labels with prices
Custom colours
Only draws selected pivot levels
Efficient matrix-based pivot system
💎 TECHNICAL EXCELLENCE
✔ Pine Script v6
✔ Efficient arrays & memory handling
✔ Clean dynamic updates
✔ Max-performance structure
✔ Modular design (each component can be toggled)
✔ Integrates all ICT concepts in one tool
🎯 Who Is This Indicator For?
Perfect for:
ICT Traders
Smart Money / Institutional Traders
Day Traders & Scalpers
Swing Traders using OB/FVG
Liquidity hunters
Market structure based traders
Volume-spread or PVSRA focused traders
This combines multiple institutional concepts without cluttering the chart.
🏆 Final Notes
This is a true all-in-one institutional suite, replacing up to 8 separate indicators.
Designed for precision, clarity, and professional price-action workflow.
