XAUUSD Strength Dashboard with VolumeXAUUSD Strength Dashboard with Volume Analysis
📌 Description
This advanced Pine Script indicator provides a multi-timeframe dashboard for XAUUSD (Gold vs. USD), combining price action analysis with volume confirmation to generate high-probability trading signals. It detects:
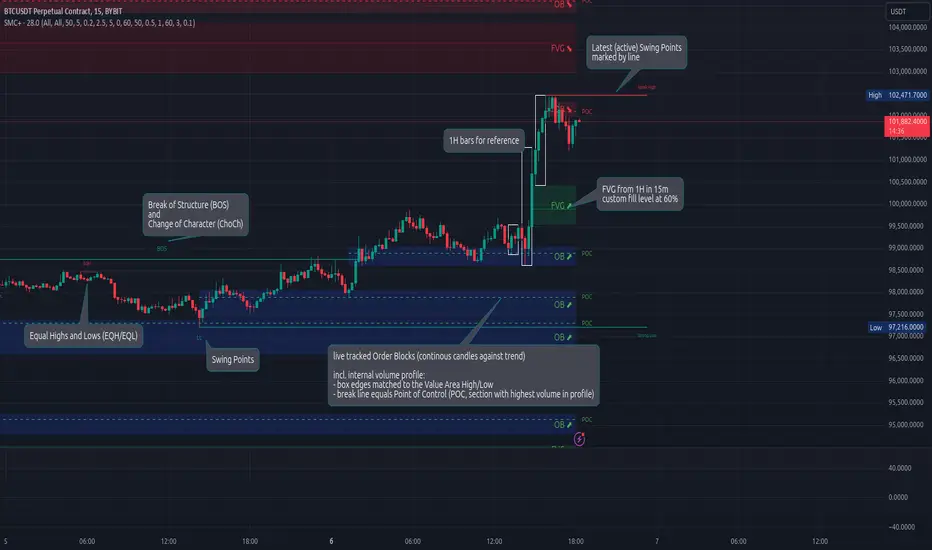
✅ Break of Structure (BOS)
✅ Fair Value Gaps (FVG)
✅ Change of Character (CHOCH)
✅ Trendline Breaks (9/21 SMA Crossover)
✅ Volume Spikes (Confirmation of Strength)
The dashboard displays strength scores (0-100%) and action recommendations (Strong Buy/Buy/Neutral/Sell/Strong Sell) across multiple timeframes, helping traders identify confluences for better trade decisions.
🎯 How It Works
1. Multi-Timeframe Analysis
Fetches data from 1m, 5m, 15m, 30m, 1h, 4h, Daily, and Weekly timeframes.
Compares trend direction, BOS, FVG, CHOCH, and volume spikes across all timeframes.
2. Volume-Confirmed Strength Score
The Strength Score (0-100%) is calculated using:
Trend Direction (25 points) → 9 SMA vs. 21 SMA
Break of Structure (20 points) → New highs/lows with momentum
Fair Value Gaps (10 points) → Imbalance zones
Change of Character (10 points) → Shift in market structure
Trendline Break (20 points) → SMA crossover confirmation
Volume Spike (15 points) → High volume confirms moves
Score Interpretation:
≥75% → Strong Buy (High confidence bullish move)
60-74% → Buy (Bullish but weaker confirmation)
40-59% → Neutral (No strong bias)
25-39% → Sell (Bearish but weaker confirmation)
≤25% → Strong Sell (High confidence bearish move)
3. Dashboard & Chart Markers
Dashboard Table: Shows Trend, BOS, Volume, CHOCH, TL Break, Strength %, Key Level, and Action for each timeframe.
Chart Markers:
🟢 Green Triangles → Bullish BOS
🔴 Red Triangles → Bearish BOS
🟢 Green Circles → Bullish CHOCH
🔴 Red Circles → Bearish CHOCH
📈 Green Arrows → Bullish Trendline Break
📉 Red Arrows → Bearish Trendline Break
"Vol↑" (Lime) → Bullish Volume Spike
"Vol↓" (Maroon) → Bearish Volume Spike
🚀 How to Use
1. Dashboard Interpretation
Higher Timeframes (D/W) → Show the dominant trend.
Lower Timeframes (1m-4h) → Help with entry timing.
Strength Score ≥75% or ≤25% → Look for high-confidence trades.
Volume Spikes → Confirm breakouts/reversals.
2. Trading Strategy
📈 Long (Buy) Setup:
Higher TFs (D/W/4h) show bullish trend (↑).
Current TF has BOS & Volume Spike.
Strength Score ≥60%.
Key Level (Low) holds as support.
📉 Short (Sell) Setup:
Higher TFs (D/W/4h) show bearish trend (↓).
Current TF has BOS & Volume Spike.
Strength Score ≤40%.
Key Level (High) holds as resistance.
3. Customization
Adjust Volume Spike Multiplier (Default: 1.5x) → Controls sensitivity to volume spikes.
Toggle Timeframes → Enable/disable higher/lower timeframes.
🔑 Key Benefits
✔ Multi-Timeframe Confluence → Avoids false signals.
✔ Volume Confirmation → Filters low-quality breakouts.
✔ Clear Strength Scoring → Removes emotional bias.
✔ Visual Chart Markers → Easy to spot key signals.
This indicator is ideal for gold traders who follow institutional order flow, market structure, and volume analysis to improve their trading decisions.
🎯 Best Used With:
Support/Resistance Levels
Fibonacci Retracements
Price Action Confirmation
🚀 Happy Trading! 🚀
Pine Script® indicator