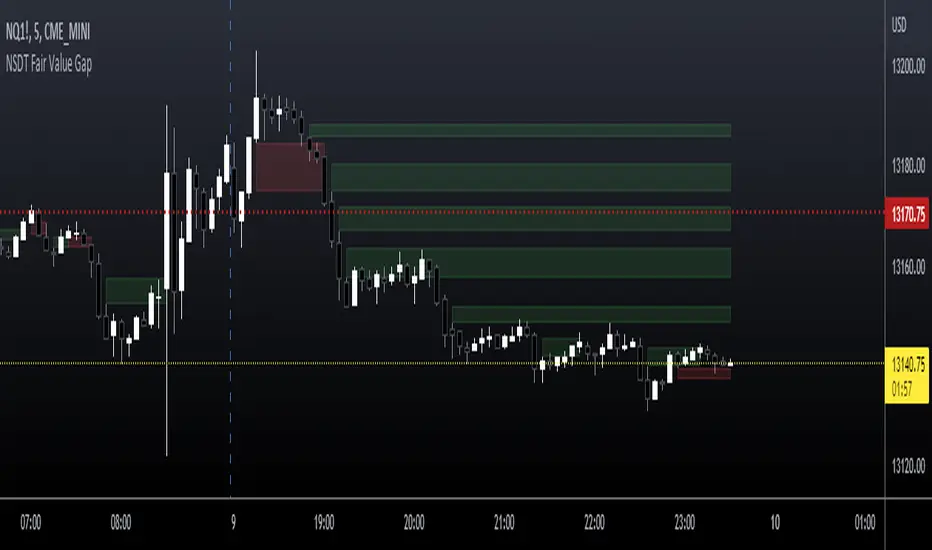
NSDT Fair Value GapThis script is our version of the "Fair Value Gap".
A Fair Value Gap is nothing more than a series of 3 candles with a gap between a candle high/low and a candle high/low two candles prior.
For example:
A Gap Up - the Low of a candle is higher than the High of two candles back.
A Gap Down - the High of a candle is lower than the Low of two candles back.
Typically, on a Gap Up, the trader would wait for the price to re-enter the Gap, and take a Long position.
Typically, on a Gap Down, the trader would wait for the price to re-enter the Gap, and take a Short position.
We found that simply trading through the Gaps (fill the gap) produced a better result. So we reversed the procedure and the colors to show our suggested direction.
We have added inputs so the trader can determine the size of the Gaps to be plotted on the chart. A minimum and maximum can be set.
The number of Gaps to be displayed can be adjusted.
There is a option to remove Gaps that had been filled, to help keep a clean chart.
Search in scripts for "gaps"
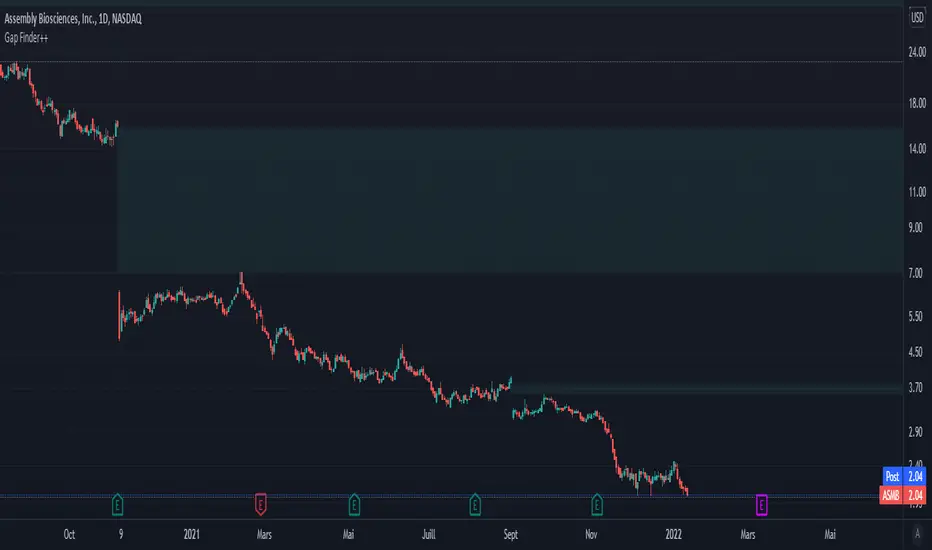
Customizable Gap Finder++█ OVERVIEW
Customizable Gap Finder by ProfessorZoom with a partial close of a gap
█ CONCEPTS
1 — Gaps bullish or bearish
2 — Gaps can be filled
3 — Gaps can be partially close
4 — Some display options
█ OTHER SECTIONS
Thanks to The rational investor for teaching me this and ProfessorZoom because he writes 99% of the script.
Did you know the percentage of gaps filled ? If not, I recommand you to follow his courses, and I have no conflicts of interest.
New Day Opening Gaps (1m 3:29-9:15)Precise Day Opening Gap IndicatorThis custom Pine Script indicator is designed for traders who rely on high-precision gap analysis, particularly for markets like the NSE/BSE.🎯 Core Functionality: Precision Gap IdentificationThis indicator calculates and highlights the exact price gap between the previous day's close and the current day's open. Unlike standard gap analysis that relies on higher timeframes, this script ensures accuracy by strictly using 1-minute data:Previous Close: Captured from the 1-minute candle closing at 3:29 PM (15:29).Current Open: Captured from the 1-minute candle opening at 9:15 AM (09:15).The resulting gap zone is plotted and automatically extends to the right, serving as a critical level for current price interaction.✨ Key Features1. Cross-Timeframe PersistenceThe gap markings are calculated based on the 1-minute chart but are displayed correctly and persist across all timeframes, including 5-minute, 15-minute, 1-hour, and even the Daily chart, ensuring consistency no matter how you analyze the price action.2. Controlled Historical ViewAvoid chart clutter with the "Number of Gaps to Show" input. Easily control how many historical day-opening gaps you want to display on your chart, allowing you to focus only on the most recent and relevant levels.3. Full CustomizationCustomize the look and feel to fit your charting style:Gap Zone: Adjust the color and opacity (transparency) of the gap box.Date Label: Toggle the date label display on/off and control its color, background, opacity, and size. The label is optimally placed at the top-right of the gap zone for clear visibility.🛠️ Recommended UseThis tool is perfect for intraday traders looking to:Identify immediate support and resistance zones based on overnight price action.Track where price action reacts to prior day gaps (filling or holding the gap).Maintain a clear visual reference of daily market openings.

Simple ICT Order Blocks and Fair Value Gaps by Gowtham KannakajeThis scripts identifies ICT Order Block and ICT Fair Value Gaps
Fair Value Gap:
- Fair Value Gap toggle is off by default
- Users can choose to color the bars having Fair Value Gaps or can select to define the Fair Value Gap using boxes.
- Bar color and box colors can be customized
Order Blocks:
- Order Block box and candle color toggle is on by default
- Users can choose to color the Order Block candles or can select to define the Order Blocks using boxes.
- Bar color and box colors can be customized for bullish and bearish Order Block separately
Note:
- Order Blocks are considered valid only if the candle forming the Fair Value Gap closes away from the Order Block.
- Since Trading View limits the number of boxes to 500, it is advised to use the Color Candle option to identify the Order Blocks or Fair Value Gaps which are very old.
New concept Definitions:
Naked OB : An order block whose immediate next candle forms a Fair Value Gap. Here, the Order Block high or low contributes to the formation of Fair Value Gap.
Covered OB : An order block whose immediate next candle doesn't form a Fair Value Gap. Here, the Order Block high or low doesn't contribute to the formation of Fair Value Gap. Instead it will have other candles in between the Order Block and Fair Value Gap.
Disclaimer: The usage of this indicator might or might not contribute to your profits and losses and the author is not responsible for the same.
Happy Trading.

ICT Opening Gaps [MK]
The indicator plots levels which can act as magnets to price. The levels are gap areas which are used within the ICT (The Inner Circle Trader) trading system.
The indicator plots 5 areas of interest:
1: Daily Volume Imbalances - Referencing the Daily chart, boxes are calculated from close to open between all candles. Candles which have only 'wicks' between the close and open prices are considered 'volume imbalances. The boxes can then be shown on LTFs to aid in decision making for intraday traders. Imbalances can be limited to a maximum amount shown and mitigated imbalances can be removed from the chart. All colors can be customised.
Volume Imbalance example:
2: NWOG - New Week Opening Gap - Plotted from Friday Close at 1659 to Sunday Opening at 1800 (EST). The current NWOG can be displayed on its own, or previous weeks can also be shown (ICT recommends the previous 4 weeks also). Boxes are plotted with a midline and all colors can be customised.
New Week Opening Gaps example:
3. NDOG - New Day Opening Gaps - Plotted from day close at 1659 (EST) to restart at 1800 (EST). All colors can be customised. These gaps can be very small so line widths of 3+ are recommended if the lines are to be seen on HTFs
New Day Opening Gap example:
4. New Opening Gap - Plotted from close at 1659 to Session open at 0930 (EST). These areas can possibly be closed/filled after opening at some time. The indicator will draw box to the right of price which shows if the Opening Gap is UP or DOWN. The box will change color to show up or down, or text alone can be used instead of the box. All colors can be customised.
New Opening Gap Box example:
5. 0930 Opening Line - Draws a horizontal line from the opening price at 0930 (EST) to the last bar on the chart. This is the level used to calculate the New Opening Gap. All colors can be customised.
0930 Opening Line example:

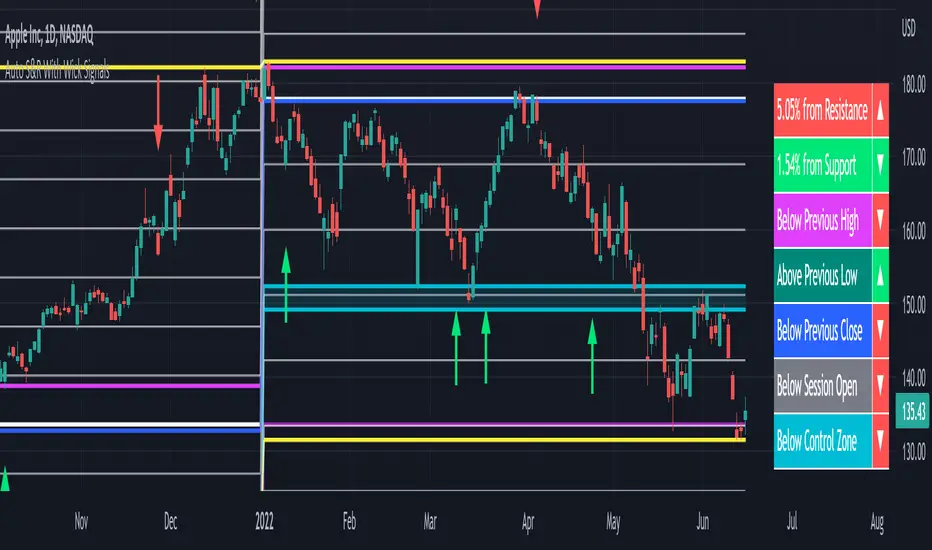
Auto Support & Resistance With Wick Signals & Percentage GapsThis auto support and resistance indicator uses percentage deviations from the previous session close to calculate levels. It provides arrows as signals when it detects 2 wicks in the last 5 bars from a support or resistance level. Includes alerts for price crossing any level as well as real time percentage gaps from current price to the next closest support and resistance level. You also have the option to set up to 3 major levels of your own for any levels that are very important on longer timeframes that you want included. Those will show on the chart as well as within your percentage gap table with color coded background. All features can be customized or turned off to suit your preferences.
SOURCE
This indicator uses the previous session close as a source by default but can be adjusted to use the previous session high or the previous session low. I find the close setting to provide the most accurate levels.
SESSION
The default setting for the previous session used is the daily session but can be adjusted to use the daily, weekly, monthly, quarterly or yearly session. Use longer sessions when looking at longer time frame charts.
SIGNALS
The signals by default are set to only show an arrow if there have been 2 bullish or bearish wicks off of a support or resistance level in the last 5 bars. This can be changed to one bullish wick off of support and one bearish wick off of resistance or it can be set to give a signal anytime a bar crosses a support or resistance level. This can be controlled in the indicator settings.
PERCENTAGE DEVIATION LEVELS
The default percentage deviation is set to 1% but can and should be adjusted according to whatever ticker you are using. For example use .25% or .5% when looking at forex intraday charts since they are not as volatile as other markets. For leveraged etfs used 1% multiplied by the leverage on the etf, so for SQQQ use 3% as it is a 3x leveraged etf. When looking at longer timeframes or highly volatile charts, set the percentage deviation to 2%, 5%, 10%, etc.
LINE COLORS
The color of the lines will change from red to green depending on if the price is above or below that level. You can customize these colors in the settings.
MAJOR LEVELS
If you have major levels of support and resistance from longer timeframes and your own charting, you can add up to 3 major levels that will show on the chart as well as show the percentage gaps in the table. The label for each major level will be colored to match the color of the line on the chart individually.
PERCENTAGE GAP TABLE
The gap table will update live with percentages to go from current price to the next closest support and resistance levels so you don’t have to calculate them manually. The position of the percentage gap table can also be changed within the indicator settings.
TURN FEATURES ON/OFF
There are 3 toggle switches so you can easily turn on or off certain features such as: the support and resistance lines, the percentage gaps table and the arrow signals.
LINE WIDTHS
You can also set the line width of all levels and the line width of the starting level within the indicator settings.
***MARKETS***
This indicator can be used as a signal on all markets, including stocks, crypto, futures and forex.
***TIMEFRAMES***
This automatic support and resistance indicator can be used on all timeframes as long as there is enough data for the session used.
***TIPS***
Try using numerous indicators of ours on your chart so you can instantly see the bullish or bearish trend of multiple indicators in real time without having to analyze the data. Some of our favorites are our Volume Spike Scanner, Volume Profile, Momentum and Trend Friend in combination with this auto support and resistance indicator. They all have real time Bullish and Bearish labels as well so you can immediately understand each indicator's trend.
Cash Gaps on a Future/CFD-ChartThe script is based on the great work of @NgUTech which very nicely prints the gaps on any given chart.
The purpose of this script is to show the gaps to futures or cfd of the underlying cash chart, because very often gap closing provides an opportunity to fade the move.
The script works in the way that the user provides the underlying chart symbol and the current spread of the instruments (cash-future/cfd) and it draws boxes where the cash-gaps are.
If you know a way to automatically calculate the spread of the two instruments, please let me know, thanks.
Michael

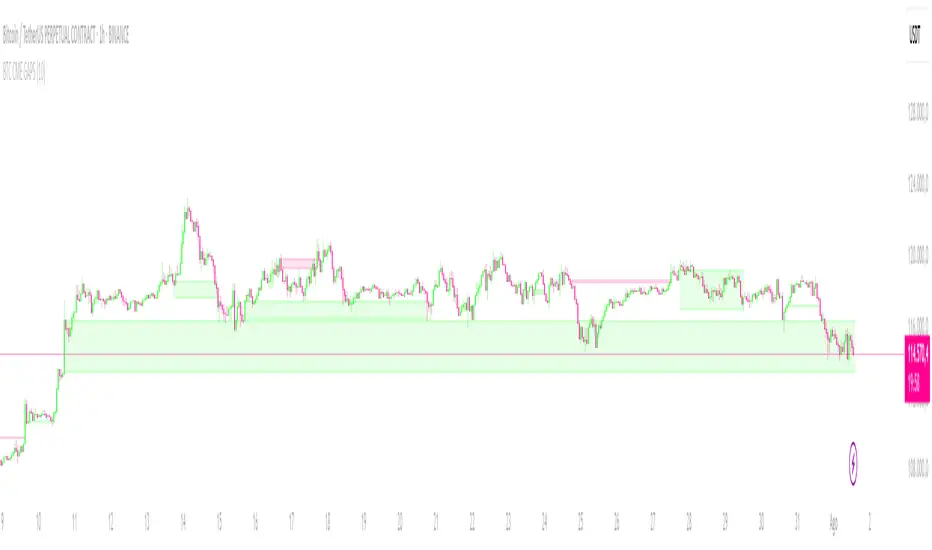
Bitcoin CME Gaps [NeoButane]Simple script that checks for gaps in price from CME. tickerid(x, y, sess) doesn't seem to be applying correctly for the ticker specified at the moment so there are a couple of 'gaps' peppered on lower timeframes.
Gaps are legitimate price levels to look as a support or resistance. The theory is that volume needs to be gap filled, but I currently believe it's an easy entry/exit trade for those who can move the market. I don't think there is sound analysis behind the why, but it is real.

VYW GapsThis is a copy of the built-in Gaps indicator with the addition of drawing untouched close prices as well.
By default the lines are drawn as dashed orange lines.

ORB + Fair Value Gaps (FVG/iFVG) Suite with Daily 50% MidlineA complete smart-money–focused price-action toolkit combining the New York Open Range Breakout (ORB), ICT-style Fair Value Gaps, Inverted FVGs, and a dynamic Daily 50% Midline.
Designed for traders who want a clean, fast, and highly visual way to track liquidity, imbalances, and intraday directional bias.
📌 Key Features
1. NY Session ORB (09:30–09:45 New York Time)
Automatically plots:
ORB High
ORB Low
Labels for ORB high/low
Optional 5-minute chart restriction
Lines extend forward for easy reference
Used to identify breakout conditions, liquidity sweeps, and directional bias into the morning session.
📌 2. ICT-Style Fair Value Gaps (FVGs)
Full automated detection of bullish & bearish FVGs based on the classic 3-candle displacement structure:
Bullish FVG: high < low
Bearish FVG: low > high
Each FVG is drawn as a box with:
Custom colour
Custom border style (solid, dashed, dotted)
Automatic extension to the right until filled
Optional size text showing the gap in points (font size/colour adjustable)
Adjustable max lookback for performance
📌 3. Inverted FVGs (iFVGs)
Once price fully fills an FVG, it automatically becomes an iFVG, shown with:
Custom iFVG colour
Custom border style
Extension to the right
Once price trades through the zone from the opposite side, the iFVG is considered “consumed” and:
It stops extending
And optionally auto-deletes based on user settings
This makes it easy to track meaningful imbalances that turn into liquidity pockets.
📌 4. “Show Only After ORB” Filter
Optionally hide all FVGs/iFVGs formed before the ORB completes.
This is especially useful for intraday strategies focused on NY session structure only.
📌 5. Daily 50% Midline (OHLC Midpoint)
A dynamic, always-updating midpoint of the current daily candle:
Mid = (Daily High + Daily Low) / 2
Features:
Custom colour
Dashed styling
Extends left and right as a horizontal ray
Updates live as the daily candle forms
Great for bias filters, mean reversion, and daily liquidity zones.
📌 6. Performance-Optimized (Fast!)
Built with:
Fully configurable max lookback
Memory-efficient arrays
Auto-cleaning of old FVG/iFVG objects
Lightweight daily midline recalculation
This allows extremely fast rendering even on 1-minute charts.
📌 7. Alerts
Includes a clean alert condition:
Price returned to a Fair Value Gap
Works for both bullish and bearish FVG revisits.
🎯 Who This Indicator Is For
This tool is ideal for traders who use:
ICT / SMC concepts
Liquidity-based trading
ORB strategies
Imbalance-driven price action
Intraday or NY session-focused setups
Futures, crypto, forex, and equities
🎁 Summary
This indicator gives you:
A clean ORB framework
Automatic, dynamic FVG and iFVG analysis
Real-time daily candle context
Customizable visuals
Powerful session filtering
Efficient performance
All in one clean, intuitive package built for real-time decision making.

CRYPTO CME GAPS- Can be used in any crypto symbol of any exchange, (not necessarily the CME exchange)
- Displays the CME gaps with the colors green or red depending on the sentiment of the gap
- Extends the gaps displayed until they are filled.
- In the end of the code there are the boolean values 'filled_bull' and 'filled_bear' that can be used to create a strategy script.
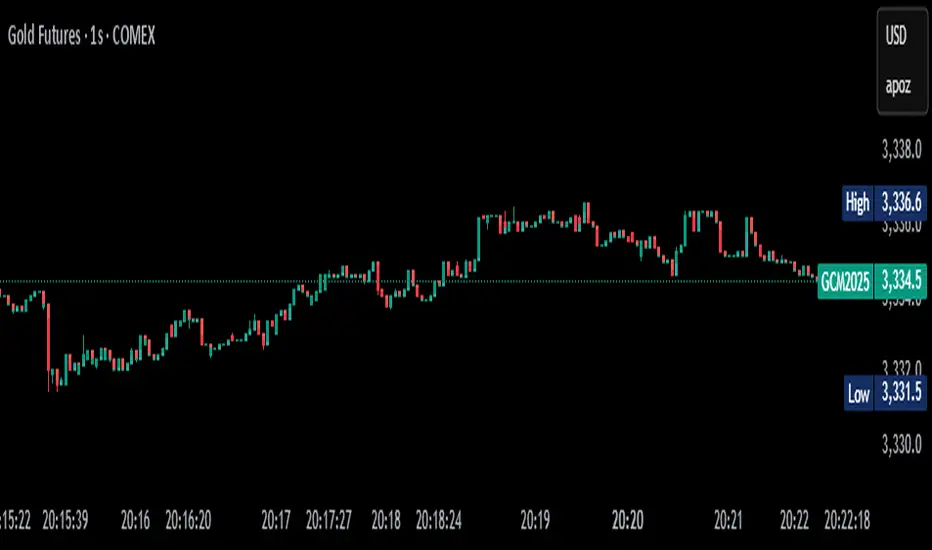
No Gaps - JizzanyNo Gaps – Jizzany
Fill the blanks. Own the patterns.
Don’t let thin futures feeds or blazing-fast 1 s bars break your flow—this overlay stitches every missing pixel back into your chart so you can:
🔍 Analyze low-liquidity markets (futures, exotic FX, crypto alt-pairs) without awkward jumps
⏱️ Trade ultra-low timeframes (1 s, tick charts) with full confidence in every wick
📈 Spot price patterns seamlessly, even when your broker’s feed skips a beat
How it works: Auto-detects gaps between sessions or feeds, then draws miniature candles from the prior close to the current open—using real intrabar highs/lows—so nothing ever goes unseen.
Perfect for scalpers, day traders, and anyone who demands continuity in every bar. Try it on your next chart and rediscover the story in every candle.
Turn This
Into This
This
Into
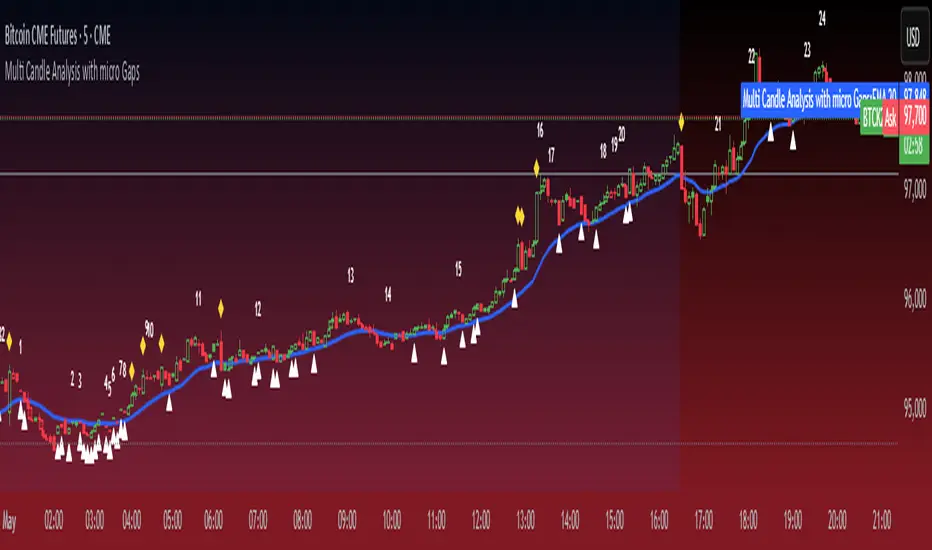
Micro Gaps DetectorSimple Micro Gap Indicator: A Technical Analysis Tool
The Simple Micro Gap Indicator is a specialized momentum indicator designed to identify and analyze micro gaps between consecutive candlesticks in financial charts. Unlike traditional gap analysis that focuses on larger price gaps, this indicator specifically targets smaller, less noticeable spaces between candles.
Key Features:
Detects minimal price disparities between consecutive candlesticks
Helps identify potential short-term momentum shifts
Useful for high-frequency trading and scalping strategies
Functions as a momentum indicator for short-term price movements
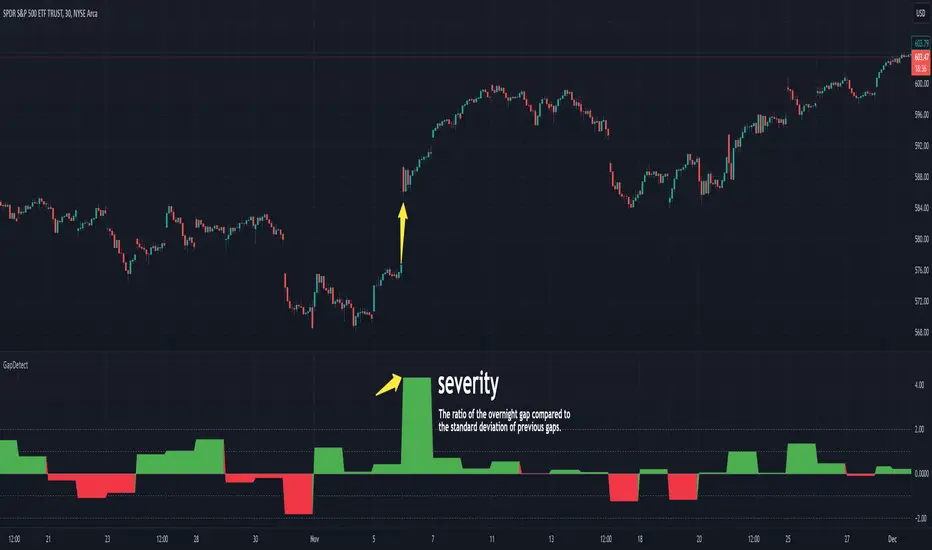
GapDetectGap Severity Analysis Library
This library, GapDetect , simplifies the identification and evaluation of overnight gaps by leveraging statistical metrics such as standard deviation and percentage moves. It is ideal for detecting large abnormal gaps which may be used to modify how strategies may decide to enter or exit.
Key Features:
Overnight Gap Detection
Provides two core functions:
today : Computes the value of today's overnight gap.
todayPercent : Computes the percentage change for today's overnight gap.
Volatility Analysis
Includes functions for statistical gap analysis:
normal : Calculates the normal daily standard deviation of the overnight gap, filtering outliers using customizable thresholds.
normalPercent : Similar to normal , but for percentage-based gap moves.
Gap Severity Metric
severity : a positive or negative value that represents the ratio of the current overnight move compared to the standard deviation of previous ones.
Customizable Parameters
Supports custom session specifications, resolutions, and outlier thresholds.
Inversion Fair Value Gaps [TradingFinder] IFVG ICT Signal| Alert🔵 Introduction
🟣 Inversion Fair Value Gap (IFVG)
An ICT Inversion Fair Value Gap, or reverse FVG, occurs when a fair value gap fails to hold its price, resulting in the price moving beyond and breaking the gap. This situation marks the initial change in price momentum.
Generally, prices respect fair value gaps and continue in their trend direction. However, when a fair value gap is breached, it transforms into an inversion fair value gap, signaling a potential short-term reversal or a subsequent change in direction.
🔵 How to Use
🟣 Identifying an Inversion Fair Value Gap
To spot an IFVG, you must first identify a fair value gap.
Inversion fair value gaps can be categorized into two types :
🟣 Bullish Inversion Fair Value Gap
A bullish IFVG occurs when a bearish fair value gap is invalidated by the price closing above it.
Steps to identify it :
Identify a bearish fair value gap.
When the price closes above this gap, it becomes a bullish inversion fair value gap.
This gap acts as a support level, pushing the price upwards and indicating a shift in momentum from sellers to buyers.
🟣 Bearish Inversion Fair Value Gap
A bearish IFVG happens when a bullish fair value gap fails, with the price closing below it.
Steps to identify it :
Identify a bullish fair value gap.
When the price closes below this gap, it becomes a bearish inversion fair value gap.
This gap acts as a resistance level, pushing the price downwards and indicating a shift in momentum from buyers to sellers.
🔵 Settings
🟣 Global Settings
Show All Inversion FVG: If disabled, only the most recent FVG will be displayed.
IFVG Validity Period (Bar): Determines the maximum duration (in number of candles) that the FVG and IFVG remain valid.Switching Colors Theme Mode: Includes three modes: "Off", "Light", and "Dark". "Light" mode adjusts colors for light mode use, "Dark" mode adjusts colors for dark mode use, and "Off" disables color adjustments.
🟣 Logic Settings
FVG Filter : This refines the number of identified FVG areas based on a specified algorithm to focus on higher quality signals and reduce noise.
Types of FVG filters :
Very Aggressive Filter : Adds a condition where, for an upward FVG, the last candle's highest price must exceed the middle candle's highest price, and for a downward FVG, the last candle's lowest price must be lower than the middle candle's lowest price. This minimally filters out FVGs.
Aggressive Filte r: Builds on the Very Aggressive mode by ensuring the middle candle is not too small, filtering out more FVGs.
Defensive Filter : Adds criteria regarding the size and structure of the middle candle, requiring it to have a substantial body and specific polarity conditions, filtering out a significant number of FVGs.
Very Defensive Filter : Further refines filtering by ensuring the first and third candles are not small-bodied doji candles, retaining only the highest quality signals.
Mitigation Level FVG and IFVG : Options include "Proximal", "Distal", or "50 % OB" modes, which you can choose based on your needs. The "50 % OB" line is the midpoint between distal and proximal.
🟣 Display Settings
Show Bullish IFVG : Toggles the display of demand-related boxes.
Show Bearish IFVG : Toggles the display of supply-related boxes.
🟣 Alert Settings
Alert Inversion FVG Mitigation : Enables alerts for Inversion FVG mitigation.
Message Frequency : Determines the frequency of alerts. Options include 'All' (every function call), 'Once Per Bar' (first call within the bar), and 'Once Per Bar Close' (final script execution of the real-time bar). Default is 'Once per Bar'.
Show Alert Time by Time Zone : Configures the time zone for alert messages. Default is 'UTC'.
Display More Info : Provides additional details in alert messages, including price range, date, hour, and minute. Set to 'Off' to exclude this information.

Fair Value Gaps Mitigation Oscillator [LuxAlgo]The Fair Value Gaps Mitigation Oscillator is an oscillator based on the traditional Fair Value Gaps (FVGs) imbalances. The oscillator displays the current total un-mitigated values for the number of FVGs chosen by the user.
The indicator also displays each New FVG as a bar representing the current ratio of the New FVG in relation to the current un-mitigated total for its direction.
🔶 USAGE
When an FVG forms, it is often interpreted as strong market sentiment in the direction of the gap. For example, an upward FVG during an uptrend is typically seen as a confirmation of the strength and continuation of the trend, as it indicates that buyers are willing to purchase at higher prices without much resistance, suggesting strong demand and positive sentiment.
By analyzing the mitigation (or lack thereof), we can visualize the increase of directional strength in a trend. This is where the proposed oscillator is useful.
🔶 DETAILS
The oscillator's values are expressed as Percentages (%). Each FVG is allocated 100% of the total of its width with a max potential value of 100 and minimum potential value of 0.
Based on the "FVG Lookback" Input, the FVGs are scaled to fit within the range of +1 to -1. Using a higher "FVG Lookback" value will allow you to get indications of longer-term trends.
A higher value of the normalized bullish FVG areas suggest a stronger and cleaner uptrend, while lower values of the bearish the normalized bullish FVG areas suggest a stronger and cleaner downtrend.
+1 or -1 indicates that there is a Full Lookback of FVGs, and each one is fully un-mitigated, and the opposite direction of FVGs is entirely Mitigated.
When the price closes over/under or within an FVG it begins to get mitigated, when this happens the % of mitigation is subtracted from the total.
When a New FVG is formed, a Histogram bar is created representing the ratio of the current FVG's width to the total width off all un-mitigated FVGs.
The entire bar represents 100% of total un-mitigated FVG Width.
The filled area represents the current FVG's width relative to the whole.
A 50% hash mark is also displayed for reference.
🔶 SETTINGS
FVG Lookback - Determines the number of FVGs (Bullish and Bearish Pairs) to keep in memory for analysis.

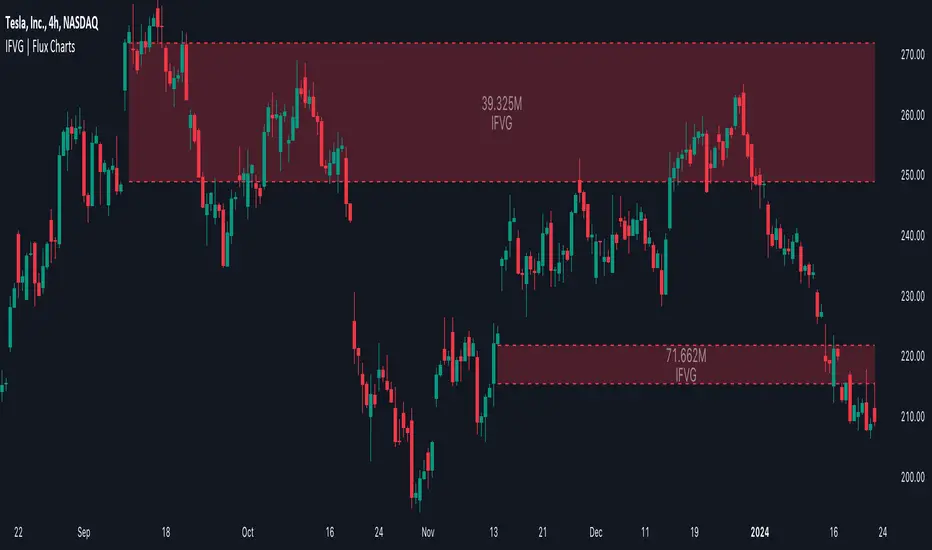
Fibonacci Inversion Fair Value Gaps | Flux Charts💎 GENERAL OVERVIEW
Introducing our new Fibonacci Inversion Fair Value Gaps (IFVG) indicator! Inverse Fair Value Gaps occur when a Fair Value Gap becomes invalidated. They reverse the role of the original Fair Value Gap, making a bullish zone bearish and vice versa. This indicator plots the Fibonacci retracement levels of the IFVG, which often act like support & resistance levels.
Features of the new Fibonacci IFVGs Indicator :
Renders Bullish / Bearish IFVG Zones
Renders Fibonacci Retracement Levels Of IFVGs
Combination Of Overlapping FVG Zones
Variety Of Zone Detection / Sensitivity / Filtering / Invalidation Settings
High Customizability
🚩UNIQUENESS
This indicator stands out with its ability to render up to 3 Fibonacci retracement levels of IFVGs. Fibonacci retracement levels are widely used within trading, and we wanted to implement them for IFVG zones. You can also customize the FVG Filtering method, FVG & IFVG Zone Invalidation, Detection Sensitivity etc. according to your needs to get the best performance from the indicator.
📌 HOW DOES IT WORK ?
A Fair Value Gap generally occur when there is an imbalance in the market. They can be detected by specific formations within the chart. An Inverse Fair Value Gap is when a FVG becomes invalidated, thus reversing the direction of the FVG.
This indicator renders 0.618, 0.5 and 0.382 (can be changed from the settings) Fibonacci retracement levels of the IFVGs, which often act as support and resistances. Check this example :
⚙️SETTINGS
1. General Configuration
FVG Zone Invalidation -> Select between Wick & Close price for FVG Zone Invalidation.
IFVG Zone Invalidation -> Select between Wick & Close price for IFVG Zone Invalidation. This setting also switches the type for IFVG consumption.
Zone Filtering -> With "Average Range" selected, algorithm will find FVG zones in comparison with average range of last bars in the chart. With the "Volume Threshold" option, you may select a Volume Threshold % to spot FVGs with a larger total volume than average.
FVG Detection -> With the "Same Type" option, all 3 bars that formed the FVG should be the same type. (Bullish / Bearish). If the "All" option is selected, bar types may vary between Bullish / Bearish.
Detection Sensitivity -> You may select between Low, Normal or High FVG detection sensitivity. This will essentially determine the size of the spotted FVGs, with lower sensitivies resulting in spotting bigger FVGs, and higher sensitivies resulting in spotting all sizes of FVGs.
Show Historic Zones -> If this option is on, the indicator will render invalidated IFVG zones as well as current IFVG zones. For a cleaner look at current IFVG zones which are not invalidated yet, you can turn this option off.
2. Fibonacci Retracement Levels
You can enable / disable up to 3 different Fibonnaci Retracement levels at this group of settings. You can also switch their line styles between solid, dashed and dotted as well as changing their colors.

Inversion Fair Value Gaps (IFVG) [LuxAlgo]The Inversion Fair Value Gaps (IFVG) indicator is based on the inversion FVG concept by ICT and provides support and resistance zones based on mitigated Fair Value Gaps (FVGs).
🔶 USAGE
Once mitigation of an FVG occurs, we detect the zone as an "Inverted FVG". This would now be looked upon for potential support or resistance.
Mitigation occurs when the price closes above or below the FVG area in the opposite direction of its bias.
Inverted Bullish FVGs Turn into Potential Zones of Resistance.
Inverted Bearish FVGs Turn into Potential Zones of Support.
After the FVG has been mitigated, returning an inversion FVG, a signal is displayed each time the price retests an IFVG zone and breaks below or above (depending on the direction of the FVG).
Keep in mind how IFVGs are calculated and displayed. Once price mitigates an IFVG, all associated graphical elements such as areas, lines, and signals will be deleted.
This indicator is not meant to be just a 'signal indicator'. Backtesting historical signals is incorrect as it does not consider the mitigation of IFVGs, which is a standard method for trading IFVGs & various concepts by ICT.
The signals displayed are meant for real-time analysis of current bars for discretionary analysis. Current confirmed retests of unmitigated IFVGs are still displayed to show which IFVGS have had significant reactions.
🔶 SETTINGS
Show Last: Specifies the number of most recent FVG Inversions to display in Bullish/Bearish pairs, starting at the current and looking back. Max 100 Pairs.
Signal Preference: Allows the user to choose to send signals based on the (Wicks) or (Close) Prices. This can be changed based on user preference.
ATR Multiplier: Filters FVGs based on ATR Width, The script will only detect Inversions that are greater than the ATR * ATR Width.
🔶 ALERTS
This script includes alert options for all signals.
🔹 Bearish Signal
A bearish signal occurs when the price returns to a bearish inversion zone and rejects to the downside.
🔹 Bullish Signal
A bullish signal occurs when the price returns to a bullish inversion zone and bounces out of the top.

Inversion Fair Value Gaps | Flux Charts💎 GENERAL OVERVIEW
Introducing our new Inversion Fair Value Gaps (IFVG) indicator! Inversion Fair Value Gaps occur when a Fair Value Gap becomes invalidated. They reverse the role of the original Fair Value Gap, making a bullish zone bearish and vice versa. With this indicator, you can now see the volume of the bar that invalidated the FVG, which is also the bar that IFVG occurred. For more information about the process, read the " HOW DOES IT WORK " section of the description.
Features of the IFVG Indicator :
Render Bullish / Bearish IFVG Zones
See The Occurrence Volume Of The IFVG Zones
Combination Of Overlapping FVG Zones
Variety Of Zone Detection / Sensitivity / Filtering / Invalidation Settings
High Customizability
🚩UNIQUENESS
This indicator stands out with its ability to render the occurrence volume of IFVGs. Also the ability to combine overlapping FVG zones will result in cleaner charts for traders. You can customize the FVG Filtering method, FVG & IFVG Zone Invalidation, Detection Sensitivity etc. according to your strategy to get the best performance from the indicator.
📌 HOW DOES IT WORK ?
A Fair Value Gap generally occur when there is an imbalance in the market. They can be detected by specific formations within the chart. An Inversion Fair Value Gap is when a FVG becomes invalidated, thus reversing the direction of the FVG.
⚙️SETTINGS
1. General Configuration
FVG Zone Invalidation -> Select between Wick & Close price for FVG Zone Invalidation.
IFVG Zone Invalidation -> Select between Wick & Close price for IFVG Zone Invalidation.
Zone Filtering -> With "Average Range" selected, algorithm will find FVG zones in comparison with average range of last bars in the chart. With the "Volume Threshold" option, you may select a Volume Threshold % to spot FVGs with a larger total volume than average.
FVG Detection -> With the "Same Type" option, all 3 bars that formed the FVG should be the same type. (Bullish / Bearish). If the "All" option is selected, bar types may vary between Bullish / Bearish.
Detection Sensitivity -> You may select between Low, Normal or High FVG detection sensitivity. This will essentially determine the size of the spotted FVGs, with lower sensitivies resulting in spotting bigger FVGs, and higher sensitivies resulting in spotting all sizes of FVGs.
Show Historic Zones -> If this option is on, the indicator will render invalidated IFVG zones as well as current IFVG zones. For a cleaner look at current IFVG zones which are not invalidated yet, you can turn this option off.
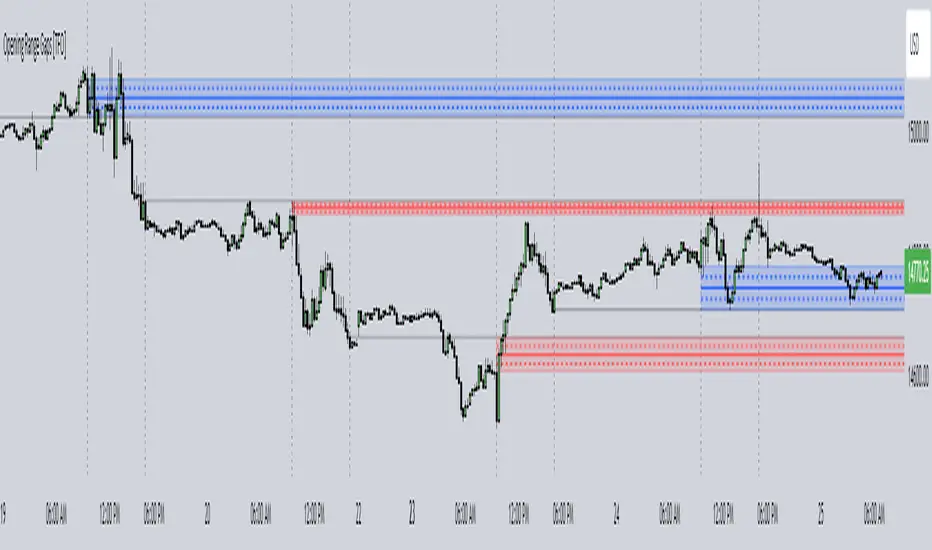
Opening Range Gaps [TFO]This indicator displays Opening Range Gaps with an adjustable time window. Its intention is to capture the discrepancy between the close price of previous and new Real Trading Hours (RTH) sessions, i.e. yesterday's close compared to today's open. A gap will be drawn from this area with a solid line denoting its midpoint, and dashed lines denoting the upper and lower quartiles of its range. Its color is determined by whether the new session open price is above or below the previous session close.
The Gap Session parameter allows users to define the specific time window for which to capture the "gap" in price. Using U.S. index futures as an example, we can use 16:00 - 09:30 (EST) to capture the discrepancy between the previous day's close price and the current day's open price. However, this parameter is left as adjustable for users that may want to observe different markets or simply experiment with different time windows.
Show Session Delineations will draw vertical timestamps denoting the start and end times of the provided Gap Session. Track Start Price serves as a visual aid to track the initial price of the Gap Session until its end price is validated, for easy visual verification of a gap's upper and lower bounds. With both options turned off, the indicator will only display the gap boxes and lines, as shown here:
Extend Boxes will draw all gaps with an indefinite extension to the right. This can get messy with a large number of boxes, which is why we have a Keep Last parameter to limit how many sessions' drawings should be stored. Any drawings that were made beyond this number of sessions in the past will automatically be deleted.
The Timeframe Limit will dictate that the indicator as a whole will only draw objects on timeframes less than or equal to this timeframe, determined by the user. In some cases this may help users avoid resolution errors which may arise from using timeframes that are too large for a given session. For example, if a user wanted to track a Gap Session of 16:15-09:30, the Timeframe Limit should be set to 15 minutes because the close price at 16:15 cannot be observed on a 30 minute chart (or greater).
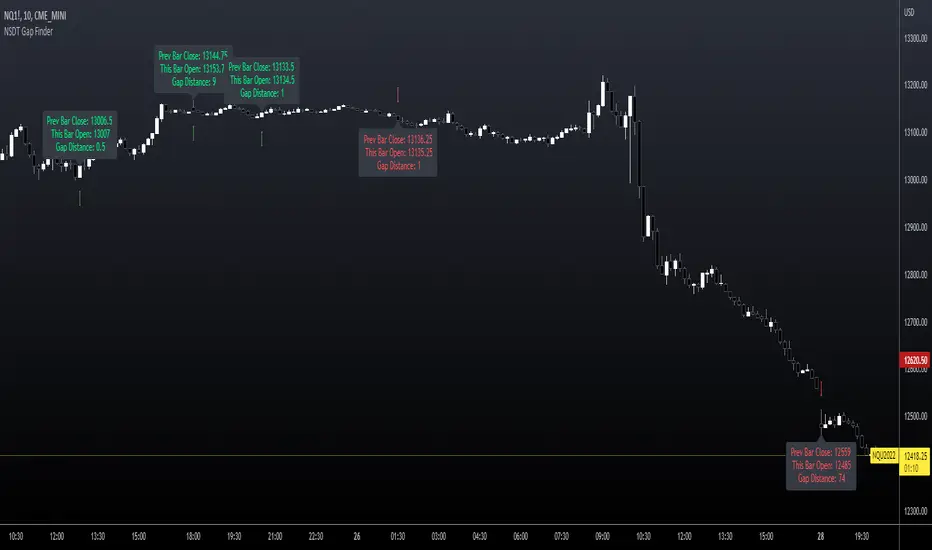
NSDT Gap FinderThis script plots gaps between candles.
It uses the "round_to_mintick" feature in the Pinescript code, so it works on any instrument out to 3 decimal places.
If there is a Gap Up (open of current candle is greater than the close of previous candle) it will plot a green arrow under the current candle and plot a label above the current candle to show the Gap Amount.
If there is a Gap Down (open of current candle is less than the close of previous candle) it will plot a red arrow over the current candle and plot a label below the current candle to show the Gap Amount.
You can turn the label and/or the arrow on and off.
I created this indicator to more easily identify gaps in the market. The probability of a gap being filled is extremely high. Some are right away (intraday candle to candle), some take a while (gap from previous day close to current day open), and some make take a long time (close at end of previous week to open at beginning of current week).
This is published free to use and open source code.
Please see my other similar Gap Indicators.
Daily Gap Range
USA Session - Previous Day Close Gap to Current Day Open
Oxy CandlestickOxymoronic (oxy) candlesticks often appear at significant levels in a chart and can indicate increased probabilities of directional moves.
Typically, green candles are hollow and red candles are filled. An oxymoronic candle is colored bullishly but filled bearishly (solid green) or vice versa (hollow red).
Oxy flags occur when:
1) Price gaps up and closes lower than the open but above the last close. A solid green (or black) candle is bearish.
2) Price gaps down and closes higher than the open but below the last close. A hollow red candle is bullish.
An oxy candle indicates one of three things:
1) Price is going up (bullish oxy)
2) Price is going down (bearish oxy)
3) Price will return to this level (either)
#1 and #2 are the default meaning. If those don't play out then look for #3.
As is the case with most indicators, it is best not to use this indicator in isolation, but to combine it with other forms of analysis to increase your probabilities and to identify significant levels.

Fractal Break Imbalance / Fair Value Gap (FVG) / Liquidity VoidFractal Break Imbalance / Fair Value Gap (FVG) / Liquidity Void
Order imbalances in either direction, either excess buy or sell orders, reduce liquidity. The market will seek to fill gaps sooner or later. The script marks an imbalance / FVG after a fractal break. It also marks any other imbalance.
Default Colours:
Green - Imbalance after fractal break to the upside
Red - Imbalance after fractal break to the downside
Yellow - Other imbalances
How To Use:
Gaps can be used to determine possible entries and targets. Those familiar with liquidity raids, supply and demand, and ICT concepts may realise it's potential.
Indicator in use:
