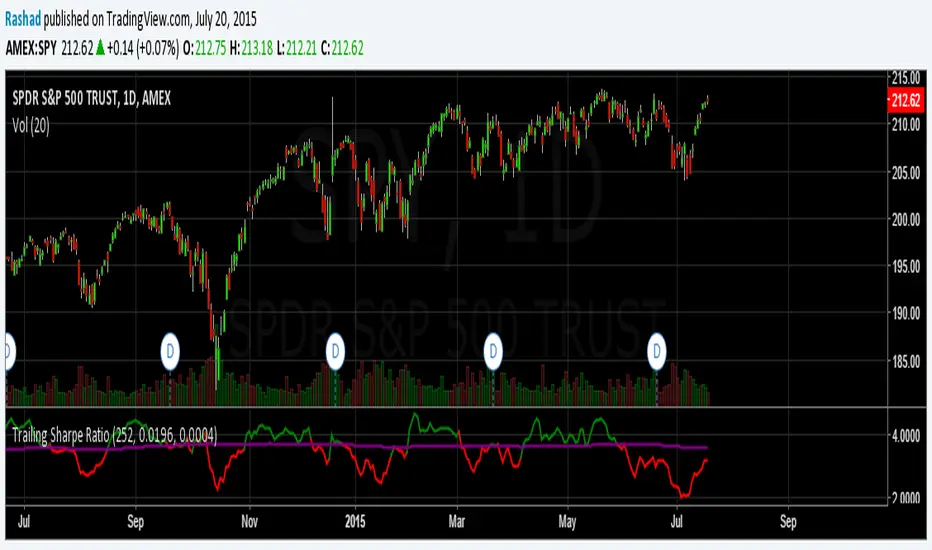
Trailing Sharpe RatioThe Sharpe ratio allows you to see whether or not an investment has historically provided a return appropriate to its risk level. A Sharpe ratio above one is acceptable, above 2 is good, and above 3 is excellent. A Sharpe ratio less than one would indicate that an investment has not returned a high enough return to justify the risk of holding it. Interesting in this example, SPY's one year avg Sharpe ratio is above 3. This would mean on average SPY returns 3x better returns than the risk associated with holding it, implying there is some sort of underlying value to the investment.
When the sharpe ratio is above its signal, this implies the investment is currently outperforming compared to its typical return, below the signal means the investment is currently under performing. A negative Shape would mean that the investment has not provided a positive return, and may be a possible short candidate.
Search in scripts for "ha溢价率"
Zweig Market Breadth Thrust Indicator [LazyBear]The Breadth Thrust (BT) indicator is a market momentum indicator developed by Dr. Martin Zweig. According to Dr. Zweig a Breadth Thrust occurs when, during a 10-day period, the Breadth Thrust indicator rises from below 40 percent to above 61.5 percent.
A "Thrust" indicates that the stock market has rapidly changed from an oversold condition to one of strength, but has not yet become overbought. This is very rare and has happened only a few times. Dr. Zweig also points out that most bull markets begin with a Breadth Thrust.
All parameters are configurable. You can draw BT for NYSE, NASDAQ, AMEX or based on combined data (i.e., AMEX+NYSE+NASD). There is also a "CUSTOM" mode supported, so you can enter your own ADV/DEC symbols.
More info:
Definition: www.investopedia.com
A Breadth Thrust Signal: www.mcoscillator.com
A Rare "Zweig" Buy Signal: www.moneyshow.com
Zweig Breadth Thrust: recessionalert.com
List of my public indicators: bit.ly
List of my app-store indicators: blog.tradingview.com

KK_Traders Dynamic Index_Bar HighlightingHey guys,
this is one of my favorite scripts as it represents a whole trading system that has given me very good results!
I have only used it on Bitcoin so far but I am sure it will also work for other instruments.
The original code to this was created by LazyBear, so all props to him for this great script!
I have linked his original post down below.
You can find the full rules to the system in this PDF (which has also been taken from LBs post):
www.forexmt4.com
Here is a short summary of the rules:
Go long when (all conditions have to be met):
The green line is above 50
The green line is above the red line
The green line is above the orange line
The close is above the upper Band of the Price Action Channel
The candles close is above its open
(The green line is below 68)
Go short when (all conditions have to be met):
The green line is below 50
The green line is below the red line
The green line is below the orange line
The close is below the lower band of the Price Action Channel
The candles close is below its open
(The green line is above 32)
Close when:
Any of these conditions aren't true anymore.
I have marked two of the rules in brackets as they seem to cut out a lot of the profits this system generates. You can choose to still use these rules by checking the box that says "Use Original Ruleset" in the options.
The system also contains rules regarding the Heiken Ashi bars. However these aren't as specific as the other rules. This is where your personal judgement comes in and this part is hard to explain. Take a look at the PDF I have linked to get a better understanding.
So far, this is just the TDI trading system and LBs script, now what have I changed?
I have incorporated the Price Action Channel to the system and changed it so that it highlights the bars whenever the system is giving a signal. As long as the bars are green the system is giving a long signal, as long as they are red the system is giving a short signal. Keep in mind that this doesn't consider the bar size of the HA bars. I recommend coloring all bars grey via the chart settings in order to be able to see the bar highlighting properly.
I have also published the Price Action Channel seperately in case some of you wish to view the Channel.
I am fairly new to creating scripts so use it with caution and let me know what you think!
LBs original post:
The seperate Price Action Channel script:

CM Stochastic POP Method 1 - Jake Bernstein_V1A good friend ucsgears recently published a Stochastic Pop Indicator designed by Jake Bernstein with a modified version he found.
I spoke to Jake this morning and asked if he had any updates to his Stochastic POP Trading Method. Attached is a PDF Jake published a while back (Please read for basic rules, which also Includes a New Method). I will release the Additional Method Tomorrow.
Jake asked me to share that he has Updated this Method Recently. Now across all symbols he has found the Stochastic Values of 60 and 30 to be the most profitable. NOTE - This can be Significantly Optimized for certain Symbols/Markets.
Jake Bernstein will be a contributor on TradingView when Backtesting/Strategies are released. Jake is one of the Top Trading System Developers in the world with 45+ years experience and he is going to teach how to create Trading Systems and how to Optimize the correct way.
Below are a few Strategy Results....Soon You Will Be Able To Find Results Like This Yourself on TradingView.com
BackTesting Results Example: EUR-USD Daily Chart Since 01/01/2005
Strategy 1:
Go Long When Stochastic Crosses Above 60. Go Short When Stochastic Crosses Below 30. Exit Long/Short When Stochastic has a Reverse Cross of Entry Value.
Results:
Total Trades = 164
Profit = 50, 126 Pips
Win% = 38.4%
Profit Factor = 1.35
Avg Trade = 306 Pips Profit
***Most Consecutive Wins = 3 ... Most Consecutive Losses = 6
Strategy 2:
Rules - Proprietary Optimization Jake Will Teach. Only Added 1 Additional Exit Rule.
Results:
Total Trades = 164
Profit = 62, 876 Pips!!!
Win% = 38.4%
Profit Factor = 1.44
Avg Trade = 383 Pips Profit
***Most Consecutive Wins = 3 ... Most Consecutive Losses = 6
Strategy 3:
Rules - Proprietary Optimization Jake Will Teach. Only added 1 Additional Exit Rule.
Results:
Winning Percent Increases to 72.6%!!! , Same Amount of Trades.
***Most Consecutive Wins = 21 ...Most Consecutive Losses = 4
Indicator Includes:
-Ability to Color Candles (CheckBox In Inputs Tab)
Green = Long Trade
Blue = No Trade
Red = Short Trade
-Color Coded Stochastic Line based on being Above/Below or In Between Entry Lines.
Link To Jakes PDF with Rules
dl.dropboxusercontent.com

We Are Witnessing A Historical Event With A Clear Outcome!!!"Full Disclosure: I came across this information from www.SentimenTrader.com
I have no financial affiliation…They provide incredible statistical facts on
The General Market, Currencies, and Futures. They offer a two week free trial.
I Highly Recommend.
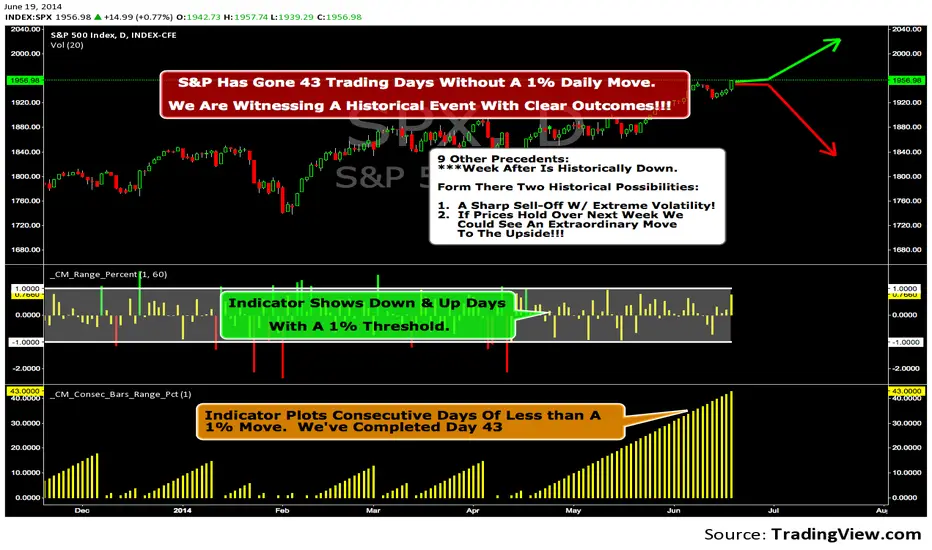
The S&P 500 has gone 43 trading days without a 1% daily move, up or down.
which is the equivalent of two months and one day in trading days.
During this stretch, the S&P has gained more than 4%,
and it has notched a 52-week high recently as well.
Since 1952, there were nine other precedents. All of
these went 42 trading days without a 1% move, all of
them saw the S&P gain at least 4% during their streaks,
and all of them saw the S&P close at a 52-week highs.
***There was consistent weakness a week later, with only three
gainers, and all below +0.5%.
***After that, stocks did better, often continuing an Extraordinary move higher.
Charts can sometimes give us a better nuance than
numbers from a table, and from the charts we can see a
general pattern -
***if stocks held up well in the following
weeks, then they tended to do extremely well in the
months ahead.
***If stocks started to stumble after this two-
month period of calm, however, then the following months
tended to show a lot more volatility.
We already know we're seeing an exceptional market
environment at the moment, going against a large number
of precedents that argued for weakness here, instead of
the rally we've seen. If we continue to head higher in
spite of everything, these precedents would suggest that
we're in the midst of something that could be TRULY EXTRAORDINARY.
Trading Strategy based on BB/KC squeeze**** [Edit: New version (v02) posted, see the comments section for the code *****
Simple strategy. You only consider taking a squeeze play when both the upper and lower Bollinger Bands go inside the Keltner Channel. When the Bollinger Bands (BOTH lines) start to come out of the Keltner Channel, the squeeze has been released and a move is about to take place.
I have added more support indicators -- I highlight the bullish / bearish KC breaches (using GREEN/RED crosses) and a SAR to see where price action is trending.
Appreciate any feedback. Enjoy!
Color codes for v02:
----------------------------
When both the upper and lower Bollinger Bands go inside the Keltner Channel, the squeeze is on and is highlighted in RED.
When the Bollinger Bands (BOTH lines) start to come out of the Keltner Channel, the squeeze has been released and is highlighted in GREEN.
When one of the Bollinger Bands is out of Keltner Channel, no highlighting is done (this means, the background color shows up, so don't get confused if you have RED/GREEN in your chart's bground :))
Color codes for v01:
----------------------------
When both the upper and lower Bollinger Bands go inside the Keltner Channel, the squeeze is on and is highlighted in YELLOW.
When the Bollinger Bands (BOTH lines) start to come out of the Keltner Channel, the squeeze has been released and is highlighted in BLUE.

Yang-Zhang Volatility (YZVol) by CoryP1990 – Quant ToolkitThe Yang-Zhang Volatility (YZVol) estimator measures realized volatility using both overnight gaps and intraday moves. It combines three components: overnight returns, open-to-close returns, and the Rogers–Satchell term, weighted by Zhang’s k to reduce bias.
How to read it
Line color: Green when YZVol is rising (volatility expansion), Red when falling (volatility compression).
Background: Green tint = above High-vol threshold (active regime). Red tint = below Low-vol threshold (quiet regime).
Units: Displays Daily % by default on any timeframe (values are normalized to daily). An optional toggle shows Annualized % (√252 × Daily %).
Typical uses
Spot transitions between quiet and active regimes.
Compare realized vol vs implied vol or a risk-target.
Adapt position sizing to volatility clustering.
Defaults
Length = 20
High-vol threshold = 5% (Daily)
Low-vol threshold = 1% (Daily)
Optional: Annualized % display
Example — SPY (1D)
During the 2020 crash, YZVol surged to 5.8 % per day, capturing the height of pandemic-era volatility before compressing into a calm regime through 2021. Volatility re-expanded in 2022 due to reinflamed COVID fears and gradually stabilized through 2023. A sharp, liquidity-driven volatility event in August 2024 caused another brief YZVol surge, reflecting the historic one-day VIX spike triggered by market-wide risk-off flows and thin pre-market liquidity. A second, policy-driven expansion followed in April–May 2025, coinciding with the renewed U.S.–China tariff conflict and a sharp equity pullback. Since mid-2025, YZVol has settled near 1 % per day, with the red background confirming that realized volatility has once again compressed into a quiet, low-risk regime.
Part of the Quant Toolkit — transparent, open-source indicators for modern quantitative analysis. Built by CoryP1990.

High and low statisticsHigh/Low Pattern Analyzer (All Timeframes)
Ever wonder if there's a hidden pattern in the market?
Does the high of the week usually happen on a Tuesday?
Does the low of the month always form in the first week?
Which 15-minute candle really sets the high for the entire day?
This indicator is a powerful statistical tool designed to answer these questions by analyzing historical price action to find patterns in when the high and low of a period are formed.
The Core Idea: Daily High & Low of the Week
The simplest and most popular feature of this indicator is the "Daily high and low of the week" analysis.
What it does:
It looks back over your chosen number of weeks (e.g., the last 100) and finds out which day of the week (Monday, Tuesday, Wednesday, etc.) made the final high and which day made the final low for each of those weeks.
How to use it:
Go to the script settings.
Enable the "Daily High/Low of the Week" module.
Set your chart to the 1D (Daily) timeframe.
A table will appear on your chart (bottom-right by default) showing the exact count and percentage for each day. This lets you see at a glance if there's a strong tendency for the market you're watching.
Advanced Analysis: Other Timeframes
This script goes far beyond just the daily chart. It includes four other independent analysis modules:
1. 4-Hour High/Low of the Week
What it does: For intraday and swing traders. This module finds which 4-hour candle session (e.g., the 08:00 candle, the 16:00 candle) tends to form the high or low of the entire week.
Key Feature (DST Aware): This table is "season-aware." It knows that the 08:00 "summertime" (DST) candle is the same trading session as the 07:00 "wintertime" (STD) candle. It groups them together so your data is never split or messy.
2. Weekly High/Low of the Month
What it does: For a monthly perspective. This module finds which week of the month (Week 1, 2, 3, 4, or 5) is most likely to form the monthly high or low.
How to use: Enable it and set your chart to the 1W (Weekly) timeframe.
3. Monthly High/Low of the Year
What it does: The ultimate "big picture" view. This module finds which month (Jan, Feb, Mar, etc.) most frequently forms the high or low for the entire year.
How to use: Enable it and set your chart to the 1M (Monthly) timeframe.
The Power User Module: Custom Timeframe Analysis
This is the most powerful feature. It lets you analyze any timeframe combination you want.
What it does: It finds out which "Lower Timeframe" (LTF) candle made the high or low of any "Higher Timeframe" (HTF) you choose.
Example: Do you want to know which 15-minute candle makes the Daily high?
Set your chart to the 15M timeframe.
Go to the "Custom Timeframe Analysis" settings.
Set the "Higher Timeframe" to "1D".
The script will draw a "season-aware" table (just like the 4H module) showing you the exact 15-minute candles (09:15, 09:30, etc.) that are statistically most likely to form the day's high or low.
Other Features
Show Labels: Each module has an option to "Show labels," which will draw a label (e.g., "Daily High of the Week") directly on the chart at the exact bar that made the high or low.
Custom Dividers: Each module has its own optional, color-customizable divider (e.g., weekly, monthly) that you can toggle on to see the periods more clearly.
Clean Settings: All modules are disabled by default (except for "Daily") to keep your chart clean. You only need to enable the specific analysis you want to see.
This tool was built to turn your curiosity about market patterns into actionable, statistical data. Enjoy!

MTF VFSMA SqueezeThe purpose of this indicator is to detect a market squeeze (lack of volatility) period and to identify the initiation and direction of the breakout.
It is based on Variety-Filtered, Squeeze Moving Averages indicator.
The original indicator created by Loxx identifies both squeeze zones and breakouts/breakdowns. A squeeze zone is defined when price is below a specific volatility threshold calculated as the difference between a fast- and slow-moving average and filtered using ATR- or Pips-based threshold.
It operates on a single timeframe and includes Loxx's Expanded Source Types, signals, alerts, etc. and 35+ Loxx's Moving Averages. These adaptive, minimal-lag indicators are built upon advanced mathematical and signal processing DSP techniques that far surpass traditional Moving Averages.
This currently published indicator includes the following main developments:
Squeeze Detection using Percentile Rank Method
It detects the Squeeze by applying a Percentile Rank to the historical distance (spread) between the two MAs.
MA Spread: The basis for Squeeze detection is the distance between the two moving averages.
Percentile Rank: A statistical measure that indicates the percentage of past Spread values within the set lookback period that are lower than the current MA Spread.
Squeeze State: A Squeeze occurs when the Percentile Rank is below the set Squeeze Threshold (%)).
Example: If the threshold is 20% and the Rank is 15%, it means the MA Spread is in its tightest 15% range, below the set threshold. Therefore, the condition is currently met.
Goal: Objective volatility measurement that adapts to market conditions.
Squeeze Duration Filter
A key condition for a Breakout signal is that the MAs must have remained in the Squeeze zone for a specified minimum duration.
Goal: To filter out market noise and False Breakouts.
Multi-Timeframe (MTF) Confluence
Multi-Timeframe trend and squeeze monitoring for 3 timeframes (TFs).
Provides confirmation using the MA status from two higher timeframes (TF2, TF3).
Goal: Trend and momentum confirmation from a broader market context.
Signals Only on Bar Close?
By selecting the signalOnClose parameter to enabled, it is possible to avoid repainting on the chart TF. If it is checked, all events on the chart (L/S signals, Squeeze Start/End, MA color change) will only appear after the bar has closed, preventing repainting. Higher TF events remain in real-time.
Goal: To increase the reliability of signals.
Multi-Level Alerts and Info Panel
Comprehensive, confluence-weighted alerts and real-time status display.
Enhanced Alerts based on multi-timeframe confluences. Alerts are ready to enable/disable for Any alert() function call and ready for watchlists. Alert Frequency is also configurable in Inputs window. „Once per bar close” is the most reliable for signals. „Always” or „Once per bar” alert frequencies may generate temporary signal alerts.
Please note that even if "Once per bar close" is selected as alert frequency, this only applies to the chart TF, and TF2 and TF3 status may be modified until the close of the relevant candle.
Goal: Transparent decision-making.
Other Improvements
Unlike the original indicator, the coloring of the MA curves on the chart depends on the relative positions of the fast MA and slow MA. The curves are colored bullish when the fast MA is above the slow MA, bearish when the opposite is true, and neutral in the squeeze zone.
Data Window with Squeeze Start/End, Buy/Sell, Status, Squeeze Percentile etc. on all 3 TFs.
Ready for Pine Screener.
Please be aware that currently only the chart TF is configurable in Pine Screener, TF2 and TF3 are set to their default values.
Pine Script® version 6.
Limitations
When setting the indicator parameters, please take into account the limitations of TradingView. (Lookback period of Percentile Rank and Moving Averages periods, Execution time limit (timeout) etc.)
For example, if a NaN% message appears as the Percentile Rank value, please reduce the lookback period.
How to use it
This indicator is a Breakout-following system, but it can also be the basis for Range Trading.
The Setup Phase
This is the preparation stage. The indicator signals low volatility as the bands tighten.
Squeeze Dynamics: Monitoring the Squeeze Duration is essential. The longer the price spends in the Squeeze zone, the more likely the resulting breakout will be powerful.
The Signal Phase (Breakout)
The Breakout signal appears on the bar where the Percentile Rank first crosses above the Squeeze threshold, indicating a sudden return of volatility.
Further condition: Meets the SqueezeDuration filter.
Breakout direction: Bullish: Fast MA > SLow MA, Bearish: Fast MA < SLow MA
Applying MTF Confluence:
The most promising trades that are in line with higher timeframes:
Total Confluence: Chart TF Signal + TF2 Bullish/Bearish + TF3 Bullish/Bearish. This is the strongest, highest-probability setup.
Simple signal: Only the Chart TF signals. This should be handled with caution, as the higher timeframes (TF2, TF3) might still be in a Squeeze or in a conflicting state.
Alternative Use: Range Trading within the Squeeze Bands
If the market has low volume, the squeeze bands can be used as dynamic support/resistance for bounces off the edges of the range:
The probability of a successful range trade increases if the boundaries of the squeeze zone have only been touched a few times previously. Each touch weakens the zone boundaries and increases the chance of a Breakout.
Suggested Tactics and Risk Management
When using Breakout strategies, strict risk management and the use of confirmations are essential:
Volume Confirmation: A strong, above-average volume Breakout candle increases the probability of a successful breakout.
False Breakout: If the breakout occurs on low volume, there is a higher chance of a pullback and a False Breakout.
Entry After Retest: A safer entry: wait until the price breaks out, but only enter if it returns to the squeeze zone and bounces back from there. This reduces the risk of a False Breakout trap.
The Risk of False Breakout:
False Breakouts are part of any Breakout strategy. Always have a strict Stop Loss set.
Reversal: Be prepared for the possibility that after a Breakout signal (e.g., Long), the price returns to the zone and then breaks out in the opposite (Short) direction.
Please note that all technical analysis and trading signals only indicate probabilities. Always use your own risk management rules and follow market regulations.
Disclaimer
This indicator is provided for educational and informational purposes only. It is not financial advice.
Trading involves substantial risk of loss and is not suitable for every investor. Past performance shown in examples is not indicative of future results.
The indicator provides signals and calculations, but trading decisions are solely your responsibility. Always:
Test strategies on paper before using real money
Never risk more than you can afford to lose
Understand that all trading involves risk
Consider seeking advice from a licensed financial advisor
The publisher makes no guarantees regarding accuracy, profitability, or performance. Use at your own risk.

Block-Based Trend Breakout (UTB/DTB) & S/R ZonesThis indicator is designed to detect potential trend reversals or volatility bursts by analyzing price action structured into "blocks." Its primary goal is to capture the earliest signals that a defined trend structure is weakening or breaking.
Signal Generation:
🟢 DTB (Downtrend Breakout): When a confirmed downtrend is identified (e.g., price has been falling for 2 blocks), the indicator waits for the price to break above the highest high of the last completed block in that trend. When this break occurs, it signals a potential bullish reversal with a green DTB triangle below the bar.
🔴 UTB (Uptrend Breakdown): When a confirmed uptrend is identified (e.g., price has been rising for 2 blocks), the indicator waits for the price to break below the lowest low of the last completed block. When this break occurs, it signals a potential bearish reversal with a red UTB triangle above the bar.
🛠️ Key Settings
Block Size (bars): The number of bars in each block used to analyze the trend structure. Lower values track short-term trends; higher values track long-term trends.
Trend Confirmation (steps): The minimum number of consecutive blocks required to "confirm" a trend.
Tolerance: Allowed Off-Trend Steps: The number of "noise" blocks allowed while confirming a trend.
Show Support/Resistance Zones: Toggles the histogram-based S/R zones on or off.
S/R Lookback (blocks): Determines how many blocks to look back for calculating S/R zones.
S/R Zone Width (in ATR): Sets the thickness of the S/R zones, denominated in ATRs.
If you find this useful please reach out and let me know how you use it as it's fairly unique... and thus different than anything I've ever seen or used.

Pinbar MTF - No Repaint# Pinbar MTF - No Repaint Indicator
## Complete Technical Documentation
---
## 📊 Overview
**Pinbar MTF (Multi-Timeframe) - No Repaint** is a professional-grade TradingView Pine Script indicator designed to detect high-probability pinbar reversal patterns with advanced filtering systems. The indicator is specifically engineered to be **100% non-repainting**, making it reliable for both live trading and backtesting.
### Key Features
✅ **Non-Repainting** - Signals only appear AFTER bar closes, never disappear
✅ **Three-Layer Filter System** - ATR, SWING, and RSI filters
✅ **Automatic SL/TP Calculation** - Based on risk:reward ratios
✅ **Real-time Alerts** - TradingView notifications for all signals
✅ **Visual Trade Management** - Lines, labels, and areas for entries, stops, and targets
✅ **Backtesting Ready** - Reliable historical data for strategy testing
---
## 🎯 What is a Pinbar?
A **Pinbar (Pin Bar/Pinocchio Bar)** is a single candlestick pattern that indicates a potential price reversal:
### Bullish Pinbar (BUY Signal)
- **Long lower wick** (rejection of lower prices)
- **Small body at the top** of the candle
- Shows buyers rejected sellers' attempt to push price down
- Forms at support levels or swing lows
- Entry signal for LONG positions
### Bearish Pinbar (SELL Signal)
- **Long upper wick** (rejection of higher prices)
- **Small body at the bottom** of the candle
- Shows sellers rejected buyers' attempt to push price up
- Forms at resistance levels or swing highs
- Entry signal for SHORT positions
---
## 🔧 How the Indicator Works
### 1. **Pinbar Detection Logic**
The indicator analyzes the **previous closed bar ** to identify pinbar patterns:
```
Bullish Pinbar Requirements:
- Lower wick > 72% of total candle range (adjustable)
- Upper wick < 28% of total candle range
- Close > Open (bullish candle body)
Bearish Pinbar Requirements:
- Upper wick > 72% of total candle range (adjustable)
- Lower wick < 28% of total candle range
- Close < Open (bearish candle body)
```
**Why check ?** By analyzing the previous completed bar, we ensure the pattern is fully formed and won't change, preventing repainting.
---
### 2. **Three-Layer Filter System**
#### 🔍 **Filter #1: ATR (Average True Range) Filter**
- **Purpose**: Ensures the pinbar has significant size
- **Function**: Only signals if pinbar range ≥ ATR value
- **Benefit**: Filters out small, insignificant pinbars
- **Settings**:
- Enable/Disable toggle
- ATR Period (default: 7)
**Example**: If ATR = 50 pips, only pinbars with 50+ pip range will signal.
---
#### 🔍 **Filter #2: SWING Filter** (Always Active)
- **Purpose**: Confirms pinbar forms at swing highs/lows
- **Function**: Validates the pinbar is an absolute high/low
- **Benefit**: Identifies true reversal points
- **Settings**:
- Swing Candles (default: 3)
**How it works**:
- For bullish pinbar: Checks if low is lowest of past 3 bars
- For bearish pinbar: Checks if high is highest of past 3 bars
**Example**: With 3 swing candles, a bullish pinbar must have the lowest low among the last 3 bars.
---
#### 🔍 **Filter #3: RSI (Relative Strength Index) Filter**
- **Purpose**: Confirms momentum conditions
- **Function**: Prevents signals in extreme momentum zones
- **Benefit**: Avoids counter-trend trades
- **Settings**:
- Enable/Disable toggle
- RSI Period (default: 7)
- RSI Source (Close, Open, High, Low, HL2, HLC3, OHLC4)
- Overbought Level (default: 70)
- Oversold Level (default: 30)
**Logic**:
- Bullish Pinbar: Only signals if RSI < 70 (not overbought)
- Bearish Pinbar: Only signals if RSI > 30 (not oversold)
---
### 3. **Stop Loss Calculation**
Two methods available:
#### Method A: ATR-Based Stop Loss (Recommended)
```
Bullish Pinbar:
SL = Pinbar Low - (1 × ATR)
Bearish Pinbar:
SL = Pinbar High + (1 × ATR)
```
**Benefit**: Dynamic stops that adapt to market volatility
#### Method B: Fixed Pips Stop Loss
```
Bullish Pinbar:
SL = Pinbar Low - (Fixed Pips)
Bearish Pinbar:
SL = Pinbar High + (Fixed Pips)
```
**Settings**:
- Calculate Stop with ATR (toggle)
- Stop Pips without ATR (default: 5)
---
### 4. **Take Profit Calculation**
Take Profit is calculated based on Risk:Reward ratio:
```
Bullish Trade:
TP = Entry + (Entry - SL) × Risk:Reward Ratio
Bearish Trade:
TP = Entry - (SL - Entry) × Risk:Reward Ratio
```
**Example**:
- Entry: 1.2000
- SL: 1.1950 (50 pip risk)
- RR: 2:1
- TP: 1.2100 (100 pip reward = 50 × 2)
**Settings**:
- Risk:Reward Ratio (default: 1.0, range: 0.1 to 10.0)
---
## 📈 Visual Elements
### On-Chart Displays
1. **Signal Markers**
- 🟢 **Green Triangle Up** = Bullish Pinbar (BUY)
- 🔴 **Red Triangle Down** = Bearish Pinbar (SELL)
- Placed directly on the pinbar candle
2. **Entry Labels**
- Green "BUY" label with entry price
- Red "SELL" label with entry price
- Shows exact entry level
3. **Stop Loss Lines**
- 🔴 Red horizontal line
- "SL" label
- Extends 20 bars forward
4. **Take Profit Lines**
- 🟢 Green horizontal line
- "TP" label
- Extends 20 bars forward
5. **Risk/Reward Areas** (Optional)
- Red shaded box = Risk zone (Entry to SL)
- Green shaded box = Reward zone (Entry to TP)
- Visual risk:reward visualization
6. **Info Table** (Top Right)
- Displays current settings
- Shows filter status (ON/OFF)
- Real-time RSI value
- Quick reference panel
---
## 🔔 Alert System
Three alert types available:
### 1. Combined Alert: "Pinbar Signal (Any Direction)"
- Fires for BOTH bullish and bearish pinbars
- **Best for**: General monitoring
- **Message**: "Pinbar Signal Detected on {TICKER} at {PRICE}"
### 2. Bullish Alert: "Bullish Pinbar Alert"
- Fires ONLY for BUY signals
- **Best for**: Long-only strategies
- **Message**: "BUY Signal on {TICKER} at {PRICE}"
### 3. Bearish Alert: "Bearish Pinbar Alert"
- Fires ONLY for SELL signals
- **Best for**: Short-only strategies
- **Message**: "SELL Signal on {TICKER} at {PRICE}"
---
## ⚙️ Input Parameters Reference
### **Filters Group**
| Parameter | Default | Range | Description |
|-----------|---------|-------|-------------|
| ATR Filter on Pinbar Range? | ✅ ON | Boolean | Enable/disable ATR filter |
| ATR Period | 7 | 1+ | Lookback period for ATR calculation |
| Swing Candles | 3 | 1+ | Bars to check for swing high/low |
| RSI Filter on Pinbar? | ❌ OFF | Boolean | Enable/disable RSI filter |
| RSI Period | 7 | 2+ | Lookback period for RSI calculation |
| RSI Source | Close | Multiple | Price data for RSI (Close/Open/High/Low/etc) |
| RSI Overbought Level | 70 | 50-100 | Upper threshold for RSI filter |
| RSI Oversold Level | 30 | 0-50 | Lower threshold for RSI filter |
### **Pinbar Detection Group**
| Parameter | Default | Range | Description |
|-----------|---------|-------|-------------|
| Shadow % vs Body | 72 | 50-95 | Minimum wick size as % of total range |
### **Visualization Group**
| Parameter | Default | Range | Description |
|-----------|---------|-------|-------------|
| Show SL and TP Lines? | ✅ ON | Boolean | Display stop loss and take profit lines |
| Show SL and TP Area? | ❌ OFF | Boolean | Show shaded risk/reward boxes |
### **Risk Management Group**
| Parameter | Default | Range | Description |
|-----------|---------|-------|-------------|
| Risk:Reward Ratio | 1.0 | 0.1-10.0 | Target profit vs risk (1.0 = 1:1, 2.0 = 1:2) |
| Calculate Stop with ATR? | ✅ ON | Boolean | Use ATR for stop calculation |
| Stop Pips without ATR | 5 | 1+ | Fixed pip stop when ATR disabled |
---
## 🚫 Non-Repainting Architecture
### What is Repainting?
**Repainting** occurs when an indicator's historical signals differ from what appeared in real-time. This makes backtesting unreliable and can lead to false confidence in a strategy.
### How This Indicator Prevents Repainting
1. **Closed Bar Analysis**
- All calculations use ` ` offset (previous bar)
- Only analyzes COMPLETED candles
- Signals appear on the bar AFTER the pinbar closes
2. **Confirmed Swing Points**
- Waits for sufficient bar history before signaling
- Only checks historical bars that cannot change
- Prevents premature swing detection
3. **Static Alert Timing**
- Alerts fire only after bar completion
- No conditional logic that changes historically
- Same results in replay mode and live trading
### Verification Method
To verify non-repainting behavior:
1. Apply indicator to chart
2. Note signal locations and prices
3. Refresh browser / reload chart
4. **Signals remain in exact same locations**
---
## 💼 Trading Strategy Guidelines
### Entry Rules
**For Bullish Pinbar (LONG):**
1. Wait for green triangle to appear
2. Enter at close of pinbar (shown in label)
3. Alternative: Enter on break of pinbar high
4. Place stop loss at red SL line
5. Set target at green TP line
**For Bearish Pinbar (SHORT):**
1. Wait for red triangle to appear
2. Enter at close of pinbar (shown in label)
3. Alternative: Enter on break of pinbar low
4. Place stop loss at red SL line
5. Set target at green TP line
### Risk Management
- **Position Sizing**: Risk only 1-2% of account per trade
- **Stop Loss**: Always use the calculated SL (never move it wider)
- **Take Profit**: Use calculated TP or trail stop after 1:1 RR
- **Multiple Timeframes**: Confirm signals on higher timeframe
### Best Practices
✅ **DO:**
- Wait for bar to close before entering
- Trade in direction of higher timeframe trend
- Use on liquid markets with clear support/resistance
- Combine with price action analysis
- Keep a trading journal
❌ **DON'T:**
- Enter before bar closes (prevents seeing full pattern)
- Trade against strong trends
- Ignore the filters (they improve win rate)
- Risk more than 2% per trade
- Trade every signal (be selective)
---
## 📊 Backtesting & Data Export
### Available Data Points
The indicator exports these values for strategy development:
| Output | Description |
|--------|-------------|
| Bullish Signal | 1 = BUY signal, 0 = No signal |
| Bearish Signal | 1 = SELL signal, 0 = No signal |
| Bull SL | Stop loss level for long trades |
| Bull TP | Take profit level for long trades |
| Bull Entry | Entry price for long trades |
| Bear SL | Stop loss level for short trades |
| Bear TP | Take profit level for short trades |
| Bear Entry | Entry price for short trades |
### How to Use in Strategy
These values can be accessed by Pine Script strategies using:
```pine
indicator_values = request.security(syminfo.tickerid, timeframe.period,
)
```
---
## 🎓 Understanding the Filters
### Why Use Multiple Filters?
Single-indicator systems often generate too many false signals. This indicator uses a **confluence approach**:
1. **Pinbar Pattern** = Price rejection detected
2. **+ SWING Filter** = Rejection at key level
3. **+ ATR Filter** = Significant move
4. **+ RSI Filter** = Favorable momentum
**Result**: Higher probability setups with better risk:reward
### Filter Optimization
**Conservative Settings** (Fewer, Higher Quality Signals):
- ATR Filter: ON
- Swing Candles: 5
- RSI Filter: ON
- Shadow %: 75%
**Aggressive Settings** (More Signals, More Noise):
- ATR Filter: OFF
- Swing Candles: 2
- RSI Filter: OFF
- Shadow %: 65%
**Balanced Settings** (Recommended):
- ATR Filter: ON
- Swing Candles: 3
- RSI Filter: OFF (or ON for trending markets)
- Shadow %: 72%
---
## 🔍 Troubleshooting
### "No Signals Appearing"
**Possible Causes:**
1. Filters are too strict
2. No pinbars forming on chart
3. Insufficient bar history
**Solutions:**
- Reduce Shadow % to 65%
- Reduce Swing Candles to 2
- Disable ATR or RSI filters temporarily
- Check that chart has enough data loaded
### "Too Many Signals"
**Solutions:**
- Enable ATR filter
- Increase Swing Candles to 4-5
- Enable RSI filter
- Increase Shadow % to 75-80%
### "Signals Appearing Late"
**This is normal behavior!** The indicator:
- Analyzes previous closed bar
- Signals appear on the bar AFTER the pinbar
- This is what prevents repainting
- Signal latency is 1 bar (by design)
---
## 📝 Technical Specifications
**Indicator Type:** Overlay (displays on price chart)
**Pine Script Version:** 5
**Max Labels:** 500
**Max Lines:** 500
**Repainting:** None (100% non-repainting)
**Data Window Values:** 8 exported values
**Alert Types:** 3 (Combined, Bullish, Bearish)
**Performance:**
- Lightweight script (fast execution)
- Works on all timeframes
- Compatible with all markets (Forex, Crypto, Stocks, Futures)
- No data snooping bias
---
## 🎯 Use Cases
### 1. **Swing Trading**
- Timeframe: Daily, 4H
- Filter Settings: All enabled
- Best for: Catching major reversals
### 2. **Day Trading**
- Timeframe: 15m, 1H
- Filter Settings: ATR + SWING only
- Best for: Intraday reversals
### 3. **Scalping**
- Timeframe: 5m, 15m
- Filter Settings: SWING only (aggressive)
- Best for: Quick reversals (requires experience)
### 4. **Position Trading**
- Timeframe: Weekly, Daily
- Filter Settings: All enabled + high RR (2:1 or 3:1)
- Best for: Long-term trend reversal catches
---
## 🏆 Advantages Over Other Pinbar Indicators
✅ **Guaranteed Non-Repainting** - Many pinbar indicators repaint; this one never does
✅ **Automatic SL/TP** - No manual calculation needed
✅ **Multi-Layer Filtering** - Reduces false signals significantly
✅ **Visual Trade Management** - Clear entry, stop, and target levels
✅ **Flexible Configuration** - Adaptable to any trading style
✅ **Alert System** - Never miss a setup
✅ **Backtesting Ready** - Reliable historical data
✅ **Professional Grade** - Suitable for live trading
---
## 📚 Educational Resources
### Recommended Reading on Pinbars
- "The Pin Bar Trading Strategy" by Nial Fuller
- "Price Action Trading" by Al Brooks
- TradingView Education: Price Action Patterns
### Practice Recommendations
1. Paper trade signals for 20+ trades before live trading
2. Backtest on different timeframes and markets
3. Keep detailed records of all trades
4. Analyze winning vs losing setups
5. Refine filter settings based on results
---
## ⚖️ Disclaimer
This indicator is a tool for technical analysis and does not guarantee profits. Trading involves substantial risk of loss. Past performance is not indicative of future results.
- Always use proper risk management
- Never risk more than you can afford to lose
- Consider your trading experience and objectives
- Seek independent financial advice if needed
---
## 📧 Version Information
**Current Version:** 1.0
**Last Updated:** 2024
**Compatibility:** TradingView Pine Script v5
**Status:** Production Ready
---
## 🔄 Future Enhancements (Potential)
Possible future additions:
- Multi-timeframe confirmation option
- Volume filter integration
- Customizable color schemes
- Win rate statistics display
- Partial profit taking levels
- Trailing stop functionality
---
## 📖 Quick Start Guide
### 5-Minute Setup
1. **Add to Chart**
- Open TradingView
- Go to Pine Editor
- Paste the code
- Click "Add to Chart"
2. **Configure Settings**
- Open indicator settings (gear icon)
- Start with default settings
- Enable "Show SL and TP Lines"
3. **Set Alert**
- Right-click indicator name
- Click "Add Alert"
- Select "Pinbar Signal (Any Direction)"
- Configure notification method
4. **Test**
- Scroll back on chart
- Verify signals make sense
- Check that signals don't repaint
5. **Trade** (After Practice!)
- Wait for alert
- Verify signal quality
- Enter, place SL/TP
- Manage trade
---
## 🎯 Final Thoughts
The **Pinbar MTF - No Repaint** indicator is designed for serious traders who value:
- **Reliability** over flashy signals
- **Quality** over quantity
- **Honesty** over false promises
This indicator will NOT:
- Make you rich overnight
- Win every trade
- Replace proper trading education
This indicator WILL:
- Identify high-probability reversal setups
- Save you analysis time
- Provide consistent, non-repainting signals
- Help you develop a systematic trading approach
**Success in trading comes from:**
1. Proper education (60%)
2. Risk management (30%)
3. Technical tools like this indicator (10%)
Use this tool as part of a complete trading plan, not as a standalone solution.

Pivot Orderflow DeltaThis indicator analyzes order flow by calculating a continuous Cumulative Volume Profile Delta (CVPD). It plots this delta as a series of "delta candles" and identifies divergences and structural pivot levels.
Key Features:
Statistical Delta Engine: For each bar, the indicator builds a high-resolution volume profile on a lower 'Intra-Bar Timeframe'. It uses statistical models ('PDF' allocation) and advanced classifiers ('Dynamic' split) to determine the buy/sell pressure, which is then accumulated.
Cumulative Delta Candle Visualization: The indicator plots the continuous, accumulated delta as a series of candles, where for each bar:
Open: Is the cumulative delta value of the previous bar.
Close: Is the new total cumulative delta.
High/Low: Represent the peak/trough cumulative delta reached during that bar's formation.
Dynamic Pivot Baseline: The indicator plots a separate dynamic baseline ('Impulse Start') that adjusts when a new price pivot is confirmed.
When a price high forms, the baseline moves to the lower of its previous level or the peak delta (max of delta candle O/C) at the pivot.
When a price low forms, the baseline moves to the higher of its previous level or the trough delta (min of delta candle O/C) at the pivot.
Full Divergence Suite (Class A, B, C): A built-in divergence engine automatically detects and plots Regular (A), Hidden (B), and Exaggerated (C) divergences between price and the peak/trough of the delta candles (High/Low).
Detailed Pivot Confluence: The indicator plots distinct markers to differentiate between pivots occurring only on the price chart, only on the delta oscillator, or on both simultaneously.
Note on Confirmation (Lag): Divergence and pivot signals rely on a confirmation method. A pivot is only plotted after the Pivot Right Bars input has passed, which introduces an inherent lag.
Integrated Alerts: Includes 23 comprehensive alerts for:
The start and end of all 6 divergence types.
The detection of a new Impulse Start pivot.
Delta/volume agreement/disagreement.
Delta crossing the zero line.
The formation of price-only or delta-only pivots.
Caution: Real-Time Data Behavior (Intra-Bar Repainting) This indicator uses high-resolution intra-bar data. As a result, the values on the current, unclosed bar (the real-time bar) will update dynamically as new intra-bar data arrives. This behavior is normal and necessary for this type of analysis. Signals should only be considered final after the main chart bar has closed.
DISCLAIMER
For Informational/Educational Use Only: This indicator is provided for informational and educational purposes only. It does not constitute financial, investment, or trading advice, nor is it a recommendation to buy or sell any asset.
Use at Your Own Risk: All trading decisions you make based on the information or signals generated by this indicator are made solely at your own risk.
No Guarantee of Performance: Past performance is not an indicator of future results. The author makes no guarantee regarding the accuracy of the signals or future profitability.
No Liability: The author shall not be held liable for any financial losses or damages incurred directly or indirectly from the use of this indicator.
Signals Are Not Recommendations: The alerts and visual signals (e.g., crossovers) generated by this tool are not direct recommendations to buy or sell. They are technical observations for your own analysis and consideration.

Volume Profile DeltaThis indicator calculates the Volume Profile Delta (VPD). It constructs a high-resolution volume profile for each bar using intra-bar data, offering a detailed understanding of buying and selling pressure at discrete price levels.
Key Features:
Statistical Volume Profile Engine: For each bar, the indicator builds a high-resolution volume profile on a lower 'Intra-Bar Timeframe'. Instead of simple tick counting, it uses statistical models ('PDF' allocation) to distribute volume across price levels and advanced classifiers ('Dynamic' split) to determine the buy/sell pressure within that profile, providing a more nuanced delta calculation.
"Delta Candle" Visualization: The per-bar VPD is displayed as a candle, where:
Open: Always anchored at the zero line.
High/Low: Represent the peak buying (CVD High) and selling (CVD Low) pressure accumulated within that bar's profile.
Close: The final net delta value (CVD) for the bar.
Customizable Moving Average: An optional moving average of the net delta (Close) can be added. The MA type, length, and an optional Volume weighted setting are customizable.
Intra-Bar Peak Pivot Detection: Automatically identifies and plots significant turning points (pivots) in the peak buying (High) and selling (Low) pressure.
Note on Confirmation (Lag): Pivot signals are confirmed using a lookback method. A pivot is only plotted after the Pivot Right Bars input has passed, which introduces an inherent lag.
Multi-Timeframe (MTF) Capability:
MTF Output: The entire analysis (Delta Candles, MA, Pivots) can be calculated on a higher timeframe (using the Timeframe input), with standard options to handle gaps (Fill Gaps) and prevent repainting (Wait for...).
Limitation: The Pivot detection (Calculate Pivots) is disabled if a Higher Timeframe (HTF) is selected.
Integrated Alerts: Includes 8 alerts for:
The net delta crossing its moving average.
The detection of new peak buying or selling pivots.
Conditions of agreement or disagreement between the net delta and the main bar's direction.
Caution: Real-Time Data Behavior (Intra-Bar Repainting) This indicator uses high-resolution intra-bar data. As a result, the values on the current, unclosed bar (the real-time bar) will update dynamically as new intra-bar data arrives. This behavior is normal and necessary for this type of analysis. Signals should only be considered final after the main chart bar has closed.
DISCLAIMER
For Informational/Educational Use Only: This indicator is provided for informational and educational purposes only. It does not constitute financial, investment, or trading advice, nor is it a recommendation to buy or sell any asset.
Use at Your Own Risk: All trading decisions you make based on the information or signals generated by this indicator are made solely at your own risk.
No Guarantee of Performance: Past performance is not an indicator of future results. The author makes no guarantee regarding the accuracy of the signals or future profitability.
No Liability: The author shall not be held liable for any financial losses or damages incurred directly or indirectly from the use of this indicator.
Signals Are Not Recommendations: The alerts and visual signals (e.g., crossovers) generated by this tool are not direct recommendations to buy or sell. They are technical observations for your own analysis and consideration.

Volume DeltaThis indicator provides a detailed view of Volume Delta (VD) by analyzing order flow on a lower, intra-bar timeframe. For each bar on the chart, it calculates the net difference between buying and selling volume based on the direction of the intra-bar candles.
Key Features:
Intra-Bar Delta Calculation: The indicator analyzes price action on a user-defined lower timeframe ('Intra-Bar Timeframe') to construct a detailed picture of the underlying order flow for each bar on the main chart.
"Delta Candle" Visualization: The delta for each bar is shown as a candle, where:
Open: Always starts at the zero line.
High/Low: Represent the peak buying and selling pressure accumulated within the bar.
Close: The final net delta value for that bar. This visualization shows absorption, exhaustion, and conviction in a single glance.
Customizable Moving Average: An optional moving average of the net delta (Close) can be added. The MA type, length, and an optional Volume weighted setting are customizable.
Intra-Bar Peak Pivot Detection: Automatically identifies and plots significant turning points (pivots) in the peak buying (High) and selling (Low) pressure.
Note on Confirmation (Lag): Pivot signals are confirmed using a lookback method. A pivot is only plotted after the Pivot Right Bars input has passed, which introduces an inherent lag.
Multi-Timeframe (MTF) Capability:
MTF Output: The entire analysis (Delta Candles, MA, Pivots) can be calculated on a higher timeframe (using the Timeframe input), with standard options to handle gaps (Fill Gaps) and prevent repainting (Wait for...).
Limitation: The Pivot detection (Calculate Pivots) is disabled if a Higher Timeframe (HTF) is selected.
Integrated Alerts: Includes 8 alerts for:
The net delta crossing its moving average.
The detection of new peak buying or selling pivots.
Conditions of agreement or disagreement between the net delta and the main bar's direction (absolute volume).
Caution: Real-Time Data Behavior (Intra-Bar Repainting) This indicator uses high-resolution intra-bar data. As a result, the values on the current, unclosed bar (the real-time bar) will update dynamically as new intra-bar data arrives. This behavior is normal and necessary for this type of analysis. Signals should only be considered final after the main chart bar has closed.
DISCLAIMER
For Informational/Educational Use Only: This indicator is provided for informational and educational purposes only. It does not constitute financial, investment, or trading advice, nor is it a recommendation to buy or sell any asset.
Use at Your Own Risk: All trading decisions you make based on the information or signals generated by this indicator are made solely at your own risk.
No Guarantee of Performance: Past performance is not an indicator of future results. The author makes no guarantee regarding the accuracy of the signals or future profitability.
No Liability: The author shall not be held liable for any financial losses or damages incurred directly or indirectly from the use of this indicator.
Signals Are Not Recommendations: The alerts and visual signals (e.g., crossovers) generated by this tool are not direct recommendations to buy or sell. They are technical observations for your own analysis and consideration.

Volume Weighted Intra Bar LR Standard DeviationThis indicator analyzes market character by providing a detailed view of volatility. It applies a Linear Regression model to intra-bar price action, dissecting the total volatility of each bar into three distinct components.
Key Features:
Three-Component Volatility Decomposition: By analyzing a lower timeframe ('Intra-Bar Timeframe'), the indicator separates each bar's volatility into:
Trend Volatility (Green/Red): Volatility explained by the intra-bar linear regression slope (Momentum).
Residual Volatility (Yellow): Volatility from price oscillating around the intra-bar trendline (Mean-Reversion).
Within-Bar Volatility (Blue): Volatility derived from the range of each intra-bar candle (Noise/Choppiness).
Layered Column Visualization: The indicator plots these components as a layered column chart. The size of each colored layer visually represents the dominance of each volatility character.
Dual Display Modes: The indicator offers two modes to visualize this decomposition:
Absolute Mode: Displays the total standard deviation as the column height, showing the absolute magnitude of volatility and the contribution of each component.
Normalized Mode: Displays the components as a 100% stacked column chart (scaled from 0 to 1), focusing purely on the percentage ratio of Trend, Residual, and Noise.
Calculation Options:
Statistical Model: The 'Estimate Bar Statistics' option (enabled by default) uses a statistical model ('Estimator') to perform the decomposition. (Assumption: In this mode, the Source input is ignored, and an estimated mean for each bar is used instead).
Normalization: An optional 'Normalize Volatility' setting calculates an Exponential Regression Curve (log-space).
Volume Weighting: An option (Volume weighted) applies volume weighting to all intra-bar calculations.
Multi-Component Pivot Detection: Includes a pivot detector that identifies significant turning points (highs and lows) in both the Total Volatility and the Trend Volatility Ratio. (Note: These pivots are only plotted when 'Plot Mode' is set to 'Absolute').
Note on Confirmation (Lag): Pivot signals are confirmed using a lookback method. A pivot is only plotted after the Pivot Right Bars input has passed, which introduces an inherent lag.
Multi-Timeframe (MTF) Capability:
MTF Analysis: The entire intra-bar analysis can be run on a higher timeframe (using the Timeframe input), with standard options to handle gaps (Fill Gaps) and prevent repainting (Wait for...).
Limitation: The Pivot detection (Calculate Pivots) is disabled if a Higher Timeframe (HTF) is selected.
Integrated Alerts: Includes 9 comprehensive alerts for:
Volatility character changes (e.g., 'Character Change from Noise to Trend').
Dominant character emerging (e.g., 'Bullish Trend Character Emerging').
Total Volatility pivot (High/Low) detection.
Trend Volatility pivot (High/Low) detection.
Caution! Real-Time Data Behavior (Intra-Bar Repainting) This indicator uses high-resolution intra-bar data. As a result, the values on the current, unclosed bar (the real-time bar) will update dynamically as new intra-bar data arrives. This behavior is normal and necessary for this type of analysis. Signals should only be considered final after the main chart bar has closed.
DISCLAIMER
For Informational/Educational Use Only: This indicator is provided for informational and educational purposes only. It does not constitute financial, investment, or trading advice, nor is it a recommendation to buy or sell any asset.
Use at Your Own Risk: All trading decisions you make based on the information or signals generated by this indicator are made solely at your own risk.
No Guarantee of Performance: Past performance is not an indicator of future results. The author makes no guarantee regarding the accuracy of the signals or future profitability.
No Liability: The author shall not be held liable for any financial losses or damages incurred directly or indirectly from the use of this indicator.
Signals Are Not Recommendations: The alerts and visual signals (e.g., crossovers) generated by this tool are not direct recommendations to buy or sell. They are technical observations for your own analysis and consideration.

Volume Weighted Intra Bar Standard DeviationThis indicator provides a high-resolution analysis of market volatility by dissecting each bar on the chart into its fundamental components. It uses data from a lower, intra-bar timeframe to separate the total volatility of a single bar into its 'directional' and 'non-directional' parts.
Key Features:
Intra-Bar Volatility Decomposition: For each bar on the chart, the indicator analyzes the underlying price action on a smaller timeframe ('Intra-Bar Timeframe') and quantifies two types of volatility:
Between-Bar Volatility (Directional): Calculated from price movements between the intra-bar candles. This component represents the directional, trending price action within the main bar.
Within-Bar Volatility (Non-Directional): Calculated from price fluctuations inside each intra-bar candle. This component represents the choppy, noisy, or ranging price action.
Dual Display Modes: The indicator offers two modes to visualize this information:
Absolute Mode: Plots the total standard deviation as a stacked column chart, showing the absolute magnitude of volatility and the contribution of each component.
Normalized Mode: Plots the components as a 100% stacked column chart (scaled from 0 to 1), focusing purely on the percentage ratio of 'between-bar' (trending) and 'within-bar' (choppy) volatility.
Calculation Options:
Statistical Model: The 'Estimate Bar Statistics' option (enabled by default) uses a statistical model ('Estimator') to perform the decomposition. (Assumption: In this mode, the Source input is ignored, and an estimated mean for each bar is used instead).
Normalization: An optional 'Normalize Volatility' setting calculates volatility in percentage terms (log-space).
Volume Weighting: An option (Volume weighted) applies volume weighting to all intra-bar volatility calculations.
Volatility Pivot Detection: Includes a built-in pivot detector that identifies significant turning points (highs and lows) in the total volatility line. (Note: This is only visible in 'Absolute Mode').
Note on Confirmation (Lag): Pivot signals are confirmed using a lookback method. A pivot is only plotted after the Pivot Right Bars input has passed, which introduces an inherent lag.
Multi-Timeframe (MTF) Capability:
MTF Analysis Lines: The entire intra-bar analysis can be run on a higher timeframe (using the Timeframe input), with standard options to handle gaps (Fill Gaps) and prevent repainting (Wait for...).
Limitation: The Pivot detection (Calculate Pivots) is disabled if a Higher Timeframe (HTF) is selected.
Integrated Alerts: Includes 6 alerts for:
Volatility character changes (e.g., 'Character Change from Choppy to Trend').
Dominant character emerging (e.g., 'Trend Character Emerging').
Total Volatility pivot (High/Low) detection.
Caution: Real-Time Data Behavior (Intra-Bar Repainting) This indicator uses high-resolution intra-bar data. As a result, the values on the current, unclosed bar (the real-time bar) will update dynamically as new intra-bar data arrives. This behavior is normal and necessary for this type of analysis. Signals should only be considered final after the main chart bar has closed.
DISCLAIMER
For Informational/Educational Use Only: This indicator is provided for informational and educational purposes only. It does not constitute financial, investment, or trading advice, nor is it a recommendation to buy or sell any asset.
Use at Your Own Risk: All trading decisions you make based on the information or signals generated by this indicator are made solely at your own risk.
No Guarantee of Performance: Past performance is not an indicator of future results. The author makes no guarantee regarding the accuracy of the signals or future profitability.
No Liability: The author shall not be held liable for any financial losses or damages incurred directly or indirectly from the use of this indicator.
Signals Are Not Recommendations: The alerts and visual signals (e.g., crossovers) generated by this tool are not direct recommendations to buy or sell. They are technical observations for your own analysis and consideration.

LibPvotLibrary "LibPvot"
This is a library for advanced technical analysis, specializing
in two core areas: the detection of price-oscillator
divergences and the analysis of market structure. It provides
a back-end engine for signal detection and a toolkit for
indicator plotting.
Key Features:
1. **Complete Divergence Suite (Class A, B, C):** The engine detects
all three major types of divergences, providing a full spectrum of
analytical signals:
- **Regular (A):** For potential trend reversals.
- **Hidden (B):** For potential trend continuations.
- **Exaggerated (C):** For identifying weakness at double tops/bottoms.
2. **Advanced Signal Filtering:** The detection logic uses a
percentage-based price tolerance (`prcTol`). This feature
enables the practical detection of Exaggerated divergences
(which rarely occur at the exact same price) and creates a
"dead zone" to filter insignificant noise from triggering
Regular divergences.
3. **Pivot Synchronization:** A bar tolerance (`barTol`) is used
to reliably match price and oscillator pivots that do not
align perfectly on the same bar, preventing missed signals.
4. **Signal Invalidation Logic:** Features two built-in invalidation
rules:
- An optional `invalidate` parameter automatically terminates
active divergences if the price or the oscillator breaks
the level of the confirming pivot.
- The engine also discards 'half-pivots' (e.g., a price pivot)
if a corresponding oscillator pivot does not appear within
the `barTol` window.
5. **Stateful Plotting Helpers:** Provides helper functions
(`bullDivPos` and `bearDivPos`) that abstract away the
state management issues of visualizing persistent signals.
They generate gap-free, accurately anchored data series
ready to be used in `plotshape` functions, simplifying
indicator-side code.
6. **Rich Data Output:** The core detection functions (`bullDiv`, `bearDiv`)
return a comprehensive 9-field data tuple. This includes the
boolean flags for each divergence type and the precise
coordinates (price, oscillator value, bar index) of both the
starting and the confirming pivots.
7. **Market Structure & Trend Analysis:** Includes a
`marketStructure` function to automatically identify pivot
highs/lows, classify their relationship (HH, LH, LL, HL),
detect structure breaks, and determine the current trend
state (Up, Down, Neutral) based on pivot sequences.
---
**DISCLAIMER**
This library is provided "AS IS" and for informational and
educational purposes only. It does not constitute financial,
investment, or trading advice.
The author assumes no liability for any errors, inaccuracies,
or omissions in the code. Using this library to build
trading indicators or strategies is entirely at your own risk.
As a developer using this library, you are solely responsible
for the rigorous testing, validation, and performance of any
scripts you create based on these functions. The author shall
not be held liable for any financial losses incurred directly
or indirectly from the use of this library or any scripts
derived from it.
bullDiv(priceSrc, oscSrc, leftLen, rightLen, depth, barTol, prcTol, persist, invalidate)
Detects bullish divergences (Regular, Hidden, Exaggerated) based on pivot lows.
Parameters:
priceSrc (float) : series float Price series to check for pivots (e.g., `low`).
oscSrc (float) : series float Oscillator series to check for pivots.
leftLen (int) : series int Number of bars to the left of a pivot (default 5).
rightLen (int) : series int Number of bars to the right of a pivot (default 5).
depth (int) : series int Maximum number of stored pivot pairs to check against (default 2).
barTol (int) : series int Maximum bar distance allowed between the price pivot and the oscillator pivot (default 3).
prcTol (float) : series float The percentage tolerance for comparing pivot prices. Used to detect Exaggerated
divergences and filter out market noise (default 0.05%).
persist (bool) : series bool If `true` (default), the divergence flag stays active for the entire duration of the signal.
If `false`, it returns a single-bar pulse on detection.
invalidate (bool) : series bool If `true` (default), terminates an active divergence if price or oscillator break
below the confirming pivot low.
Returns: A tuple containing comprehensive data for a detected bullish divergence.
regBull series bool `true` if a Regular bullish divergence (Class A) is active.
hidBull series bool `true` if a Hidden bullish divergence (Class B) is active.
exgBull series bool `true` if an Exaggerated bullish divergence (Class C) is active.
initPivotPrc series float Price value of the initial (older) pivot low.
initPivotOsz series float Oscillator value of the initial pivot low.
initPivotBar series int Bar index of the initial pivot low.
lastPivotPrc series float Price value of the last (confirming) pivot low.
lastPivotOsz series float Oscillator value of the last pivot low.
lastPivotBar series int Bar index of the last pivot low.
bearDiv(priceSrc, oscSrc, leftLen, rightLen, depth, barTol, prcTol, persist, invalidate)
Detects bearish divergences (Regular, Hidden, Exaggerated) based on pivot highs.
Parameters:
priceSrc (float) : series float Price series to check for pivots (e.g., `high`).
oscSrc (float) : series float Oscillator series to check for pivots.
leftLen (int) : series int Number of bars to the left of a pivot (default 5).
rightLen (int) : series int Number of bars to the right of a pivot (default 5).
depth (int) : series int Maximum number of stored pivot pairs to check against (default 2).
barTol (int) : series int Maximum bar distance allowed between the price pivot and the oscillator pivot (default 3).
prcTol (float) : series float The percentage tolerance for comparing pivot prices. Used to detect Exaggerated
divergences and filter out market noise (default 0.05%).
persist (bool) : series bool If `true` (default), the divergence flag stays active for the entire duration of the signal.
If `false`, it returns a single-bar pulse on detection.
invalidate (bool) : series bool If `true` (default), terminates an active divergence if price or oscillator break
above the confirming pivot high.
Returns: A tuple containing comprehensive data for a detected bearish divergence.
regBear series bool `true` if a Regular bearish divergence (Class A) is active.
hidBear series bool `true` if a Hidden bearish divergence (Class B) is active.
exgBear series bool `true` if an Exaggerated bearish divergence (Class C) is active.
initPivotPrc series float Price value of the initial (older) pivot high.
initPivotOsz series float Oscillator value of the initial pivot high.
initPivotBar series int Bar index of the initial pivot high.
lastPivotPrc series float Price value of the last (confirming) pivot high.
lastPivotOsz series float Oscillator value of the last pivot high.
lastPivotBar series int Bar index of the last pivot high.
bullDivPos(regBull, hidBull, exgBull, rightLen, yPos)
Calculates the plottable data series for bullish divergences. It manages
the complex state of a persistent signal's plotting window to ensure
gap-free and accurately anchored visualization.
Parameters:
regBull (bool) : series bool The regular bullish divergence flag from `bullDiv`.
hidBull (bool) : series bool The hidden bullish divergence flag from `bullDiv`.
exgBull (bool) : series bool The exaggerated bullish divergence flag from `bullDiv`.
rightLen (int) : series int The same `rightLen` value used in `bullDiv` for correct timing.
yPos (float) : series float The series providing the base Y-coordinate for the shapes (e.g., `low`).
Returns: A tuple of three `series float` for plotting bullish divergences.
regBullPosY series float Contains the static anchor Y-value for Regular divergences where a shape should be plotted; `na` otherwise.
hidBullPosY series float Contains the static anchor Y-value for Hidden divergences where a shape should be plotted; `na` otherwise.
exgBullPosY series float Contains the static anchor Y-value for Exaggerated divergences where a shape should be plotted; `na` otherwise.
bearDivPos(regBear, hidBear, exgBear, rightLen, yPos)
Calculates the plottable data series for bearish divergences. It manages
the complex state of a persistent signal's plotting window to ensure
gap-free and accurately anchored visualization.
Parameters:
regBear (bool) : series bool The regular bearish divergence flag from `bearDiv`.
hidBear (bool) : series bool The hidden bearish divergence flag from `bearDiv`.
exgBear (bool) : series bool The exaggerated bearish divergence flag from `bearDiv`.
rightLen (int) : series int The same `rightLen` value used in `bearDiv` for correct timing.
yPos (float) : series float The series providing the base Y-coordinate for the shapes (e.g., `high`).
Returns: A tuple of three `series float` for plotting bearish divergences.
regBearPosY series float Contains the static anchor Y-value for Regular divergences where a shape should be plotted; `na` otherwise.
hidBearPosY series float Contains the static anchor Y-value for Hidden divergences where a shape should be plotted; `na` otherwise.
exgBearPosY series float Contains the static anchor Y-value for Exaggerated divergences where a shape should be plotted; `na` otherwise.
marketStructure(highSrc, lowSrc, leftLen, rightLen, srcTol)
Analyzes the market structure by identifying pivot points, classifying
their sequence (e.g., Higher Highs, Lower Lows), and determining the
prevailing trend state.
Parameters:
highSrc (float) : series float Price series for pivot high detection (e.g., `high`).
lowSrc (float) : series float Price series for pivot low detection (e.g., `low`).
leftLen (int) : series int Number of bars to the left of a pivot (default 5).
rightLen (int) : series int Number of bars to the right of a pivot (default 5).
srcTol (float) : series float Percentage tolerance to consider two pivots as 'equal' (default 0.05%).
Returns: A tuple containing detailed market structure information.
pivType series PivType The type of the most recently formed pivot (e.g., `hh`, `ll`).
lastPivHi series float The price level of the last confirmed pivot high.
lastPivLo series float The price level of the last confirmed pivot low.
lastPiv series float The price level of the last confirmed pivot (either high or low).
pivHiBroken series bool `true` if the price has broken above the last pivot high.
pivLoBroken series bool `true` if the price has broken below the last pivot low.
trendState series TrendState The current trend state (`up`, `down`, or `neutral`).

LibVolmLibrary "LibVolm"
This library provides a collection of core functions for volume and
money flow analysis. It offers implementations of several classic
volume-based indicators, with a focus on flexibility
for applications like multi-timeframe and session-based analysis.
Key Features:
1. **Suite of Classic Volume Indicators:** Includes standard
implementations of several foundational indicators:
- **On Balance Volume (`obv`):** A momentum indicator that
accumulates volume based on price direction.
- **Accumulation/Distribution Line (`adLine`):** Measures cumulative
money flow using the close's position within the bar's range.
- **Chaikin Money Flow (`cmf`):** An oscillator version of the ADL
that measures money flow over a specified lookback period.
2. **Anchored/Resettable Indicators:** The library includes flexible,
resettable indicators ideal for cyclical analysis:
- **Anchored VWAP (`vwap`):** Calculates a Volume Weighted Average
Price that can be reset on any user-defined `reset` condition.
It returns both the VWAP and the number of bars (`prdBars`) in
the current period.
- **Resettable CVD (`cvd`):** Computes a Cumulative Volume Delta
that can be reset on a custom `reset` anchor. The function
also tracks and returns the highest (`hi`) and lowest (`lo`)
delta values reached within the current period.
(Note: The delta sign is determined by a specific logic:
it first checks close vs. open, then close vs. prior
close, and persists the last non-zero sign).
3. **Volume Sanitization:** All functions that use the built-in
`volume` variable automatically sanitize it via an internal
function. This process replaces `na` values with 0 and ensures
no negative volume values are used, providing stable calculations.
---
**DISCLAIMER**
This library is provided "AS IS" and for informational and
educational purposes only. It does not constitute financial,
investment, or trading advice.
The author assumes no liability for any errors, inaccuracies,
or omissions in the code. Using this library to build
trading indicators or strategies is entirely at your own risk.
As a developer using this library, you are solely responsible
for the rigorous testing, validation, and performance of any
scripts you create based on these functions. The author shall
not be held liable for any financial losses incurred directly
or indirectly from the use of this library or any scripts
derived from it.
obv(price)
Calculates the On Balance Volume (OBV) cumulative indicator.
Parameters:
price (float) : series float Source price series, typically the close.
Returns: series float Cumulative OBV value.
adLine()
Computes the Accumulation/Distribution Line (AD Line).
Returns: series float Cumulative AD Line value.
cmf(length)
Computes Chaikin Money Flow (CMF).
Parameters:
length (int) : series int Lookback length for the CMF calculation.
Returns: series float CMF value.
vwap(price, reset)
Calculates an anchored Volume Weighted Average Price (VWAP).
Parameters:
price (float) : series float Source price series (usually *close*).
reset (bool) : series bool A signal that is *true* on the bar where the
accumulation should be reset.
Returns:
vwap series float The calculated Volume Weighted Average Price for the current period.
prdBars series int The number of bars that have passed since the last reset.
cvd(reset)
Calculates a resettable, cumulative Volume Delta (CVD).
It accumulates volume delta and tracks its high/low range. The
accumulation is reset to zero whenever the `reset` condition is true.
This is useful for session-based analysis, intra-bar calculations,
or any other custom-anchored accumulation.
Parameters:
reset (bool) : series bool A signal that is *true* on the bar where the
accumulation should be reset.
Returns:
cum series float The current cumulative volume delta.
hi series float The highest peak the cumulative delta has reached in the current period.
lo series float The lowest trough the cumulative delta has reached in the current period.

Opening Range Breakout with Multi-Timeframe Liquidity]═══════════════════════════════════════
OPENING RANGE BREAKOUT WITH MULTI-TIMEFRAME LIQUIDITY
═══════════════════════════════════════
A professional Opening Range Breakout (ORB) indicator enhanced with multi-timeframe liquidity detection, trading session visualization, volume analysis, and trend confirmation tools. Designed for intraday trading with comprehensive alert system.
───────────────────────────────────────
WHAT THIS INDICATOR DOES
───────────────────────────────────────
This indicator combines multiple trading concepts:
- Opening Range Breakout (ORB) - Customizable time period detection with automatic high/low identification
- Multi-Timeframe Liquidity - HTF (Higher Timeframe) and LTF (Lower Timeframe) key level detection
- Trading Sessions - Tokyo, London, New York, and Sydney session visualization
- Volume Analysis - Volume spike detection and strength measurement
- Multi-Timeframe Confirmation - Trend bias from higher timeframes
- EMA Integration - Trend filter and dynamic support/resistance
- Smart Alerts - Quality-filtered breakout notifications
───────────────────────────────────────
HOW IT WORKS
───────────────────────────────────────
OPENING RANGE BREAKOUT (ORB):
Concept:
The Opening Range is a period at the start of a trading session where price establishes an initial high and low. Breakouts beyond this range often indicate the direction of the day's trend.
Detection Method:
- Default: 15-minute opening range (configurable)
- Custom Range: Set specific session times with timezone support
- Automatically identifies ORH (Opening Range High) and ORL (Opening Range Low)
- Tracks ORB mid-point for reference
Range Establishment:
1. Session starts (or custom time begins)
2. Tracks highest high and lowest low during the period
3. Range confirmed at end of opening period
4. Levels extend throughout the session
Breakout Detection:
- Bullish Breakout: Close above ORH
- Bearish Breakout: Close below ORL
- Mid-point acts as bias indicator
Visual Display:
- Shaded box during range formation
- Horizontal lines for ORH, ORL, and mid-point
- Labels showing level values
- Color-coded fills based on selected method
Fill Color Methods:
1. Session Comparison:
- Green: Current OR mid > Previous OR mid
- Red: Current OR mid < Previous OR mid
- Gray: Equal or first session
- Shows day-over-day momentum
2. Breakout Direction (Recommended):
- Green: Price currently above ORH (bullish breakout)
- Red: Price currently below ORL (bearish breakout)
- Gray: Price inside range (no breakout)
- Real-time breakout status
MULTI-TIMEFRAME LIQUIDITY:
Two-Tier System for comprehensive level identification:
HTF (Higher Timeframe) Key Liquidity:
- Default: 4H timeframe (configurable to Daily, Weekly)
- Identifies major institutional levels
- Uses pivot detection with adjustable parameters
- Suitable for swing highs/lows where large orders rest
LTF (Lower Timeframe) Key Liquidity:
- Default: 1H timeframe (configurable)
- Provides precision entry/exit levels
- Finer granularity for intraday trading
- Captures minor swing points
Calculation Method:
- Pivot high/low detection algorithm
- Configurable left bars (lookback) and right bars (confirmation)
- Timeframe multiplier for accurate multi-timeframe detection
- Automatic level extension
Mitigation System:
- Tracks when levels are swept (broken)
- Configurable mitigation type: Wick or Close-based
- Option to remove or show mitigated levels
- Display limit prevents chart clutter
Asset-Specific Optimization:
The indicator includes quick reference settings for different assets:
- Major Forex (EUR/USD, GBP/USD): Default settings optimal
- Crypto (BTC/ETH): Left=12, Right=4, Display=7
- Gold: HTF=1D, Left=20
TRADING SESSIONS:
Four Major Sessions with Full Customization:
Tokyo Session:
- Default: 04:00-13:00 UTC+4
- Asian trading hours
- Often sets daily range
London Session:
- Default: 11:00-20:00 UTC+4
- Highest liquidity period
- Major institutional activity
New York Session:
- Default: 16:00-01:00 UTC+4
- US market hours
- High-impact news events
Sydney Session:
- Default: 01:00-10:00 UTC+4
- Earliest Asian activity
- Lower volatility
Session Features:
- Shaded background boxes
- Session name labels
- Optional open/close lines
- Session high/low tracking with colored lines
- Each session has independent color settings
- Fully customizable times and timezones
VOLUME ANALYSIS:
Volume-Based Trade Confirmation:
Volume MA:
- Configurable period (default: 20)
- Establishes average volume baseline
- Used for spike detection
Volume Spike Detection:
- Identifies when volume exceeds MA * multiplier
- Default: 1.5x average volume
- Confirms breakout strength
Volume Strength Measurement:
- Calculates current volume as percentage of average
- Shows relative volume intensity
- Used in alert quality filtering
High Volume Bars:
- Identifies bars above 50th percentile
- Additional confirmation layer
- Indicates institutional participation
MULTI-TIMEFRAME CONFIRMATION:
Trend Bias from Higher Timeframes:
HTF 1 (Trend):
- Default: 1H timeframe
- Uses EMA to determine intermediate trend
- Compares current timeframe EMA to HTF EMA
HTF 2 (Bias):
- Default: 4H timeframe
- Uses 50 EMA for longer-term bias
- Confirms overall market direction
Bias Classifications:
- Bullish Bias: HTF close > HTF 50 EMA AND Current EMA > HTF1 EMA
- Bearish Bias: HTF close < HTF 50 EMA AND Current EMA < HTF1 EMA
- Neutral Bias: Mixed signals between timeframes
EMA Stack Analysis:
- Compares EMA alignment across timeframes
- +1: Bullish stack (lower TF EMA > higher TF EMA)
- -1: Bearish stack (lower TF EMA < higher TF EMA)
- 0: Neutral/crossed
Usage:
- Filters false breakouts
- Confirms trend direction
- Improves trade quality
EMA INTEGRATION:
Dynamic EMA for Trend Reference:
Features:
- Configurable period (default: 20)
- Customizable color and width
- Acts as dynamic support/resistance
- Trend filter for ORB trades
Application:
- Above EMA: Favor long breakouts
- Below EMA: Favor short breakouts
- EMA cross: Potential trend change
- Distance from EMA: Momentum gauge
SMART ALERT SYSTEM:
Quality-Filtered Breakout Notifications:
Alert Types:
1. Standard ORB Breakout
2. High Quality ORB Breakout
Quality Criteria:
- Volume Confirmation: Volume > 1.2x average
- MTF Confirmation: Bias aligned with breakout direction
Standard Alert:
- Basic breakout detection
- Price crosses ORH or ORL
- Icon: 🚀 (bullish) or 🔻 (bearish)
High Quality Alert:
- Both volume AND MTF confirmed
- Stronger probability setup
- Icon: 🚀⭐ (bullish) or 🔻⭐ (bearish)
Alert Information Includes:
- Alert quality rating
- Breakout level and current price
- Volume strength percentage (if enabled)
- MTF bias status (if enabled)
- Recommended action
One Alert Per Bar:
- Prevents alert spam
- Uses flag system to track sent alerts
- Resets on new ORB session
───────────────────────────────────────
HOW TO USE
───────────────────────────────────────
OPENING RANGE SETUP:
Basic Configuration:
1. Select time period for opening range (default: 15 minutes)
2. Choose fill color method (Breakout Direction recommended)
3. Enable historical data display if needed
Custom Range (Advanced):
1. Enable Custom Range toggle
2. Set specific session time (e.g., 0930-0945)
3. Select appropriate timezone
4. Useful for specific market opens (NYSE, LSE, etc.)
LIQUIDITY LEVELS SETUP:
Quick Configuration by Asset:
- Forex: Use default settings (Left=15, Right=5)
- Crypto: Set Left=12, Right=4, Display=7
- Gold: Set HTF=1D, Left=20
HTF Liquidity:
- Purpose: Major support/resistance levels
- Recommended: 4H for day trading, 1D for swing trading
- Use as profit targets or reversal zones
LTF Liquidity:
- Purpose: Entry/exit refinement
- Recommended: 1H for day trading, 4H for swing trading
- Use for position management
Mitigation Settings:
- Wick-based: More sensitive (default)
- Close-based: More conservative
- Remove or Show mitigated levels based on preference
TRADING SESSIONS SETUP:
Enable/Disable Sessions:
- Master toggle for all sessions
- Individual session controls
- Show/hide session names
Session High/Low Lines:
- Enable to see session extremes
- Each session has custom colors
- Useful for range trading
Customization:
- Adjust session times for your broker
- Set timezone to match your location
- Customize colors for visibility
VOLUME ANALYSIS SETUP:
Enable Volume Analysis:
1. Toggle on Volume Analysis
2. Set MA length (20 recommended)
3. Adjust spike multiplier (1.5 typical)
Usage:
- Confirm breakouts with volume
- Identify climactic moves
- Filter false signals
MULTI-TIMEFRAME SETUP:
HTF Selection:
- HTF 1 (Trend): 1H for day trading, 4H for swing
- HTF 2 (Bias): 4H for day trading, 1D for swing
Interpretation:
- Trade only with bias alignment
- Neutral bias: Be cautious
- Bias changes: Potential reversals
EMA SETUP:
Configuration:
- Period: 20 for responsive, 50 for smoother
- Color: Choose contrasting color
- Width: 1-2 for visibility
Usage:
- Filter trades: Long above, Short below
- Dynamic support/resistance reference
- Trend confirmation
ALERT SETUP:
TradingView Alert Creation:
1. Enable alerts in indicator settings
2. Enable ORB Breakout Alerts
3. Right-click chart → Add Alert
4. Select this indicator
5. Choose "Any alert() function call"
6. Configure delivery method (mobile, email, webhook)
Alert Filtering:
- All alerts include quality rating
- High Quality alerts = Volume + MTF confirmed
- Standard alerts = Basic breakout only
───────────────────────────────────────
TRADING STRATEGIES
───────────────────────────────────────
CLASSIC ORB STRATEGY:
Setup:
1. Wait for opening range to complete
2. Price breaks and closes above ORH or below ORL
3. Volume > average (if enabled)
4. MTF bias aligned (if enabled)
Entry:
- Bullish: Buy on break above ORH
- Bearish: Sell on break below ORL
- Consider retest entries for better risk/reward
Stop Loss:
- Bullish: Below ORL or range mid-point
- Bearish: Above ORH or range mid-point
- Adjust based on volatility
Targets:
- Initial: Range width extension (ORH + range width)
- Secondary: HTF liquidity levels
- Final: Session high/low or major support/resistance
ORB + LIQUIDITY CONFLUENCE:
Enhanced Setup:
1. Opening range established
2. HTF liquidity level near or beyond ORH/ORL
3. Breakout occurs with volume
4. Price targets the liquidity level
Entry:
- Enter on ORB breakout
- Target the HTF liquidity level
- Use LTF liquidity for position management
Management:
- Partial profits at ORB + range width
- Move stop to breakeven at LTF liquidity
- Final exit at HTF liquidity sweep
ORB REJECTION STRATEGY (Counter-Trend):
Setup:
1. Price breaks above ORH or below ORL
2. Weak volume (below average)
3. MTF bias opposite to breakout
4. Price closes back inside range
Entry:
- Failed bullish break: Short below ORH
- Failed bearish break: Long above ORL
Stop Loss:
- Beyond the failed breakout level
- Or beyond session extreme
Target:
- Opposite end of opening range
- Range mid-point for partial profit
SESSION-BASED ORB TRADING:
Tokyo Session:
- Typically narrower ranges
- Good for range trading
- Wait for London open breakout
London Session:
- Highest volume and volatility
- Strong ORB setups
- Major liquidity sweeps common
New York Session:
- Strong trending moves
- News-driven volatility
- Good for momentum trades
Sydney Session:
- Quieter conditions
- Suitable for range strategies
- Sets up Tokyo session
EMA-FILTERED ORB:
Rules:
- Only take bullish breaks if price > EMA
- Only take bearish breaks if price < EMA
- Ignore counter-trend breaks
Benefits:
- Reduces false signals
- Aligns with larger trend
- Improves win rate
───────────────────────────────────────
CONFIGURATION GUIDE
───────────────────────────────────────
OPENING RANGE SETTINGS:
Time Period:
- 15 min: Standard for most markets
- 30 min: Wider range, fewer breakouts
- 60 min: For slower markets or swing trades
Custom Range:
- Use for specific market opens
- NYSE: 0930-1000 EST
- LSE: 0800-0830 GMT
- Set timezone to match exchange
Historical Display:
- Enable: See all previous session data
- Disable: Cleaner chart, current session only
LIQUIDITY SETTINGS:
Left Bars (5-30):
- Lower: More frequent, sensitive levels
- Higher: Fewer, more significant levels
- Recommended: 15 for most markets
Right Bars (1-25):
- Confirmation period
- Higher: More reliable, less frequent
- Recommended: 5 for balance
Display Limit (1-20):
- Number of active levels shown
- Higher: More context, busier chart
- Recommended: 7 for clarity
Extension Options:
- Short: Levels visible near formation
- Current: Extended to current bar (recommended)
- Max: Extended indefinitely
VOLUME SETTINGS:
MA Length (5-50):
- Shorter: More responsive to spikes
- Longer: Smoother baseline
- Recommended: 20 for balance
Spike Multiplier (1.0-3.0):
- Lower: More sensitive spike detection
- Higher: Only extreme spikes
- Recommended: 1.5 for day trading
MULTI-TIMEFRAME SETTINGS:
HTF 1 (Trend):
- 5m chart: Use 15m or 1H
- 15m chart: Use 1H or 4H
- 1H chart: Use 4H or 1D
HTF 2 (Bias):
- One level higher than HTF 1
- Provides longer-term context
- Don't use same as HTF 1
EMA SETTINGS:
Length:
- 20: Responsive, more signals
- 50: Smoother, stronger filter
- 200: Long-term trend only
Style:
- Choose contrasting color
- Width 1-2 for visibility
- Match your trading style
───────────────────────────────────────
BEST PRACTICES
───────────────────────────────────────
Chart Timeframe Selection:
- ORB Trading: Use 5m or 15m charts
- Session Review: Use 1H or 4H charts
- Swing Trading: Use 1H or 4H charts
Quality Over Quantity:
- Wait for high-quality alerts (volume + MTF)
- Avoid trading every breakout
- Focus on confluence setups
Risk Management:
- Position size based on range width
- Wider ranges = smaller positions
- Use stop losses always
- Take partial profits at targets
Market Conditions:
- Best results in trending markets
- Reduce position size in choppy conditions
- Consider session overlaps for volatility
- Avoid trading near major news if inexperienced
Continuous Improvement:
- Track win rate by session
- Note which confluence factors work best
- Adjust settings based on market volatility
- Review performance weekly
───────────────────────────────────────
PERFORMANCE OPTIMIZATION
───────────────────────────────────────
This indicator is optimized with:
- max_bars_back declarations for efficient processing
- Conditional calculations based on enabled features
- Proper memory management for drawing objects
- Minimal recalculation on each bar
Best Practices:
- Disable unused features (sessions, MTF, volume)
- Limit historical display to reduce rendering
- Use appropriate timeframe for your strategy
- Clear old drawing objects periodically
───────────────────────────────────────
EDUCATIONAL DISCLAIMER
───────────────────────────────────────
This indicator combines established trading concepts:
- Opening Range Breakout theory (price action)
- Liquidity level detection (pivot analysis)
- Session-based trading (time-of-day patterns)
- Volume analysis (confirmation technique)
- Multi-timeframe analysis (trend alignment)
All calculations use standard technical analysis methods:
- Pivot high/low detection algorithms
- Moving averages for trend and volume
- Session time filtering
- Timeframe security functions
The indicator identifies potential trading setups but does not predict future price movements. Success requires proper application within a complete trading strategy including risk management, position sizing, and market context.
───────────────────────────────────────
USAGE DISCLAIMER
───────────────────────────────────────
This tool is for educational and analytical purposes. Opening Range Breakout trading involves substantial risk. The alert system and quality filters are designed to identify potential setups but do not guarantee profitability. Always conduct independent analysis, use proper risk management, and never risk capital you cannot afford to lose. Past performance does not indicate future results. Trading intraday breakouts requires experience and discipline.
───────────────────────────────────────
CREDITS & ATTRIBUTION
───────────────────────────────────────
ORIGINAL SOURCE:
This indicator builds upon concepts from LuxAlgo's-ORB

Double Weighted Moving Average (DWMA)# DWMA: Double Weighted Moving Average
## Overview and Purpose
The Double Weighted Moving Average (DWMA) is a technical indicator that applies weighted averaging twice in sequence to create a smoother signal with enhanced noise reduction. Developed in the late 1990s as an evolution of traditional weighted moving averages, the DWMA was created by quantitative analysts seeking enhanced smoothing without the excessive lag typically associated with longer period averages. By applying a weighted moving average calculation to the results of an initial weighted moving average, DWMA achieves more effective filtering while preserving important trend characteristics.
## Core Concepts
* **Cascaded filtering:** DWMA applies weighted averaging twice in sequence for enhanced smoothing and superior noise reduction
* **Linear weighting:** Uses progressively increasing weights for more recent data in both calculation passes
* **Market application:** Particularly effective for trend following strategies where noise reduction is prioritized over rapid signal response
* **Timeframe flexibility:** Works across multiple timeframes but particularly valuable on daily and weekly charts for identifying significant trends
The core innovation of DWMA is its two-stage approach that creates more effective noise filtering while minimizing the additional lag typically associated with longer-period or higher-order filters. This sequential processing creates a more refined output that balances noise reduction and signal preservation better than simply increasing the length of a standard weighted moving average.
## Common Settings and Parameters
| Parameter | Default | Function | When to Adjust |
|-----------|---------|----------|---------------|
| Length | 14 | Controls the lookback period for both WMA calculations | Increase for smoother signals in volatile markets, decrease for more responsiveness |
| Source | close | Price data used for calculation | Consider using hlc3 for a more balanced price representation |
**Pro Tip:** For trend following, use a length of 10-14 with DWMA instead of a single WMA with double the period - this provides better smoothing with less lag than simply increasing the period of a standard WMA.
## Calculation and Mathematical Foundation
**Simplified explanation:**
DWMA first calculates a weighted moving average where recent prices have more importance than older prices. Then, it applies the same weighted calculation again to the results of the first calculation, creating a smoother line that reduces market noise more effectively.
**Technical formula:**
```
DWMA is calculated by applying WMA twice:
1. First WMA calculation:
WMA₁ = (P₁ × w₁ + P₂ × w₂ + ... + Pₙ × wₙ) / (w₁ + w₂ + ... + wₙ)
2. Second WMA calculation applied to WMA₁:
DWMA = (WMA₁₁ × w₁ + WMA₁₂ × w₂ + ... + WMA₁ₙ × wₙ) / (w₁ + w₂ + ... + wₙ)
```
Where:
- Linear weights: most recent value has weight = n, second most recent has weight = n-1, etc.
- n is the period length
- Sum of weights = n(n+1)/2
**O(1) Optimization - Inline Dual WMA Architecture:**
This implementation uses an advanced O(1) algorithm with two complete inline WMA calculations. Each WMA uses the dual running sums technique:
1. **First WMA (source → wma1)**:
- Maintains buffer1, sum1, weighted_sum1
- Recurrence: `W₁_new = W₁_old - S₁_old + (n × P_new)`
- Cached denominator norm1 after warmup
2. **Second WMA (wma1 → dwma)**:
- Maintains buffer2, sum2, weighted_sum2
- Recurrence: `W₂_new = W₂_old - S₂_old + (n × WMA₁_new)`
- Cached denominator norm2 after warmup
**Implementation details:**
- Both WMAs fully integrated inline (no helper functions)
- Each maintains independent state: buffers, sums, counters, norms
- Both warm up independently from bar 1
- Performance: ~16 operations per bar regardless of period (vs ~10,000 for naive O(n²) implementation)
**Why inline architecture:**
Unlike helper functions, the inline approach makes all state variables and calculations visible in a single scope, eliminating function call overhead and making the dual-pass nature explicit. This is ideal for educational purposes and when debugging complex cascaded filters.
> 🔍 **Technical Note:** The dual-pass O(1) approach creates a filter that effectively increases smoothing without the quadratic increase in computational cost. Original O(n²) implementations required ~10,000 operations for period=100; this optimized version requires only ~16 operations, achieving a 625x speedup while maintaining exact mathematical equivalence.
## Interpretation Details
DWMA can be used in various trading strategies:
* **Trend identification:** The direction of DWMA indicates the prevailing trend
* **Signal generation:** Crossovers between price and DWMA generate trade signals, though they occur later than with single WMA
* **Support/resistance levels:** DWMA can act as dynamic support during uptrends and resistance during downtrends
* **Trend strength assessment:** Distance between price and DWMA can indicate trend strength
* **Noise filtering:** Using DWMA to filter noisy price data before applying other indicators
## Limitations and Considerations
* **Market conditions:** Less effective in choppy, sideways markets where its lag becomes a disadvantage
* **Lag factor:** More lag than single WMA due to double calculation process
* **Initialization requirement:** Requires more data points for full calculation, showing more NA values at chart start
* **Short-term trading:** May miss short-term trading opportunities due to increased smoothing
* **Complementary tools:** Best used with momentum oscillators or volume indicators for confirmation
## References
* Jurik, M. "Double Weighted Moving Averages: Theory and Applications in Algorithmic Trading Systems", Jurik Research Papers, 2004
* Ehlers, J.F. "Cycle Analytics for Traders," Wiley, 2013
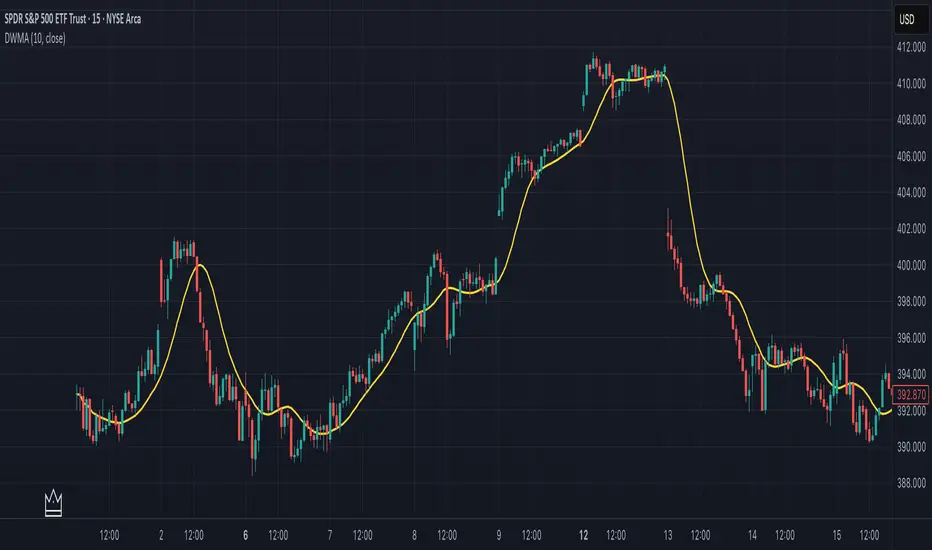
ADX and DI deltaJust a small adjustment to a well known indicator, the ADX with +DI and -DI.
I've always been annoyed of how cluttered this indicator is, specially do to the increasing gap between +DI and -DI, so I changed it up a bit.
ADX line has not been adjusted
+DI and -DI have now merged into deltaDI
deltaDI changes color depending on which value is higher (+DI > -DI = green line, else red line)
Plots a dashed 0 line (not editable)
Plots a two dotted lines at value 20 and 25 (editable)
Plots a label above/below price on the chart if the trend is exhausted and might end. (can be disabled)
Now you only have the ADX line together with a delta line.
The delta line is the gap between +DI and -DI and will change color depending on which one is highest and controlling the trend.
+DI = green line
-DI = red line
I've also added both a 20 and 25 horizontal dotted line.
Normally ADX should be 25 or higher to start a trend, but I do know a lot of people like to be greedy and jump in early in the trend build-up.
A dashed 0 line has been added, just because I felt like it. If either the ADX or delta ever cross below it without you editing the script yourself, just delete the script as it clearly doesn't do its job.
A red label_down will be plotted above the price when the ADX starts curling down and +DI > -DI. This indicates at best a breather for a bullish up trend or a possible reversal.
A red label_down will be plotted above the price if the ADX is above 25 and starts curling down while +DI > -DI. This indicates at best a breather for a bullish up trend or a possible reversal.
A green label_up will be plotted below the price if the ADX is above 25 and starts curling down while -DI > +DI. This indicates at best a breather for a bearish down trend or a possible reversal.
Enjoy my take on the indicator.
Volume Surge by MashrabThe "Volume Surge" indicator is like a simple market health checkup. It looks at how much of an asset (like a stock or crypto) is being traded right now and compares it to the recent past. Think of it as a way to quickly see if interest in that asset is suddenly spiking, fading, or staying the same.
The indicator shows this information in an easy-to-read table right on your chart.
How it works:
The indicator keeps track of two main things for you:
Current Volume: The total trading volume over the last "N" days (or whatever time period you choose).
Previous Volume: The total trading volume over the period right before that
Then, it gives you a summary:
The "Ratio" tells you how many times bigger or smaller the current volume is.
The "Percent Change" shows the percentage jump in volume.
How to use it:
This indicator helps you see when something interesting might be happening. Here are a few ways traders use it:
Confirm Breakouts: If a stock breaks above a key price level and the indicator shows a huge volume surge, it’s a stronger signal that the move is real and not a false alarm.
Spot Reversals: If a stock has been trending up but the volume starts to drop off, it could mean the trend is losing steam. A sudden, massive volume surge on a down day might indicate panic selling, which can sometimes happen right before the price turns around.
Check Trend Strength: A healthy trend usually has increasing volume going in the same direction. For example, if a stock is in an uptrend, you want to see lots of volume on the days it goes up.
This indicator isn't a crystal ball, but it's a great tool for understanding the "who" and "how much" behind a price move. It helps you see when a price change is backed by a lot of market activity, which often makes the move more trustworthy.

FCBI Brake PressureBrake Pressure (FCBI − USIRYY)
Concept
The Brake Pressure indicator quantifies whether the bond market is braking or releasing liquidity relative to real yields (USIRYY).
It is derived from the Financial-Conditions Brake Index (FCBI) and expresses the balance between long-term yield pressure and real-rate dynamics.
Formula
Brake Pressure = FCBI − USIRYY
where FCBI = (US10Y) − (USINTR) − (CPI YoY)
Purpose
While FCBI measures the intensity of financial-condition pressure, Brake Pressure shows when that brake is being applied or released.
It captures the turning point of liquidity transmission in the financial system.
How to Read
Brake Pressure < 0 (orange) → Brake engaged → financial conditions tighter than real-rate baseline; liquidity constrained.
Brake Pressure ≈ 0 → Neutral zone → transition phase between tightening and easing.
Brake Pressure > 0 (teal) → Brake released → financial conditions looser than real-rate baseline; liquidity flows freely → late-cycle setup before recession.
Zero-Cross Logic
Cross ↑ above 0 → FCBI > USIRYY → brake released → liquidity acceleration → typically 6–18 months before recession.
Cross ↓ below 0 → FCBI < USIRYY → brake re-engaged → tightening resumes.
Historical Behavior
Each major U.S. recession (2001, 2008, 2020) was preceded by a Brake Pressure cross above zero after a negative phase, signaling that long yields had stopped resisting Fed cuts and liquidity was expanding.
Practical Use
• Identify late-cycle turning points and liquidity inflection phases.
• Combine with FCBI for a complete macro transmission picture.
• Watch for sustained positive readings as early macro-recession warnings.
Current Example (Oct 2025)
FCBI ≈ −3.1, USIRYY ≈ +3.0 → Brake Pressure ≈ −6.1 → Brake still engaged. When this crosses above 0, it signals that liquidity is free flowing and the recession countdown has begun.
Summary
FCBI shows how tight the brake is. Brake Pressure shows when the brake releases.
When Brake Pressure > 0, the system has entered the liquidity-expansion phase that historically precedes a U.S. recession.