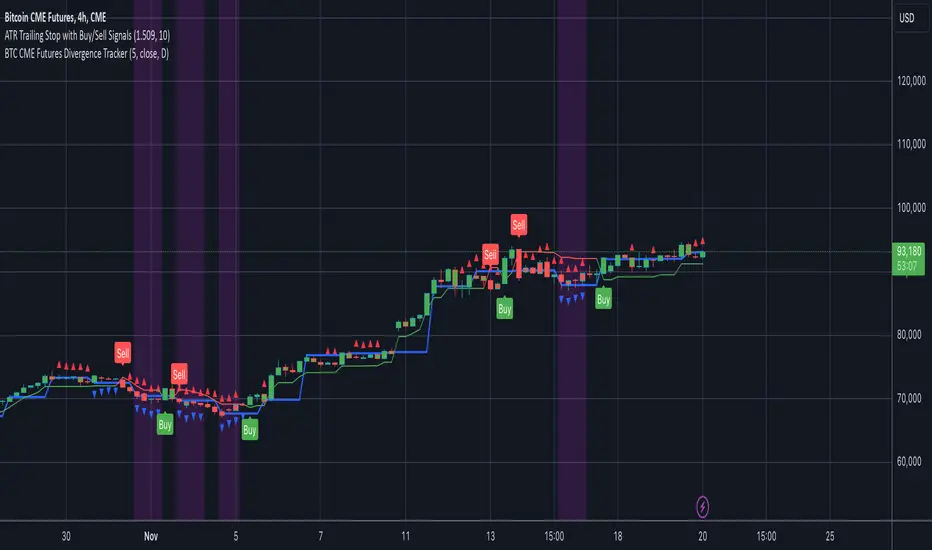
BTC CME Futures Divergence TrackerThis script tracks divergences between price action and open interest for the BTC CME Futures contract (symbol "BTC1!") using the following components:
Key Features:
1. Price Analysis: Identifies lower highs in the price over a specified lookback period. Marks these points with red upward-facing triangles above the bars.
2. Open Interest Analysis: Retrieves open interest (OI) data for the BTC CME Futures contract via request.security. Detects lower highs in open interest over the same lookback period. Highlights these points with blue downward-facing triangles below the bars.
3. Divergence Detection: A divergence is identified when both price and open interest form lower highs simultaneously. Highlights such occurrences with a purple background, indicating potential bearish sentiment or weakening momentum.
4. Alerts: If divergences are detected, an alert is triggered (if enabled), notifying the trader to take action.
5. Visualization: Open interest is plotted as a blue line in a separate pane for added context. Red and blue markers highlight significant points in price and open interest trends.
Use Cases:
- Spot Weakening Trends: Divergences between price and open interest may indicate a loss of momentum or bearish sentiment, allowing traders to preemptively adjust their strategies.
- Monitor Institutional Activity: Open interest changes reflect shifts in market participation, especially in derivative markets like CME Futures.
- Set Alerts for Key Signals: With automated alerts, traders can stay informed of potential divergence signals without constant monitoring.
Customization Options:
- Lookback Period: Adjust the number of bars used to detect lower highs.
- Timeframe: Choose the timeframe for fetching open interest data (e.g., daily, hourly).
- Alert Activation: Enable or disable alerts for divergences.
This tool combines price action with open interest dynamics to provide a robust method for identifying market trends and potential reversals in BTC CME Futures.
Search in scripts for "harmonic"
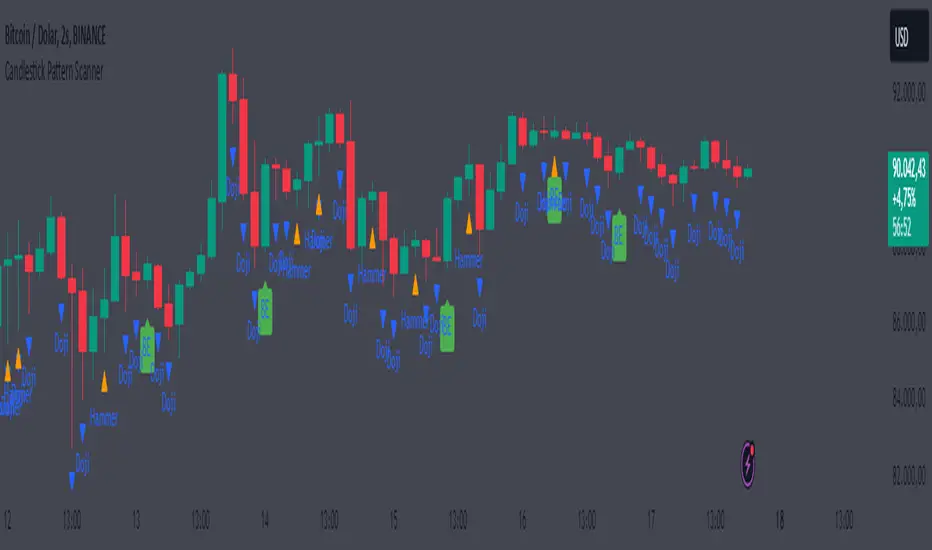
Candlestick Pattern ScannerCandlestick Pattern Scanner
This indicator identifies popular candlestick patterns on the chart and provides visual and alert-based support for traders. Based on technical analysis, it provides insights into potential trend reversals or continuation signals in price action. The following patterns are detected and marked:
1. Bullish Engulfing
Definition: Considered a strong bullish signal. A small red candle is followed by a large green candle that completely engulfs the previous one.
Chart Display: Marked with a green arrow below the price bar.
Alert Message: "Bullish Engulfing Pattern Detected!"
2. Bearish Engulfing
Definition: Considered a strong bearish signal. A small green candle is followed by a large red candle that completely engulfs the previous one.
Chart Display: Marked with a red arrow above the price bar.
Alert Message: "Bearish Engulfing Pattern Detected!"
3. Doji
Definition: Indicates indecision in the market. The candlestick has an opening and closing price that are almost the same, forming a very small body.
Chart Display: Marked with a blue triangle below the price bar.
Alert Message: "Doji Pattern Detected!"
4. Hammer
Definition: Can signal a strong bullish reversal. It has a long lower shadow and a small body, often appearing at the end of a downtrend.
Chart Display: Marked with an orange triangle below the price bar.
Alert Message: "Hammer Pattern Detected!"
5. Shooting Star
Definition: Can signal a strong bearish reversal. It has a long upper shadow and a small body, often appearing at the end of an uptrend.
Chart Display: Marked with a purple triangle above the price bar.
Alert Message: "Shooting Star Pattern Detected!"
Features:
Visual Support: Patterns are clearly marked on the chart using distinct shapes (arrows and triangles).
Alerts: Receive real-time notifications through TradingView’s alert system when a pattern is detected.
Versatility: Useful for identifying both trend reversals and continuation signals.
User-Friendly: Patterns are easily distinguishable with unique color coding.
Purpose:
This indicator helps traders identify potential reversal points or strong trend beginnings in price action. It can be used as a supportive tool in scalping, swing trading, or long-term investment strategies.
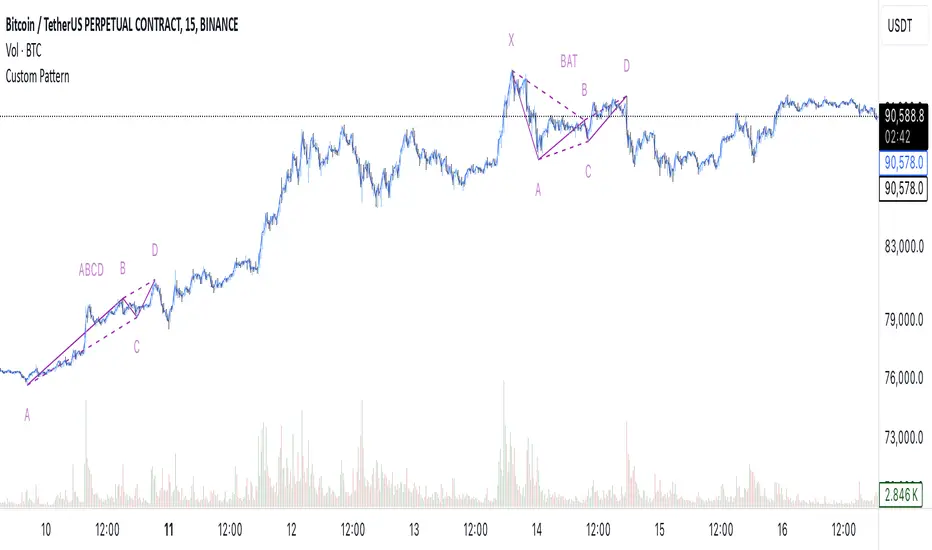
[EmreKb] Custom PatternCustom Pattern
With this indicator, you can create and display as many patterns as you want on the chart. The indicator works by taking two inputs. We can start the explanation by describing these inputs.
Inputs
Zigzag Length: Length for zigzag legs.
Patternscript Code: Patternscript code. (But what is patternscript?)
Explanation Of Patternscript
Patternscript (it's a completely fictional script language) is a scripting language that allows you to write your own patterns, and it operates within Pinescript). Let's take a look at the syntax of this language.
{
(, )
}
...
This means that the Fibonacci levels drawn from the from_point to the to_point must have the target_point between the min_fib_level and max_fib_level .
Let's see a few practical examples.
Patternscript Code For ABCD Pattern
ABCD{
ABC(0.618, 0.886)
BCD(1.272, 1.618)
}
ABC(0.618, 0.886): Fibonacci drawn from the A to B, must have the C between the 0.618 and 0.886
BCD(1.272, 1.618): Fibonacci drawn from the B to C, must have the D between the 1.272 and 1.618
Patternscript Code For Multiple Pattern
BAT{
XAB(0.382, 0.5)
ABC(0.382, 0.886)
BCD(1.618, 2.618)
XAD(0.382, 0.886)
}
ABCD{
ABC(0.618, 0.886)
BCD(1.272, 1.618)
}
Notes:
You can set the pattern name as you like, this is not related to the pattern rules.
There is no limit for pattern count, but remember pine limits.
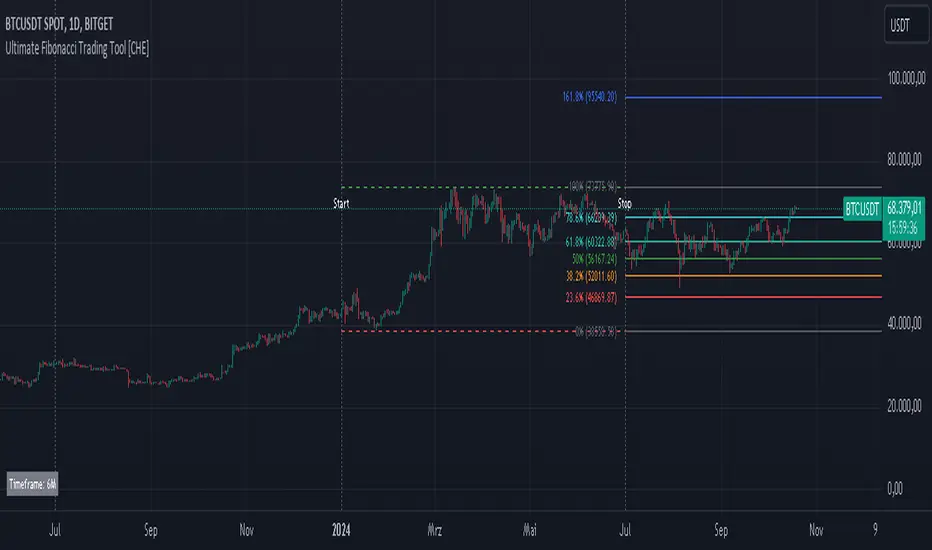
Ultimate Fibonacci Trading Tool [CHE]Ultimate Fibonacci Trading Tool – Your Key to More Precise Trading Decisions!
Description:
Discover the Ultimate Fibonacci Trading Tool , a powerful instrument designed to revolutionize your technical analysis. This tool is crafted to assist traders of all experience levels in better understanding market movements and making informed decisions. By utilizing a higher reference period from the past, it provides you with a clear advantage in identifying critical support and resistance levels.
🌟 Key Features in Detail:
1. Automatic Timeframe Selection:
- Auto Timeframe: The tool automatically detects the optimal higher reference period based on your current chart, providing more precise analysis without additional effort.
- Multiplier Mode: Define the higher timeframe using a multiplier. By default set to 5, this can be adjusted to suit your individual needs.
- Manual Selection: For maximum control, you can manually select the desired timeframe.
2. Customizable Fibonacci Levels:
- Enable/Disable Levels: Toggle specific Fibonacci levels (e.g., 0.236, 0.382, 0.5, 0.618, etc.) on or off to personalize your analysis.
- User-Defined Values: Input custom numerical values for each level to support specialized Fibonacci calculations.
- Color Customization: Choose individual colors for each level to keep your charts clear and visually appealing.
3. Automatic Trend Detection:
- The tool automatically identifies whether the market is in a bullish or bearish trend and adjusts the Fibonacci calculations accordingly, ensuring you always have the most relevant information at hand.
4. Period Separators with Start and Stop Labels:
- Customizable Separator Lines: Visualize the beginning of new time periods with lines that you can customize in style, color, and width.
- Start/Stop Labels: Clear markers help you instantly recognize critical time points and potential trend changes.
5. Flexible Label Management:
- Display Styles: Decide how Fibonacci levels are presented—percentage, price level, or both—so you get the information most important to you.
- Size Adjustment: Modify the size of the labels to optimize readability on your chart.
- Positioning: Place labels where they make the most sense for your analysis.
6. Informative Time Period Display:
- Customizable Info Box: Keep track of the reference period used with a customizable information box displayed directly on your chart.
- Layout Options: Determine the size, position, background, and text colors for seamless integration into your chart environment.
🔧 Detailed Settings Options:
- Timeframe Selection:
- Timeframe Type: Choose between "Auto Timeframe," "Multiplier," or "Manual" to control how the reference period is calculated.
- Multiplier: Set the multiplier when using the "Multiplier" mode; this value determines how many units of the current timeframe are used as the reference.
- Manual Resolution: If "Manual" is selected, you can input the exact timeframe (e.g., "60," "1D," "1W").
- Fibonacci Level Settings:
- Enabling Individual Levels: Toggle each Fibonacci level on or off according to your preference.
- Adjusting Level Values: Enter custom numerical values for each level to perform specialized calculations.
- Color Selection: Choose a unique color for each level to ensure clear differentiation.
- Period Separator Settings:
- Separator Color: Define the color of the separator lines to make them distinctly visible.
- Separator Style: Choose between "Solid," "Dashed," or "Dotted" to adjust the style of the separator lines.
- Separator Width: Set the width of the separator lines to match your chart aesthetics.
- Label Management:
- Label Style: Select how labels are displayed:
- Default: Shows both percentage and price.
- None: No labels are displayed.
- Percentage: Shows only the Fibonacci level percentage.
- Price: Shows only the price at the Fibonacci level.
- Label Size: Adjust the size of the labels (tiny, small, normal, large, huge) for optimal readability.
- Time Period Display:
- Show Time Period: Enable or disable the information box displaying the reference period.
- Size: Choose the size of the information box (tiny, small, normal, large, huge, auto).
- Positioning: Set the vertical (top, middle, bottom) and horizontal (left, center, right) position of the box.
- Color Customization: Select the background and text color of the information box to integrate it into your chart design.
📈 Why Is the Higher Reference Period Important?
The Ultimate Fibonacci Trading Tool leverages a higher reference period from the past to calculate Fibonacci levels. This approach offers several advantages:
- Deeper Market Analysis: By considering longer timeframes, you can uncover major market movements and trends that might be hidden in shorter periods.
- More Accurate Support and Resistance Levels: Higher timeframes provide more robust Fibonacci levels that are observed by many market participants.
- Better Decision-Making Foundation: With a comprehensive view of the market, you can make more informed trading decisions and minimize potential risks.
🎯 How This Tool Enhances Your Trading Strategy:
- Increased Efficiency: Automate complex calculations and save valuable time.
- Personalized Analysis: Adapt the tool to your individual needs and strategies.
- Enhanced Precision: Utilize precise Fibonacci levels to better determine entry and exit points.
- Improved Market Insight: Gain deeper understanding of market trends and structures by using higher timeframes.
🚀 Get Started Now!
Don't miss the opportunity to revolutionize your chart analysis. Integrate the Ultimate Fibonacci Trading Tool into your trading routine and benefit from more precise analyses and improved trading decisions.
Disclaimer
The content provided, including all code and materials, is strictly for educational and informational purposes only. It is not intended as, and should not be interpreted as, financial advice, a recommendation to buy or sell any financial instrument, or an offer of any financial product or service. All strategies, tools, and examples discussed are provided for illustrative purposes to demonstrate coding techniques and the functionality of Pine Script within a trading context.
Any results from strategies or tools provided are hypothetical, and past performance is not indicative of future results. Trading and investing involve high risk, including the potential loss of principal, and may not be suitable for all individuals. Before making any trading decisions, please consult with a qualified financial professional to understand the risks involved.
By using this script, you acknowledge and agree that any trading decisions are made solely at your discretion and risk.
Best regards
Chervolino
Fibonacci Retracement Levels (Horizontal)With this, you should be able to see the Fibonacc-i retracement levels plotted as horizontal lines on your chart. If needed, you can adjust the len parameter to increase or decrease the lookback period used to calculate the high and low points.
Horizontal Lines: I've added horizontal lines for each Fibonacci retracement level (0%, 23.6%, 38.2%, 50%, 61.8%, 100%), starting from the current bar index to ensure they extend horizontally across the chart.
Labels: Labels are now placed on the right side of the chart for each level so you can easily identify the Fibonacci levels.

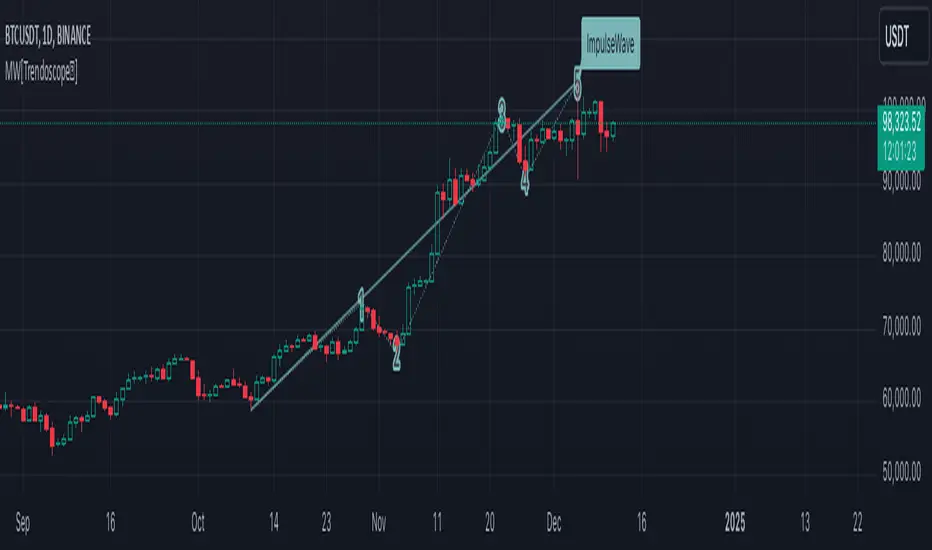
Motive Wave Scanner [Trendoscope®]Motive Wave Scanner is a simple algorithm to find out motive waves as per the rules of Elliott Wave theory.
It is an extension to our previous open source script Interactive Motive Wave Checklist which provides interactive capability to select six points of a five wave formation. Once users select them, the rules of motive waves are applied to manually selected points to highlight them as either diagonal wave, motive wave or none.
This indicator does the same. But, instead of requesting the pivots manually from the user, the indicator automatically picks and scans them through zigzag.
We have already published a similar script as protected source. But, due to some changes in the pine engine, there have been few issues in the runtime. In this publication, we not only address those runtime issues but also making it open source for the users to make use of the source code and enhance it further.
🎲 What are motive waves
Motive waves are strong upward or downward movement with 5 subwaves.
Motive Wave in the upward direction will start with Swing High, Ends with Swing High and consists of 3 Higher Highs and 2 Higher Lows representing strong upward trend.
Motive Wave in the downward direction will start with Swing Low, Ends with Swing low and consists of 3 Lower Lows and 2 Lower Highs representing strong downward trend.
🎲 Types of Motive Waves
Motive Waves are broadly classified by two types:
Impulse Waves
Diagonal Waves
Diagonal Waves are further classified into Contracting and Expanding Diagonals. These can fall into the category of either leading diagonal and ending diagonal.
🎲 Rules of Motive Waves
🎯 Generic Rule of any motive waves are as follows
Should consist of 5 alternating waves. (Swing High followed by Swing low and vice versa)
This can start from Swing High and end in Swing High or start from Swing Low and end in Swing Low of a zigzag.
Wave-2 should not move beyond Wave-1. This means, the Wave-2 is always shorter than Wave-1 with respect to distance between the price of start and end.
Wave-3 always moves beyond Wave-1. This means, the Wave-3 is always longer than Wave-2 in terms of price
Among Wave-1, Wave-3, and Wave-5, Wave-3 is never the shortest one. This means, either Wave-1 or Wave-5 can be longer than Wave-3 but not both. Wave-3 can also be longest among the three.
Here is the pictorial representation of the rules of the Motive Waves
For a wave to be considered as motive wave, it also needs to follow the rules of either impulse or diagonal waves.
🎯 Rules for a 5 wave pattern to be considered as Impulse Wave are:
Wave-4 never overlaps with Wave-1 price range
Wave-1, Wave-3 and Wave-5 should not be either expanding or contracting. Meaning, we cannot have Wave-1 > Wave-3 > Wave-5 , and we cannot have Wave-1 < Wave-3 < Wave-5
Pictorial representation of the impulse wave rules are as below:
🎯 Rules for the Diagonal Waves are as follows
Contrary to the first rule of impulse wave, in case of diagonal wave, Wave-4 always overlaps with Wave-1 price range. But, it will not go beyond Wave-3
Waves are progressively expanding or contracting - Wave1 > Wave3 > Wave5 and Wave2 > Wave4 to be contracting diagonal. Wave1 < Wave3 < Wave5 and Wave2 < Wave4 to be expanding diagonal wave.
Pictorial representation of the Contracting Diagonal Wave is as below. Here, the Wave-1, Wave-3 and Wave-5 are in contracting formation.
Pictorial representation of the Expanding Diagonal Wave is as below. Here, the Wave-1, Wave-3 and Wave-5 are in expanding formation.
🎲 Indicator Settings
Indicator settings are defined as below:
Repaint Warning : If Repaint is selected, the indicator will throw a runtime error after certain bars or when alerts are set. This is due to some pine internal issue. At present, we do not have any solution for this until the internal issue is resolved by Tradingview Pine Team.
Custom Pattern DetectionOverview
Chart Patterns is a major tool for many traders. Pattern formation at specific location on the chart is used for investment/trading decisions.
This indicator is designed in a way to allow investors/traders to define patterns of their choice based on certain input parameters and then detect defined pattern on the chart.
Investors/traders can use their own creativity to create and detect patterns.
This indicator works in 2 modes
Create Pattern: One can define a pattern and verify sample pattern formation visually
Detect Pattern: Detect and mark patterns on the chart
Settings
Create Custom Pattern:
Show Custom Pattern – This will mark the pattern lines on the chart so that one can verify how pattern appears based on the input’s parameters provided for lines XA, AB, BC, CD, DE, EF
Offset – Used while pattern creation. Offset is horizonal distance between 2 lines.
XA Points – Used to draw XA line when sample pattern is drawn. XA points can be a negative or position number.
XA line is drawn based on Offset and XA Points. E.g. Offset = 5 and XA Points = -20. In this line would be drawn from last candle high to high – 20 (these are y1 and y2 points of a line). While drawing line distance of 5 candles would be placed between 2 line points (these are x1 and x2 points of a line). In XA line X forms start point and A forms end point of the line.
Line AB – Line AB is drawn from point X. To derive the end point of AB, average Fib% is derived based on From Fib% and To Fib% parameters. Finally end point is derived by applying Fib Retracement on Line XA based on average Fib%.
Line AB to Line EF – These points are derived as explained in Line AB.
The indicator can be used to define/create patterns up to 6 legs/lines. The line would be named as XA -> AB -> BC -> CD -> DE -> EF.
If one wish to create pattern consisting 3 legs then it can be achieved by unchecking/deselecting Line CD, DE and EF or by checking only Line AB and BC.
Based on the parameters above indicator draws a sample pattern after last candle/bar on the chart. Sample pattern helps to visually see how pattern will appear on the chart.
Pattern Identification
Indicator derive the swing high/low points based on the Pivot lookback and use as reference points while detecting patterns.
Use of From Fib% and To Fib% - While detecting pattern, retracement price points are derived for From Fib% and To Fib%. Price points between from Fib% and To Fib% are treated as valid retracement points.
How to configure and use indicator for detecting patterns
Sample Pattern 1
Sample Pattern 2
Sample Pattern 3
Sample Pattern 4

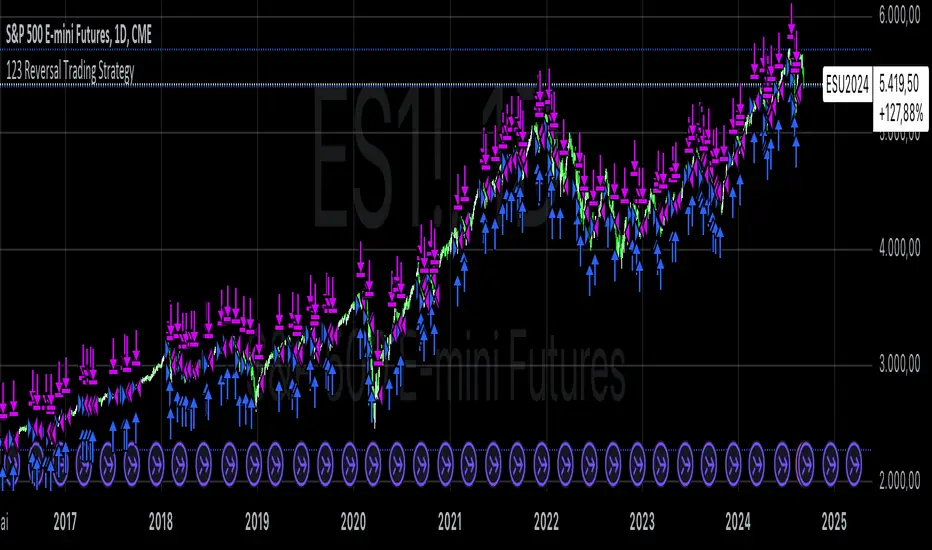
123 Reversal Trading StrategyThe 123 Reversal Trading Strategy is a technical analysis approach that seeks to identify potential reversal points in the market by analyzing price patterns. This Pine Script™ code implements a version of this strategy, and here’s a detailed description:
Strategy Overview
Objective: The strategy aims to identify bullish reversal patterns using the 123 pattern and manage trades with a specified holding period and a 20-day moving average as an additional exit condition.
Key Components:
Holding Period: The number of days to hold a trade is adjustable, with the default set to 7 days.
Moving Average: A 200-day simple moving average (SMA) is used to determine an exitcondition based on the price crossing this average.
Pattern Recognition:
Condition 1: The low of the current day must be lower than the low of the previous day.
Condition 2: The low of the previous day must be lower than the low from three days ago.
Condition 3: The low two days ago must be lower than the low from four days ago.
Condition 4: The high two days ago must be lower than the high three days ago.
Entry Condition: All four conditions must be met for a buy signal.
Exit Condition: The position is closed either after the specified holding period or when the price reaches or exceeds the 200-day moving average.
Relevant Literature
Graham, B., & Dodd, D. L. (1934). Security Analysis. This classic work introduces fundamental analysis and technical analysis principles which are foundational to understanding patterns like the 123 reversal.
Murphy, J. J. (1999). Technical Analysis of the Financial Markets. Murphy provides an extensive overview of technical indicators and chart patterns, including reversal patterns similar to the 123 pattern.
Elder, A. (1993). Trading for a Living. Elder discusses various trading strategies and technical analysis techniques that complement the understanding of reversal patterns and their application in trading.
Risks and Considerations
Pattern Reliability: The 123 reversal pattern, like many technical patterns, is not foolproof. It can generate false signals, especially in volatile or trending markets. This may lead to losses if the pattern does not play out as expected.
Market Conditions: The strategy may perform differently under various market conditions. In strongly trending markets, reversal patterns might not be as reliable.
Lagging Indicators: The use of the 200-day moving average as an exit condition can be considered a lagging indicator. This means it reacts to price movements with a delay, which might result in late exits and missed profit opportunities.
Holding Period: The fixed holding period of 7 days may not be optimal for all market conditions or stocks. It is essential to adjust the holding period based on market dynamics and individual stock behavior.
Overfitting: The parameters used (like the number of days and moving average length) are set based on historical data. Overfitting can occur if these parameters are tailored too specifically to past data, leading to reduced performance in future scenarios.
Conclusion
The 123 Reversal Trading Strategy is designed to identify potential market reversals using specific conditions related to price lows and highs. While it offers a structured approach to trading, it is essential to be aware of its limitations and potential risks. As with any trading strategy, it should be tested thoroughly in various market conditions and adjusted according to the individual trading style and risk tolerance.
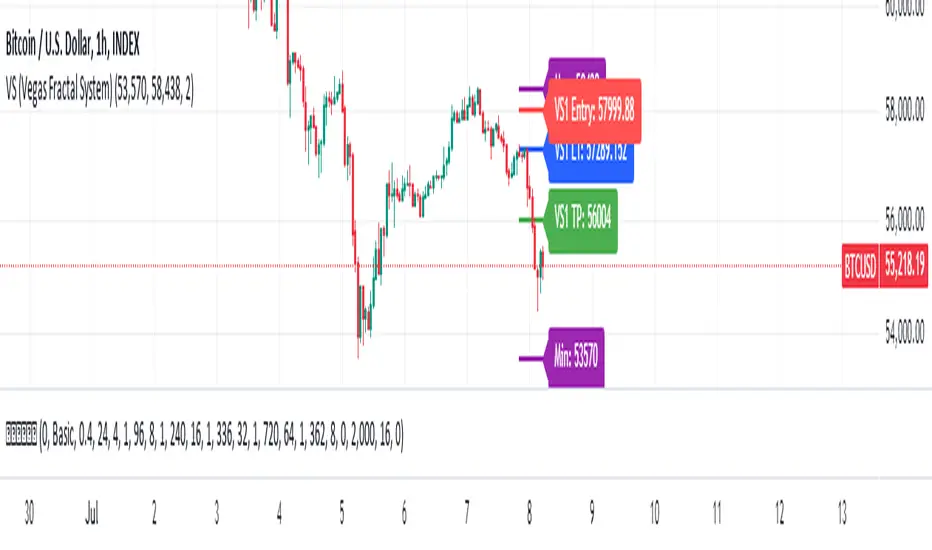
VS (Vegas Fractal System)VS is a trading system based on the identification of fractal reaction zones within a larger, carefully identified movement. It is internally made up of 4 sub-systems.
The indicator is composed of the following parameters: Max and Min, are the largest area identified and will act as the STOPLOSS point. L1, is the price reaction level. Entry, is where to place a pending market entry order. TP, is the place to place a 100% sell order.
A valid area must be identified through the Fibonacci levels that join Highs and Lows or vice versa depending on the bullish or bearish movement. To be usable, this movement must not have a sub-movement that has already hit the 0.618 level.
Always manage Risk and Money Management in an adequate, technical and sustainable manner in relation to your capital. A fair exposure per transaction is between 1% and 2% of the capital.
Magic Linear Regression Channel [MW]Introduction
The Magic Linear Regression Channel indicator provides users with a way to quickly include a linear regression channel ANYWHERE on their chart, in order to find channel breakouts and bounces within any time period. It uses a novel method that allows users to adjust the start and end period of the regression channel in order to quickly make adjustments faster, with fewer steps, and with more precision than with any other linear regression channel tool. It includes Fibonacci bands AND a horizontal mode in order for users to quickly define significant price levels based on the high, low, open, and close prices defined by the start period.
Settings
Start Time: This is initially MANUALLY SELECTED ON THE CHART when the indicator is first loaded.
End time: This is also initially MANUALLY SELECTED ON THE CHART when the indicator is first loaded.
Horizontal Line: This forces the baseline to be horizontal. The band distance is defined by the maximum price distance from the band.
Horizontal Line Type: This snaps the horizontal line to the close, high, low, or open price. Or, it can also use a regression calculation for the selected time period to define the y-position of the line.
Extend Line N Bars: How many bars to the left in which to extend the baseline and bands.
Show Baseline ONLY!!: Removes all lines except the baseline and it’s extension.
Add Half Band: Includes a band that is half the distance between the baseline and the top and bottom bands
Add Outer Fibonacci Band: Includes a band that is 1.618 (phi) times the default band distance
Add Inner Fibonacci Band - Upper: Includes a band that is 0.618 (1/phi) times the default band distance
Add Inner Fibonacci Band - Lower: Includes a band that is 0.382 (1 - 1/phi) times the default band distance
Calculations
This indicator uses the least squares approach for generating a straight regression line, which can be reviewed at Wikipedia’s “Simple Linear Regression” page. It sums all of the x-values, and y-values, as well as the sum of the product of corresponding x and y values, and the sum of the squares of the x-values. These values are used to calculate the slope and intercept using the following equations:
slope = (n * sum_xy - sum_x * sum_y) / (n * sum_xx - sum_x * sum_x)
And
intercept = (sum_y - slope * sum_x) / n
The slope and intercept are then used to generate the baseline and the corresponding bands using the user-selected offsets.
How to Use
When the Magic Linear Regression Channel indicator is first added to the chart, there will be a blue prompt behind the “Indicators, Metrics & Strategies” window. Close the window, then select a START POINT by clicking at a desired location on the chart. Next, you will be prompted to select an END POINT. The end point MUST be placed after the START POINT. At this time a channel will be generated. Once you’ve selected the START POINT and END POINT, you can adjust them by dragging them anywhere on the chart. Each adjustment will generate a new channel making it easier for you to quickly visualize and recognize any channel exits and bounces.
The Magic Linear Regression Channel indicator works great at identifying wave patterns. Place the start line at a top or bottom pivot point. Place the end line at the next respective top or bottom pivot. This will give you a complete wave form to work with. When price reaches a band and rejects, it can be a strong indication that price may move back to one of the bands in the channel. If price exits the channel with volume that supports the exit, it may be an indication of a breakout.
You can also use the horizontal mode to identify key levels, then add Fibonacci bands based on regression calculations for the given time period to provide more meaningful areas of support and resistance.
Other Usage Notes and Limitations
Occasionally, off-by-1 errors appear which makes the extended lines protrude at a slightly incorrect angle. This is a known bug and will be addressed in the next release.
It's important for traders to be aware of the limitations of any indicator and to use them as part of a broader, well-rounded trading strategy that includes risk management, fundamental analysis, and other tools that can help with reducing false signals, determining trend direction, and providing additional confirmation for a trade decision. Diversifying strategies and not relying solely on one type of indicator or analysis can help mitigate some of these risks.

Percentage Change IndicatorPercentage Change Indicator
This indicator calculates and displays the percentage change between the current close price and the previous close price. It provides a clear visual representation of price movements, helping traders quickly identify significant changes in the market.
## Formula
The percentage change is calculated using the following formula:
```
Percentage Change = (Current Close - Previous Close) * 100 / Current Close
```
## Features
- Displays percentage change as a bar chart
- Green bars indicate positive changes
- Red bars indicate negative changes
- A horizontal line at 0% helps distinguish between positive and negative movements
## How to Use
1. Add the indicator to your chart
2. Observe the bar chart below your main price chart
3. Green bars above the 0% line indicate upward price movements
4. Red bars below the 0% line indicate downward price movements
5. The height of each bar represents the magnitude of the percentage change
This indicator can be particularly useful for:
- Identifying sudden price spikes or drops
- Analyzing the volatility of an asset
- Comparing price movements across different timeframes
- Spotting potential entry or exit points based on percentage changes
Customize the indicator's appearance in the settings to suit your charting preferences.
Note: This indicator works on all timeframes, adapting its calculations to the selected chart period.

Ichimoku Theories [LuxAlgo]The Ichimoku Theories indicator is the most complete Ichimoku tool you will ever need. Four tools combined into one to harness all the power of Ichimoku Kinkō Hyō.
This tool features the following concepts based on the work of Goichi Hosoda:
Ichimoku Kinkō Hyō: Original Ichimoku indicator with its five main lines and kumo.
Time Theory: automatic time cycle identification and forecasting to understand market timing.
Wave Theory: automatic wave identification to understand market structure.
Price Theory: automatic identification of developing N waves and possible price targets to understand future price behavior.
🔶 ICHIMOKU KINKŌ HYŌ
Ichimoku with lines only, Kumo only and both together
Let us start with the basics: the Ichimoku original indicator is a tool to understand the market, not to predict it, it is a trend-following tool, so it is best used in trending markets.
Ichimoku tells us what is happening in the market and what may happen next, the aim of the tool is to provide market understanding, not trading signals.
The tool is based on calculating the mid-point between the high and low of three pre-defined ranges as the equilibrium price for short (9 periods), medium (26 periods), and long (52 periods) time horizons:
Tenkan sen: middle point of the range of the last 9 candles
Kinjun sen: middle point of the range of the last 26 candles
Senkou span A: middle point between Tankan Sen and Kijun Sen, plotted 26 candles into the future
Senkou span B: midpoint of the range of the last 52 candles, plotted 26 candles into the future
Chikou span: closing price plotted 26 candles into the past
Kumo: area between Senkou pans A and B (kumo means cloud in Japanese)
The most basic use of the tool is to use the Kumo as an area of possible support or resistance.
🔶 TIME THEORY
Current cycles and forecast
Time theory is a critical concept used to identify historical and current market cycles, and use these to forecast the next ones. This concept is based on the Kihon Suchi (translating to "Basic Numbers" in Japanese), these are 9 and 26, and from their combinations we obtain the following sequence:
9, 17, 26, 33, 42, 51, 65, 76, 129, 172, 200, 257
The main idea is that the market moves in cycles with periods set by the Kihon Suchi sequence.
When the cycle has the same exact periods, we obtain the Taito Suchi (translating to "Same Number" in Japanese).
This tool allows traders to identify historical and current market cycles and forecast the next one.
🔹 Time Cycle Identification
Presentation of 4 different modes: SWINGS, HIGHS, KINJUN, and WAVES .
The tool draws a horizontal line at the bottom of the chart showing the cycles detected and their size.
The following settings are used:
Time Cycle Mode: up to 7 different modes
Wave Cycle: Which wave to use when WAVE mode is selected, only active waves in the Wave Theory settings will be used.
Show Time Cycles: keep a cleaner chart by disabling cycles visualisation
Show last X time cycles: how many cycles to display
🔹 Time Cycle Forecast
Showcasing the two forecasting patterns: Kihon Suchi and Taito Suchi
The tool plots horizontal lines, a solid anchor line, and several dotted forecast lines.
The following settings are used:
Show time cycle forecast: to keep things clean
Forecast Pattern: comes in two flavors
Kihon Suchi plots a line from the anchor at each number in the Kihon Suchi sequence.
Taito Suchi plot lines from the anchor with the same size detected in the anchored cycle
Anchor forecast on last X time cycle: traders can place the anchor in any detected cycle
🔶 WAVE THEORY
All waves activated with overlapping
The main idea behind this theory is that markets move like waves in the sea, back and forth (making swing lows and highs). Understanding the current market structure is key to having realistic expectations of what the market may do next. The waves are divided into Simple and Complex.
The following settings are used:
Basic Waves: allows traders to activate waves I, V and N
Complex Waves: allows traders to activate waves P, Y and W
Overlapping waves: to avoid missing out on any of the waves activated
Show last X waves: how many waves will be displayed
🔹 Basic Waves
The three basic waves
The basic waves from which all waves are made are I, V, and N
I wave: one leg moves
V wave: two legs move, one against the other
N wave: Three legs move, push, pull back, and another push
🔹 Complex Waves
Three complex waves
There are other waves like
P wave: contracting market
Y wave: expanding market
W wave: double top or double bottom
🔶 PRICE THEORY
All targets for the current N wave with their calculations
This theory is based on identifying developing N waves and predicting potential price targets based on that developing wave.
The tool displays 4 basic targets (V, E, N, and NT) and 3 extended targets (2E and 3E) according to the calculations shown in the chart above. Traders can enable or disable each target in the settings panel.
🔶 USING EVERYTHING TOGETHER
Please DON'T do this. This is not how you use it
Now the real example:
Daily chart of Nasdaq 100 futures (NQ1!) with our Ichimoku analysis
Time, waves, and price theories go together as one:
First, we identify the current time cycles and wave structure.
Then we forecast the next cycle and possible key price levels.
We identify a Taito Suchi with both legs of exactly 41 candles on each I wave, both together forming a V wave, the last two I waves are part of a developing N wave, and the time cycle of the first one is 191 candles. We forecast this cycle into the future and get 22nd April as a key date, so in 6 trading days (as of this writing) the market would have completed another Taito Suchi pattern if a new wave and time cycle starts. As we have a developing N wave we can see the potential price targets, the price is actually between the NT and V targets. We have a bullish Kumo and the price is touching it, if this Kumo provides enough support for the price to go further, the market could reach N or E targets.
So we have identified the cycle and wave, our expectations are that the current cycle is another Taito Suchi and the current wave is an N wave, the first I wave went for 191 candles, and we expect the second and third I waves together to amount to 191 candles, so in theory the N wave would complete in the next 6 trading days making a swing high. If this is indeed the case, the price could reach the V target (it is almost there) or even the N target if the bulls have the necessary strength.
We do not predict the future, we can only aim to understand the current market conditions and have future expectations of when (time), how (wave), and where (price) the market will make the next turning point where one side of the market overcomes the other (bulls vs bears).
To generate this chart, we change the following settings from the default ones:
Swing length: 64
Show lines: disabled
Forecast pattern: TAITO SUCHI
Anchor forecast: 2
Show last time cycles: 5
I WAVE: enabled
N WAVE: disabled
Show last waves: 5
🔶 SETTINGS
Show Swing Highs & Lows: Enable/Disable points on swing highs and swing lows.
Swing Length: Number of candles to confirm a swing high or swing low. A higher number detects larger swings.
🔹 Ichimoku Kinkō Hyō
Show Lines: Enable/Disable the 5 Ichimoku lines: Kijun sen, Tenkan sen, Senkou span A & B and Chikou Span.
Show Kumo: Enable/Disable the Kumo (cloud). The Kumo is formed by 2 lines: Senkou Span A and Senkou Span B.
Tenkan Sen Length: Number of candles for Tenkan Sen calculation.
Kinjun Sen Length: Number of candles for the Kijun Sen calculation.
Senkou Span B Length: Number of candles for Senkou Span B calculation.
Chikou & Senkou Offset: Number of candles for Chikou and Senkou Span calculation. Chikou Span is plotted in the past, and Senkou Span A & B in the future.
🔹 Time Theory
Show Time Cycle Forecast: Enable/Disable time cycle forecast vertical lines. Disable for better performance.
Forecast Pattern: Choose between two patterns: Kihon Suchi (basic numbers) or Taito Suchi (equal numbers).
Anchor forecast on last X time cycle: Number of time cycles in the past to anchor the time cycle forecast. The larger the number, the deeper in the past the anchor will be.
Time Cycle Mode: Choose from 7 time cycle detection modes: Tenkan Sen cross, Kijun Sen cross, Kumo change between bullish & bearish, swing highs only, swing lows only, both swing highs & lows and wave detection.
Wave Cycle: Choose which type of wave to detect from 6 different wave types when the time cycle mode is set to WAVES.
Show Time Cycles: Enable/Disable time cycle horizontal lines. Disable for better performance.
how last X time cycles: Maximum number of time cycles to display.
🔹 Wave Theory
Basic Waves: Enable/Disable the display of basic waves, all at once or one at a time. Disable for better performance.
Complex Waves: Enable/Disable complex wave display, all at once or one by one. Disable for better performance.
Overlapping Waves: Enable/Disable the display of waves ending on the same swing point.
Show last X waves: 'Maximum number of waves to display.
🔹 Price Theory
Basic Targets: Enable/Disable horizontal price target lines. Disable for better performance.
Extended Targets: Enable/Disable extended price target horizontal lines. Disable for better performance.

Price Action Fractal Forecasts [AlgoAlpha]🔮 Price Action Fractal Forecasts - Unleash the Power of Historical Patterns! 🌌✨
Dive into the future with AlgoAlpha's Price Action Fractal Forecasts ! This innovative indicator utilizes the mesmerizing complexity of fractals to predict future price movements, offering traders a unique edge in the market. By analyzing historical price action and identifying repeating patterns, this tool forecasts future price trends, providing visually engaging and actionable insights.
Key Features:
🔄 Flexible Data Series Selection: Choose your preferred data series for precise analysis.
🕰 Flexible Training and Reference Data Windows: Customize the length of training data and reference periods to match your trading style.
📈 Custom Forecast Length: Adjust the forecast horizon to suit your strategic objectives.
🌈 Customizable Visual Elements: Tailor the colors of forecast deviation cones, data reference areas, and more for optimal chart readability.
🔄 Anticipatory and Repetitive Forecast Modes: Select between anticipating future trends or identifying repetitive patterns for forecasts.
🔎 Enhanced Similarity Search: Leverages correlation metrics to find the most similar historical data segments.
📊 Forecast Deviation Cone: Visualize potential price range deviations with adjustable multipliers.
🚀 Quick Guide to Maximizing Your Trading with Price Action Fractal Forecasts:
🛠 Add the Indicator: Search for "Price Action Fractal Forecasts" in TradingView's Indicators & Strategies. Customize settings according to your trading strategy.
📊 Strategic Forecasting: Monitor the forecast deviation cone and forecast directional changes for insights into potential future price movements.
🔔 Alerts for Swift Action: Set up notifications based on forecast changes to stay ahead of market movements without constant monitoring.
Behind the Magic: How It Works
The core of the Price Action Fractal Forecasts lies in its ability to compare current market behavior with historical data to unearth similar patterns. It first establishes a training data window to analyze historical prices. Within this window, it then defines a reference length to identify the most recent price action that will serve as the basis for comparison. The indicator searches through the historical data within the training window to find segments that closely match the recent price action in the reference period.
Depending on whether you choose the anticipatory or repetitive forecast mode, the indicator either looks ahead to predict future prices based on past outcomes following similar patterns or focuses on the repeating patterns within the reference period itself for forecasts. The forecast's direction can be configured to reflect the mean average of forecasted prices or the end-point relative to the start-point of the forecast, offering flexibility in how forecasts are interpreted.
To enhance the comprehensiveness and visualization, the indicator features a forecast deviation cone. This cone represents the potential range of price movements, providing a visual cue for volatility and uncertainty in the forecasted prices. The intensity of this cone can be adjusted to suit individual preferences, offering a visual guide to the level of risk and uncertainty associated with the forecasted price path.
Embrace the fractal magic of markets with AlgoAlpha's Price Action Fractal Forecasts and transform your trading today! 🌟🚀

Flags and Pennants [Trendoscope®]🎲 An extension to Chart Patterns based on Trend Line Pairs - Flags and Pennants
After exploring Algorithmic Identification and Classification of Chart Patterns and developing Auto Chart Patterns Indicator , we now delve into extensions of these patterns, focusing on Flag and Pennant Chart Patterns. These patterns evolve from basic trend line pair-based structures, often influenced by preceding market impulses.
🎲 Identification rules for the Extension Patterns
🎯 Identify the existence of Base Chart Patterns
Before identifying the flag and pennant patterns, we first need to identify the existence of following base trend line pair based converging or parallel patterns.
Ascending Channel
Descending Channel
Rising Wedge (Contracting)
Falling Wedge (Contracting)
Converging Triangle
Descending Triangle (Contracting)
Ascending Triangle (Contracting)
🎯 Identifying Extension Patterns.
The key to pinpointing these patterns lies in spotting a strong impulsive wave – akin to a flagpole – preceding a base pattern. This setup suggests potential for an extension pattern:
A Bullish Flag emerges from a positive impulse followed by a descending channel or a falling wedge
A Bearish Flag appears after a negative impulse leading to an ascending channel or a rising wedge.
A Bullish Pennant is indicated by a positive thrust preceding a converging triangle or ascending triangle.
A Bearish Pennant follows a negative impulse and a converging or descending triangle.
🎲 Pattern Classifications and Characteristics
🎯 Bullish Flag Pattern
Characteristics of Bullish Flag Pattern are as follows
Starts with a positive impulse wave
Immediately followed by either a short descending channel or a falling wedge
Here is an example of Bullish Flag Pattern
🎯 Bearish Flag Pattern
Characteristics of Bearish Flag Pattern are as follows
Starts with a negative impulse wave
Immediately followed by either a short ascending channel or a rising wedge
Here is an example of Bearish Flag Pattern
🎯 Bullish Pennant Pattern
Characteristics of Bullish Pennant Pattern are as follows
Starts with a positive impulse wave
Immediately followed by either a converging triangle or ascending triangle pattern.
Here is an example of Bullish Pennant Pattern
🎯 Bearish Pennant Pattern
Characteristics of Bearish Pennant Pattern are as follows
Starts with a negative impulse wave
Immediately followed by either a converging triangle or a descending converging triangle pattern.
Here is an example of Bearish Pennant Pattern
🎲 Trading Extension Patterns
In a strong market trend, it's common to see temporary periods of consolidation, forming patterns that either converge or range, often counter to the ongoing trend direction. Such pauses may lay the groundwork for the continuation of the trend post-breakout. The assumption that the trend will resume shapes the underlying bias of Flag and Pennant patterns
It's important, however, not to base decisions solely on past trends. Conducting personal back testing is crucial to ascertain the most effective entry and exit strategies for these patterns. Remember, the behavior of these patterns can vary significantly with the volatility of the asset and the specific timeframe being analyzed.
Approach the interpretation of these patterns with prudence, considering that market dynamics are subject to a wide array of influencing factors that might deviate from expected outcomes. For investors and traders, it's essential to engage in thorough back testing, establishing entry points, stop-loss orders, and target goals that align with your individual trading style and risk appetite. This step is key to assessing the viability of these patterns in line with your personal trading strategies and goals.
It's fairly common to witness a breakout followed by a swift price reversal after these patterns have formed. Additionally, there's room for innovation in trading by going against the bias if the breakout occurs in the opposite direction, specially when the trend before the formation of the pattern is in against the pattern bias.
🎲 Cheat Sheet
🎲 Indicator Settings
Custom Source : Enables users to set custom OHLC - this means, the indicator can also be applied on oscillators and other indicators having OHLC values.
Zigzag Settings : Allows users to enable different zigzag base and set length and depth for each zigzag.
Scanning Settings : Pattern scanning settings set some parameters that define the pattern recognition process.
Display Settings : Determine the display of indicators including colors, lines, labels etc.
Backtest Settings : Allows users to set a predetermined back test bars so that the indicator will not time out while trying to run for all available bars.

Auto Chart Patterns [Trendoscope®]🎲 Introducing our most comprehensive automatic chart pattern recognition indicator.
Last week, we published an idea on how to algorithmically identify and classify chart patterns.
This indicator is nothing but the initial implementation of the idea. Whatever we explained in that publication that users can do manually to identify and classify the pattern, this indicator will do it for them.
🎲 Process of identifying the patterns.
The bulk of the logic is implemented as part of the library - chartpatterns . The indicator is a shell that captures the user inputs and makes use of the library to deliver the outcome.
🎯 Here is the list of steps executed to identify the patterns on the chart.
Derive multi level recursive zigzag for multiple base zigzag length and depth combinations.
For each zigzag and level, check the last 5 pivots or 6 pivots (based on the input setting) for possibility of valid trend line pairs.
If there is a valid trend line pair, then there is pattern.
🎯 Rules for identifying the valid trend line pairs
There should be at least two trend lines that does not intersect between the starting and ending pivots.
The upper trend line should touch all the pivot highs of the last 5 or 6 pivots considered for scanning the patterns
The lower trend line should touch all the pivot lows of the last 5 or 6 pivots considered for scanning the patterns.
None of the candles from starting pivot to ending pivot should fall outside the trend lines (above upper trend line and below lower trend line)
The existence of a valid trend line pair signifies the existence of pattern. What type of pattern it is, to identify that we need to go through the classification rules.
🎲 Process of classification of the patterns.
We need to gather the following information before we classify the pattern.
Direction of upper trend line - rising, falling or flat
Direction of lower trend line - rising, falling or flat
Characteristics of trend line pair - converging, expanding, parallel
🎯 Broader Classifications
Broader classification would include the following types.
🚩 Classification Based on Geometrical Shapes
This includes
Wedges - both trend lines are moving in the same direction. But, the trend lines are either converging or diverging and not parallel to each other.
Triangles - trend lines are moving in different directions. Naturally, they are either converging or diverging.
Channels - Both trend lines are moving in the same direction, and they are parallel to each other within the limits of error.
🚩 Classification Based on Pattern Direction
This includes
Ascending/Rising Patterns - No trend line is moving in the downward direction and at least one trend line is moving upwards
Descending/Falling Patterns - No trend line is moving in the upward direction, and at least one trend line is moving downwards.
Flat - Both Trend Lines are Flat
Bi-Directional - Both trend lines are moving in opposite direction and none of them is flat.
🚩 Classification Based on Formation Dynamics
This includes
Converging Patterns - Trend Lines are converging towards each other
Diverging Patterns - Trend Lines are diverging from each other
Parallel Patterns - Trend Lines are parallel to each others
🎯 Individual Pattern Types
Now we have broader classifications. Let's go through in detail to find out fine-grained classification of each individual patterns.
🚩 Ascending/Uptrend Channel
This pattern belongs to the broader classifications - Ascending Patterns, Parallel Patterns and Channels. The rules for the Ascending/Uptrend Channel pattern are as below
Both trend lines are rising
Trend lines are parallel to each other
🚩 Descending/Downtrend Channel
This pattern belongs to the broader classifications - Descending Patterns, Parallel Patterns and Channels. The rules for the Descending/Downtrend Channel pattern are as below
Both trend lines are falling
Trend lines are parallel to each other
🚩 Ranging Channel
This pattern belongs to the broader classifications - Flat Patterns, Parallel Patterns and Channels. The rules for the Ranging Channel pattern are as below
Both trend lines are flat
Trend lines are parallel to each other
🚩 Rising Wedge - Expanding
This pattern belongs to the broader classifications - Rising Patterns, Diverging Patterns and Wedges. The rules for the Expanding Rising Wedge pattern are as below
Both trend lines are rising
Trend Lines are diverging.
🚩 Rising Wedge - Contracting
This pattern belongs to the broader classifications - Rising Patterns, Converging Patterns and Wedges. The rules for the Contracting Rising Wedge pattern are as below
Both trend lines are rising
Trend Lines are converging.
🚩 Falling Wedge - Expanding
This pattern belongs to the broader classifications - Falling Patterns, Diverging Patterns and Wedges. The rules for the Expanding Falling Wedge pattern are as below
Both trend lines are falling
Trend Lines are diverging.
🚩 Falling Wedge - Contracting
This pattern belongs to the broader classifications - Falling Patterns, Converging Patterns and Wedges. The rules for the Converging Falling Wedge are as below
Both trend lines are falling
Trend Lines are converging.
🚩 Rising/Ascending Triangle - Expanding
This pattern belongs to the broader classifications - Rising Patterns, Diverging Patterns and Triangles. The rules for the Expanding Ascending Triangle pattern are as below
The upper trend line is rising
The lower trend line is flat
Naturally, the trend lines are diverging from each other
🚩 Rising/Ascending Triangle - Contracting
This pattern belongs to the broader classifications - Rising Patterns, Converging Patterns and Triangles. The rules for the Contracting Ascending Triangle pattern are as below
The upper trend line is flat
The lower trend line is rising
Naturally, the trend lines are converging.
🚩 Falling/Descending Triangle - Expanding
This pattern belongs to the broader classifications - Falling Patterns, Diverging Patterns and Triangles. The rules for the Expanding Descending Triangle pattern are as below
The upper trend line is flat
The lower trend line is falling
Naturally, the trend lines are diverging from each other
🚩 Falling/Descending Triangle - Contracting
This pattern belongs to the broader classifications - Falling Patterns, Converging Patterns and Triangles. The rules for the Contracting Descending Triangle pattern are as below
The upper trend line is falling
The lower trend line is flat
Naturally, the trend lines are converging.
🚩 Converging Triangle
This pattern belongs to the broader classifications - Bi-Directional Patterns, Converging Patterns and Triangles. The rules for the Converging Triangle pattern are as below
The upper trend line is falling
The lower trend line is rising
Naturally, the trend lines are converging.
🚩 Diverging Triangle
This pattern belongs to the broader classifications - Bi-Directional Patterns, Diverging Patterns and Triangles. The rules for the Diverging Triangle pattern are as below
The upper trend line is rising
The lower trend line is falling
Naturally, the trend lines are diverging from each other.
🎲 Indicator Settings - Auto Chart Patterns
🎯 Zigzag Settings
Zigzag settings allow users to select the number of zigzag combinations to be used for pattern scanning, and also allows users to set zigzag length and depth combinations.
🎯 Scanning Settings
Number of Pivots - This can be either 5 or 6. Represents the number of pivots used for identification of patterns.
Error Threshold - Error threshold used for initial trend line validation.
Flat Threshold - Flat angle threshold is used to identify the slope and direction of trend lines.
Last Pivot Direction - Filters patterns based on the last pivot direction. The values can be up, down, both, or custom. When custom is selected, then the individual pattern specific last pivot direction setting is used instead of the generic one.
Verify Bar Ratio - Provides option to ignore extreme patterns where the ratios of zigzag lines are not proportionate to each other.
Avoid Overlap - When selected, the patterns that overlap with existing patterns will be ignored while scanning. Meaning, if the new pattern starting point falls between the start and end of an existing pattern, it will be ignored.
🎯 Group Classification Filters
Allows users to enable disable patterns based on group classifications.
🚩 Geometric Shapes Based Classifications
Wedges - Rising Wedge Expanding, Falling Wedge Expanding, Rising Wedge Contracting, Falling Wedge Contracting.
Channels - Ascending Channel, Descending Channel, Ranging Channel
Triangles - Converging Triangle, Diverging Triangle, Ascending Triangle Expanding, Descending Triangle Expanding, Ascending Triangle Contrcting and Descending Triangle Contracting
🚩 Direction Based Classifications
Rising - Rising Wedge Contracting, Rising Wedge Expanding, Ascending Triangle Contracting, Ascending Triangle Expanding and Ascending Channel
Falling - Falling Wedge Contracting, Falling Wedge Expanding, Descending Triangle Contracting, Descending Triangle Expanding and Descending Channel
Flat/Bi-directional - Ranging Channel, Converging Triangle, Diverging Triangle
🚩 Formation Dynamics Based Classifications
Expanding - Rising Wedge Expanding, Falling Wedge Expanding, Ascending Triangle Expanding, Descending Triangle Expanding, Diverging Triangle
Contracting - Rising Wedge Contracting, Falling Wedge Contracting, Ascending Triangle Contracting, Descending Triangle Contracting, Converging Triangle
Parallel - Ascending Channel, Descending Channgel and Ranging Channel
🎯 Individual Pattern Filters
These settings allow users to enable/disable individual patterns and also set last pivot direction filter individually for each pattern. Individual Last Pivot direction filters are only considered if the main "Last Pivot Direction" filter is set to "custom"
🎯 Display Settings
These are the settings that determine the indicator display. The details are provided in the tooltips and are self explanatory.
🎯 Alerts
A basic alert message is enabled upon detection of new pattern on the chart.

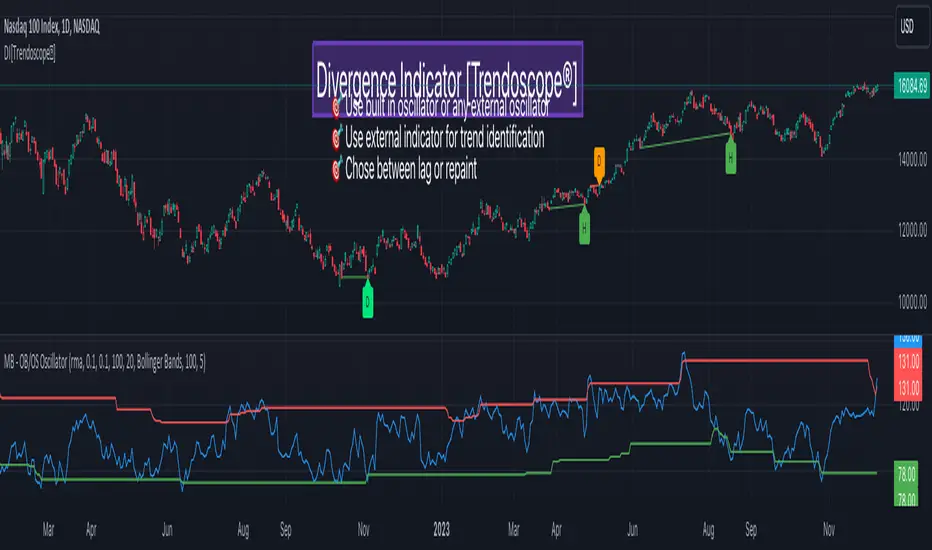
Divergence Indicator [Trendoscope®]🎲 New Divergence Indicator by Trendoscope
Our latest Divergence Indicator revolutionizes the way traders identify market trends and potential reversals. Built upon the robust foundation of the Zigzag Trend Divergence Detector and inline with our recent implementation of the Divergence Goggles indicator, this tool is designed to be intuitive yet powerful, making it an essential addition to any trader's toolkit.
We received several queries on extending the Divergence Goggles to last N bars instead of using an interactive widget. Though it is possible, we thought the better approach is to enable the indicator to use any oscillator and trend indicator in order to define the divergence.
🎯 Key Features
Flexible Oscillator Integration : Choose from a wide range of built-in oscillators or import your own, including options like the innovative Multiband Oscillator. This versatility extends to using volume indicators like OBV for divergence calculations, broadening the scope of analysis.
Trend Identification Versatility : Utilize built-in methods like Zigzag and MA Difference, or integrate external trend indicators. Our system adapts to various methods, ensuring you have the right tools for precise trend identification.
Customizable Zigzag Sensitivity : Adjust the Zigzag based on your chosen oscillator's sensitivity to ensure divergence lines are accurate and visually coherent.
Repainting vs. Delayed Signals : Tailor the indicator to your strategy by choosing between immediate repainting signals and slightly delayed but more stable signals.
🎯 Understanding Divergence: Key Rules
Bullish Divergence
Happens only in downtrend
Observed on Pivot Lows
Price makes lower low whereas oscillator makes higher low, indicating weakness and possible reversal
Bearish Divergence
Happens only in uptrend
Observed on Pivot Highs
Price makes higher high whereas oscillator makes lower high, indicating weakness and possible reversal
Bullish Hidden Divergence
Happens only in uptrend
Observed on Pivot Lows
Price makes higher low, whereas indicator makes lower low due to price consolidation. In bullish trend, this is considered as bullish as the price gets a breather and get ready to surge further.
Bearish Hidden Divergence
Happens only in downtrend
Observed on Pivot Highs
Price makes lower high whereas oscillator makes higher high due to price consolidation. In bearish trend, this is considered as bearish as the price gets a breather and get ready to fall further.
🎯 Visual Insights: Divergence and Hidden Divergence
For a clearer understanding, refer to our visual guides:
🎲 Using the Divergence Indicator: A Step-by-Step Guide
🎯 Step 1 - Selecting the Oscillator
Customize your analysis by choosing from a variety of oscillators or importing your preferred one. Options are available to select a range of built-in oscillators and the loopback length. However, if the oscillator that user want to use is not in the list, they can simply load the oscillator from the indicator library and use it as an external signal.
In our current example, we are using a custom oscillator called - Multiband Oscillator
This also means, the indicator option is not limited to oscillators. Users can even make use of volume indicators such as OBV for the calculation of divergence.
🎯 Step 2 - Choosing the Trend Identification Method
Select from our built-in methods or integrate an external indicator to accurately identify market trends. Trend is one of the key parameters of divergence type identification. Trend can be identified mathematically by various methods. Some of them are as simple as above or below 200 moving average and some can follow trend based indicators such as supertrend and others can be very complex.
To cater for a wider audience, here too we have provided the option to use an external trend indicator. The simple condition for the external trend indicator is that it should return positive value for uptrend and negative value for downtrend.
Other than that, we also have 2 built in trend identification methods.
Zigzag - The trend is defined by the starting pivot of divergence line. If the starting pivot is Higher High or Higher Low, then it is considered uptrend. And if the starting pivot is either Lower Low or Lower High, then we consider it as downtrend.
MA Difference - In this case, the difference between the moving average of pivots joining the divergence line will determine the trend. It is considered uptrend if the moving average increased from starting pivot to ending pivot of the divergence line, and it is considered downtrend if the moving average decreased from starting pivot to the ending pivot of the divergence line.
🎯 Step 3 - Adjusting Zigzag Sensitivity
Fine-tune the Zigzag to match the oscillator's sensitivity, ensuring divergence lines are accurate and visually coherent.
🎯 Step 4 - Managing Repainting
Understand the implications of repainting in the last pivot of the Zigzag and choose between immediate or delayed signals based on your trading strategy. The last pivot of the zigzag repaint by design. This is not necessarily a bad thing. Users can just choose not to use the last pivot, but instead use the last but one for all the calculations. But, this also means, the signals will be delayed.
Indicator provides option to use repainting signal vs delayed signal. If you select the repaint option, the signals are shown immediately as and when they occur. But, there is a possibility that these signals change when the new price candles change zigzag pivot.
If you chose not to select the repaint option, then the divergence signals may lag by a few bars.
ZigZag++ FibonacciAuto Fibonacci tools are powerful ways designed to simplify your technical analysis by automatically drawing Fibonacci retracement and extension levels on your chart. This indicator is built to enhance your trading experience with clearer market moves and informative insights.
You can easily spot your waves and patterns when the percentages are moving with you.
Key Features:
Automated Fibonacci Levels: Plots Fibonacci retracement and extension levels based on recent price movements.
Multi-Timeframe Support: This indicator is your versatile companion, offering multi-timeframe functionality. You can seamlessly track Fibonacci levels across different resolutions, providing a comprehensive view of the market.
Two Types of Fibs: Retracement and Timeframe extension Fibonacci levels. Use retracements to identify potential reversal points and extensions to anticipate price targets, giving you a well-rounded perspective on market movements.
Benefits:
Save Time: No more manual Fibonacci drawing; It does this for you in real-time.
Enhanced Analysis: Gain a deeper understanding of potential support, resistance, and price targets.
User-Friendly: Suitable for traders of all levels, this indicator simplifies complex technical analysis.
For the math lovers
I started creating the ZigZag++ based on the MT4 calculation as I found it better performing than the tradingview inbuilt one. I have revised the calculation couple of times and now the final calculation is simple yet more accurate for my analysis.
First, I observe the market direction for the last Depth setting by comparing the rate at which high values reduce and low values increase. When the number of ticks set by Deviation is crossed and the last cross is more than the Backstep candles, then we have our ZigZag points.
These are the points we use in our Fibonacci calculation.
Checkout ZigLib below to use the same logic in your scripts.
Sample usage
This is a 4 Hour configuration with the default settings.
When the trend reversed, some key points I watch are 0.618 and 0.5. The market retraced back and formed the new point for the next ZigZag line on that level. This market behaviour happens quite often on these Fibonacci points. I would be looking for reversal or a break in this zone to know the next step.
Resources
ZigZag++ Lib by me; for retrieving the line points.
Fibonacci Toolkit by Lux Algo; For drawing the Timeframe Fibs. Very Amazing script.
Smart Money Breakouts [ChartPrime]The " Smart Money Breakouts " indicator is designed to identify breakouts based on changes in character (CHOCH) or breaks of structure (BOS) patterns, facilitating automated trading with user-defined Take Profit (TP) level.
the indicator incorporates essential elements such as volume analysis and a data table to assist traders in optimizing their strategies.
🔸 Breakout Detection:
The indicator scans price movements for "Change in Character" (CHOCH) and "Break of Structure" (BOS) patterns, signaling potential breakout opportunities in the market.
🔸User-Defined TP :
Traders can customize the Take Profit (TP) through the indicator settings, with these levels dynamically calculated based on the Average True Range (ATR). This allows for precise risk management and profit targets that adapt to market volatility.
🔸 Volume Analysis and Trade Direction Specific Analysis:
The indicator includes a volume checker that provides valuable insights into the strength of the breakout, taking into account trade direction.
🔸If the volume label is red and the trade is long, it suggests a higher likelihood of hitting the Stop Loss (SL).
🔸If the volume label is green and the trade is long, it indicates a higher probability of hitting the Take Profit (TP).
🔸For short trades, a red volume label suggests a higher likelihood of hitting TP, while a green label suggests a higher likelihood of hitting SL.
🔸A yellow volume label suggests that the volume is inconclusive, neither favoring bullish nor bearish movements.
🔸Data Table:
The indicator features a data table that keeps track of the number of winning and losing trades for specific timeframes or configurations.
This table serves as a valuable tool for traders to analyze performance and discover optimal settings and timeframes.
The "Smart Money Breakouts" indicator provides traders with a comprehensive solution for breakout trading, combining technical analysis of changes in character and breaks of structure, volume insights, and performance tracking while dynamically adjusting TP and SL levels based on market volatility through the ATR.

Trendline Breakouts With Targets [ChartPrime]The Trendline Breakouts With Targets indicator is meticulously crafted to improve trading decision-making by pinpointing trendline breakouts and breakdowns through pivot point analysis.
Here's a comprehensive look at its primary functionalities:
Upon the occurrence of a breakout or breakdown, a signal is meticulously assessed against a false signal condition/filter, after which the indicator promptly generates a trading signal. Additionally, it conducts precise calculations to determine potential target levels and then exhibits them graphically on the price chart.
🔷 Key Features:
🔸 Trendline Drawing: The indicator automatically plots trendlines based on significant pivot points and wick data, visually representing the prevailing trend.
🔸 Breakout and Breakdown Signals : It triggers trading signals when a breakout (price moves above the trendline) or a breakdown (price moves below the trendline) is detected, helping traders identify potential entry points.
🔸 False Breakout/ Breakdown Filter ✔️: To enhance accuracy, the indicator incorporates a filter to reduce false breakout and breakdown signals, helping traders avoid premature entries.
🔸 Target Calculation: The indicator performs target-level calculations, a critical aspect of trade management.
These calculated target levels are visually displayed on the price chart, helping traders set precise profit targets and make well-informed trading decisions.
🔸 Color-Change Labels: The indicator features label color changes to provide quick visual cues. Labels are initially displayed in orange. When a take profit (TP) level is reached, the label changes to green, indicating a successful trade. Conversely, if a stop-loss (SL) level is hit, the label turns red, signaling a losing trade.
🔸 Settings :
This indicator combines technical analysis, trendline identification, breakout/breakdown signals, and risk management tools to assist traders in making more informed and efficient trading decisions. It can be a valuable addition to any trader's toolkit, helping them identify potential trade opportunities and manage risk effectively.

ABC on Recursive Zigzag [Trendoscope]There are several implementations of ABC pattern in tradingview and pine script. However, we have made this indicator to provide users additional quantifiable information along with flexibility to experiment and develop their own strategy based on the patterns.
🎲 Highlights of this indicator over other ABC implementations are:
Implementation is based on recursive multi level zigzag allows bigger as well as smaller patterns to be identified
Allows users to set their trading rules with respect to entry, target and stop ratios, experiment and build their own strategy based on the ABC pattern.
Back test summary including win ratio and risk reward will help users understand the profitability based on different settings being used.
🎲 Concept of ABC Pattern
The ABC pattern, also known as the "Corrective Wave" or "Zigzag Pattern," is a fundamental concept in Elliott Wave Theory, which is widely used in technical analysis to identify and predict price movements in financial markets.
The ABC pattern is a three-wave corrective pattern that typically occurs within the context of a larger impulse or trending wave. It consists of two smaller waves in the opposite direction (A and C) separated by a corrective wave (B). These waves are labeled alphabetically and represent price movements.
Wave A (Impulse Wave): Wave A is the first leg of the ABC pattern and is characterized by a strong price move in the opposite direction of the prevailing trend. It is often driven by a fundamental or sentiment-driven event that temporarily disrupts the trend.
Wave B (Corrective Wave): Wave B is the corrective wave that follows Wave A. It represents a partial retracement of Wave A's price movement. Wave B can take various forms, such as a simple correction or a complex correction (e.g., a triangle or a flat correction). It typically doesn't retrace the entire length of Wave A.
Wave C (Impulse Wave): Wave C is the final leg of the ABC pattern and is characterized by a strong price move in the same direction as the prevailing trend. It often surpasses the starting point of Wave A and confirms the resumption of the larger trend.
🎲 Indicator Components
Upon loading the indicator on the chart, we can observe the following components on the chart.
Pattern Drawings is the graphical representation of present patterns. Please note that it is not necessary for patterns to be there on the chart all the time. Patterns will appear on the chart when price makes the patterns.
Trade Box is the box representing trade signals of the pattern. These trade levels are generated based on the user settings.
Summary Table is the back test summary containing details of historical pattern performance including Win Ratio and Risk Reward.
🎲 Indicator Settings
Details of each user settings are provided in the tooltips. Below is the snapshot of it.
🎲 Alerts
Basic level of alerts are built in the script using alert function to highlight the following conditions:
New ABC Pattern
Updates to existing Pattern
Both conditions will alert simple text messages. There is not much customization provided as part of this indicator. We will consider providing more options in future versions based on the interest and demand shown by users.

CANDLE STICK HEATMAPCANDLE STICK HEATMAP shows the statistics of a candle at a particular time. its very useful to find repeating pattern's at a particular time in a day.
based on the settings you can see regular repeating patterns of a day in an hourly chart. During a particular time in day there is always a down or up signal or candles.
The table boxes are candles in RED and GREEN based on open and close of the chart. The Heat map is very useful in analyzing the daily Hourly candlesticks in a week. The Time of each candlestick is plotted on the table along with default Indicators like RSI, MACD, EMA, VOLUME, ADX.
Additionally this can be used as a screener of candles on all timeframes. Analysis is easy when you want to see what happened exactly at a particular time in the previous hour, day, month etc.,
Hopefully additional updates will be introduced shortly.
Indicators:
1. MACD (close,12,26,9)
2.RSI (close,14)
3.EMA 200
3.Volume MA
Option is provided to show indicator statistics and time.
Color can be changed using settings.
Supports all Time Zones

Recursive Reversal Chart Patterns [Trendoscope]Caution: This algorithm is very heavy and bound to cause timeouts. If that happens, there are few settings you can change to reduce the load. (Will explain them in the description below)
🎲 Recursive Reversal Chart Patterns Indicator
Welcome to another exploration of Zigzag and Pattern ecosystem components. Previously we derived Pitchfork and Recursive Zigzag indicators. This indicator is designed to scan and highlight few popular "Reversal Chart Patterns". Similar to other indicators in the ecosystem, this too is built on recursive zigzags.
Double Taps
Triple Taps
Cup and Handles
Head and Shoulders
Indicator however names the patterns separately for bullish and bearish formations. So, the actual names you see on the screen are
Double Top
Double Bottom
Triple Top
Triple Bottom
Cup and Handle
Inverted Cup and Handle
Head and Shoulders
Inverse Head and Shoulders
Here is a snapshot on how each category of patterns look on the chart.
🎲 Architecture
Many of you may be cursing me for publishing too many libraries. But, these are all preparations for something big. Like other indicators in the Zigzag and Patterns Ecosystem, this too uses a bunch of libraries.
🎯Major direct dependencies
ZigzagTypes
ZigzagMethods
ReversalChartPatternLibrary
🎯Indirect dependencies
DrawingTypes
DrawingMethods
🎯Minor dependencies
Utils
TradeTracker
🎲 Indicator Settings
🎯Generic and Zigzag Settings.
Note: In case of timeout, please decrease the value of depth parameter
🎯Pattern Selection
Having all the patterns selected on chart may also cause timeouts and will make the chart look messy. It is better to limit one or two patterns on the chart to have clear picture.
🎯Scanner Settings
🎯Indicators.
These are options to use indicators as secondary confirmation to calculate divergence. If selected, the patterns are shown only if the divergence data is inline. Option also available to plugin external indicator. These calculations are not straightforward and not easy to measure by manual inspection. This feature at present is purely experimental.
Have a go and let me know how you feel :)

Opening Range with FibsThe indicator uses a time range and another instrument for time reference, so that it works in the time zone you care about. I have set the default to SPX500USD since it is in EST ( SPX , ES and many futures are on Chicago time and opening range gets confused). You can change the reference instrument in the settings.
You can also change the multipliers and use other values instead of 1.272 and 1.618 for Fib extensions.
TradingView has a limit as to how many objects an indicator can create so if you want to go back further for visual backtesting - use the replay tool - it will be able to draw up to the time you selected within its limits.
Let me know if you need anything else...
Happy Trading!