Harmonic Pattern Table UDT█ OVERVIEW
This table indicator was intended as helper / reference for using XABCD Pattern drawing tool.
The values shown in table was based on Harmonic Trading Volume 3: Reaction vs. Reversal written by Scott M Carney.
Code upgrade from Harmonic Pattern Table (Source Code) and based on latest User-Defined Type (UDT) .
As a result, code appeared more cleaner.
█ FEATURES
1. List Harmonic Patterns.
2. Font size small for mobile app and font size normal for desktop.
3. Options to show Animal name in text, emoji or both.
█ USAGE
Similar to Harmonic Pattern Table (Source Code).
█ CREDITS
Scott M Carney, Trading Volume 3: Reaction vs. Reversal
Search in scripts for "harmonic"
Harmonic Table Combo Point B█ OVERVIEW
This indicator was intended as educational purpose only and alternative way to show value in table as shown in Harmonic Pattern Possibility Table .
█ CREDITS
Credit to Scott M Carney, Harmonic Trading Volume 3: Reaction vs. Reversal.
█ USAGE EXAMPLE

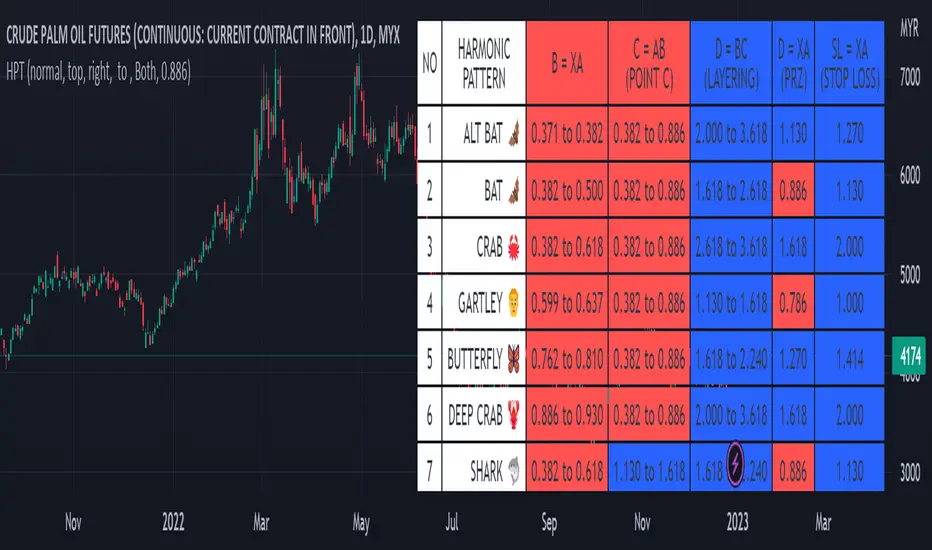
Harmonic Pattern Possibility Table█ OVERVIEW
This indicator was intended as educational purpose only based on Harmonic Pattern Table (Source Code) and Ratio For Harmonic Points to show Harmonic Pattern Possibility.
█ INSPIRATION
This indicator was build upon realizing there are some overlap for B = XA among Alternate Bat, Bat, Crab and Gartley.
Hence, the values split up to showcase the possibility of non overlap ratio.
█ USAGE
Possible pattern, priority pattern and selected pattern may differs based value input.
Therefore C = AB, D = BC, D = XA and Stop Loss will change based value input and also selected pattern.
█ CREDITS
Credit to Scott M Carney, Harmonic Trading Volume 3: Reaction vs. Reversal.

Manual Harmonic Patterns - With interactive inputsThis script is a drawing tool which allows users to draw XABCD on the chart and script will tell whether there is any harmonic patterns on the drawings made. The script is based on interactive inputs and requires users to chose XABCD points.
Please note
This is not a scanner and it will not scan historical bars for harmonic patterns. This needs to be used rather as drawing tool instead.
Script will not check if selected pivots are correct. It assumes users to know how to select the right XABCD based on pivot high/lows. Bullish pattern will have X, B and D as pivot lows and A,C as pivot highs. Similarly bearish patterns will have X, B, D as pivot highs and A, C as pivot lows.
Script will not check for overflow conditions. For example, if price crosses, XB or BD line, then pattern is considered to be invalid. But, this check cannot be made in this script and we require users to be aware of this condition and select input accordingly.
Order of inputs should be in ascending order. X pivot should come before A and then, B, C, D and F. This again is users responsibility to select pivots in right order.
What happens after selecting XABCD?
If selected pattern is valid harmonic pattern, it will
Draw XABCD lines and labels
Fill harmonic triangles
Show PRZ box which shoes the name of valid patterns.
If it is not valid harmonic pattern, then users will see blank XABCD line without any PRZ or filled harmonic triangles.
Example:
1. When it is valid pattern
2. When it is not valid pattern

Harmonic MADsNo, it's not a new saturation plugin for your fruity loops.
...
These are Mean Average Deviations calculated from Harmonic Mean.
...
In my previous research I tried to develop "Harmonic Average Deviations", since applying stdevs on Harmonic Mean calculated from reciprocals ain't make sense. Din't work out, prolly cuz by definition stdevs doesn't like negatives. So in the end I ended up using Mean Average Deviations, and turned out it works great. Generally market data doesn't distribute normally, so t's a great tool, now weird kurtosis won't be a problem.

Harmonic Pitchfork IndicatorsThis indicator provides 2 separate exponential moving averages and Quarters Theory Lines on 50 pip intervals above and below current price. Useful for trading the harmonic pitchfork strategy.
Three Drive [TradingFinder] 3 Drive Harmonic Pattern Indicator🔵 Introduction
The "Three Drive" pattern is one of the light "RTM" setups suitable for identifying price trend reversals. For this reason, this pattern is considered one of the "Reversal Patterns."
🟣 Bullish 3 Drive
At a price bottom, a formation occurs where the negative trend appears to continue, and lower lows are made.
However, the second low penetrates the range of the first low, and the third low penetrates the range of the second low, indicating a decrease in selling pressure and an increase in buying pressure.
Entry point is issued after the penetration of the third low to the second low, and targets are the highs formed in the "3 Drive."
🟣 Bearish 3 Drive
At a price top, a formation occurs where the positive trend appears to continue, and higher highs are made.
However, the second high penetrates the range of the first high, and the third high penetrates the range of the second high, indicating a decrease in buyers' strength and an increase in sellers' strength.
Entry point is issued after the penetration of the third high to the second high, and targets are the lows formed in the "3 Drive."
Importance :
This pattern bears a striking resemblance to the some of "Harmonic Pattern" and "Ending Diagonal" in the "Elliott Pattern".
🔵 How to Use
There is no need for further confirmation to use this pattern, and you can use it as soon as the pattern forms. However, to reduce errors, it is better to use this pattern when it forms within a "Supply and Demand" or "Support and Resistance" structure.
Bullish 3 Drive in Demand Zone :
Bearish 3 Drive in Supply Zone :
🔵 Settings
You can set your desired "Pivot Period" via settings for the indicator to identify setups based on it.

Smart Money Setup 04 [TradingFinder] Three Drive (Harmonic) + OB🔵 Introduction
The "Three Drive" pattern is a well-known formation in technical analysis, recognized for its ability to signal potential trend reversals in price action. Within the realm of trading, particularly in the context of "Reversal Patterns," the Three Drive pattern holds significance as a reliable indicator of shifts in market sentiment.
🟣 Bullish 3 Drive
This pattern typically manifests at a price bottom, where a sequence of lower lows suggests a prevailing negative trend. However, within the structure of the Three Drive pattern, a notable occurrence unfolds.
The second low breaches the range of the first low, followed by the third low surpassing the range of the second low. These penetrations signify a diminishing selling pressure and an emerging buying interest.
Traders often await the confirmation of the third low surpassing the second low as an entry point, with price targets set at the highs formed within the Three Drive pattern.
🟣 Bearish 3 Drive
Conversely, the Bearish Three Drive pattern emerges at a price top, characterized by a sequence of higher highs indicating an upward trend. Yet, amidst this apparent bullish momentum, a shift occurs.
The second high breaks beyond the range of the first high, succeeded by the third high exceeding the range of the second high. These breaches signify a waning buying strength and a resurgence in selling pressure.
Entry into a trade is often executed after the confirmation of the third high surpassing the second high, with targets set at the lows formed within the Three Drive pattern.
Importance :
Understanding the Three Drive pattern's significance extends beyond mere technical analysis. It bears resemblance to other established patterns, such as the Harmonic Pattern and Ending Diagonal within the Elliott Wave Theory.
Recognizing these parallels aids traders in comprehending broader market dynamics and potential price movements.
🔵 Formation of 3 Drive in Order Block Zone
The convergence of the Three Drive pattern with the concept of the Order Block Zone introduces a nuanced layer to traders' analytical approach.
In "Price Action" methodology, Order Blocks represent areas on the price chart where significant market players, such as institutional traders, have executed notable orders.
These zones often act as barriers, with price encountering resistance or support upon reaching them.
When the Three Drive pattern forms within an Order Block Zone, it signifies a confluence of market dynamics.
The completion of the pattern within this zone suggests a potential reversal in the prevailing trend, augmented by the presence of significant institutional orders.
Traders incorporate these Order Blocks into their analysis to identify probable levels where price may change direction, enhancing the reliability of their trading decisions.
🔵 How to Use :
To effectively utilize the Three Drive pattern within the Order Block Zone, traders seek alignment between the completion of the pattern and the presence of significant Order Blocks.
This convergence enhances the reliability of the pattern's signals, increasing the likelihood of successful trade outcomes.
Bullish Three Drive in Demand Zone :
Bearish Three Drive in Supply Zone :
Settings :
You can set your desired "Pivot Period" via settings for the indicator to identify setups based on it.

Gartley Harmonic Pattern [TradingFinder] Harmonic Chart patterns🔵 Introduction
Research by H.M. Gartley and Scott Carney emphasizes the importance of harmonic patterns in technical analysis for predicting market movements. Gartley's work, particularly the Gartley 222 pattern, is detailed in his book "Profits in the Stock Market" and relies on the specific placement of points X, A, B, C, and D.
🟣 Defining the Gartley Pattern
The Gartley pattern is a powerful technical analysis tool often seen at the end of a trend, signaling a potential reversal. Ideally, it forms during the first and second waves of Elliott Wave theory, with wave XA representing wave 1 and the entire ABCD correction representing wave 2.
While patterns outside this structure are also valid, the key points of the Gartley pattern align closely with Fibonacci retracement levels. Specifically, point B corrects wave XA to the 61.8% level, point C lies between 38% and 79% of wave AB, and point D extends between 113% and 162% of wave BC.
The bullish Gartley pattern, shown below, forms at the end of a downtrend and signals a potential buying opportunity.
Bullish :
Bearish :
🔵 How to Use
🟣 Bullish Gartley Pattern
To spot a bullish Gartley pattern, follow these rules: the move from point X to point A (the first leg) must be upward. The subsequent move from point A to point B is downward, followed by an upward move from point B to point C.
Finally, the move from point C to point D is downward. On a chart, this pattern resembles the letter M. After the final leg of this pattern, prices are expected to rise from point D.
🟣 Bearish Gartley Pattern
A bearish Gartley pattern forms similarly to the bullish one but in reverse. The initial move from point X to point A should be downward. The next move from point A to point B is upward, followed by a downward move from point B to point C.
The final leg moves upward from point C to point D. This pattern appears as a W on charts, indicating that prices are likely to fall from point D after the final move.
By understanding and identifying Gartley patterns, traders can enhance their technical analysis and improve their decision-making in financial markets. These patterns, when correctly identified, offer significant insights into potential market reversals and continuation patterns.
🔵 Setting
🟣 Logical Setting
ZigZag Pivot Period : You can adjust the period so that the harmonic patterns are adjusted according to the pivot period you want. This factor is the most important parameter in pattern recognition.
Show Valid Format : If this parameter is on "On" mode, only patterns will be displayed that they have exact format and no noise can be seen in them. If "Off" is, the patterns displayed that maybe are noisy and do not exactly correspond to the original pattern
Show Formation Last Pivot Confirm : if Turned on, you can see this ability of patterns when their last pivot is formed. If this feature is off, it will see the patterns as soon as they are formed. The advantage of this option being clear is less formation of fielded patterns, and it is accompanied by the latest pattern seeing and a sharp reduction in reward to risk.
Period of Formation Last Pivot : Using this parameter you can determine that the last pivot is based on Pivot period.
🟣 Genaral Setting
Show : Enter "On" to display the template and "Off" to not display the template.
Color : Enter the desired color to draw the pattern in this parameter.
LineWidth : You can enter the number 1 or numbers higher than one to adjust the thickness of the drawing lines. This number must be an integer and increases with increasing thickness.
LabelSize : You can adjust the size of the labels by using the "size.auto", "size.tiny", "size.smal", "size.normal", "size.large" or "size.huge" entries.
🟣 Alert Setting
Alert : On / Off
Message Frequency : This string parameter defines the announcement frequency. Choices include: "All" (activates the alert every time the function is called), "Once Per Bar" (activates the alert only on the first call within the bar), and "Once Per Bar Close" (the alert is activated only by a call at the last script execution of the real-time bar upon closing). The default setting is "Once per Bar".
Show Alert Time by Time Zone : The date, hour, and minute you receive in alert messages can be based on any time zone you choose. For example, if you want New York time, you should enter "UTC-4". This input is set to the time zone "UTC" by default.

Crab Harmonic Pattern [TradingFinder] Harmonic Chart patterns🔵 Introduction
The Crab pattern is recognized as a reversal pattern in technical analysis, utilizing Fibonacci numbers and percentages for chart analysis. This pattern can predict suitable price reversal areas on charts using Fibonacci ratios.
The structure of the Crab pattern can manifest in both bullish and bearish forms on the chart. By analyzing this structure, traders can identify points where the price direction changes, which are essential for making informed trading decisions.
The pattern's structure is visually represented on charts as shown below. To gain a deeper understanding of the Crab pattern's functionality, it is beneficial to become familiar with its various harmonic forms.
🟣 Types of Crab Patterns
The Crab pattern is categorized into two types based on its structure: bullish and bearish. The bullish Crab is denoted by the letter M, while the bearish Crab is indicated by the letter W in technical analysis.
Typically, a bullish Crab pattern signals a potential price increase, whereas a bearish Crab pattern suggests a potential price decrease on the chart.
The direction of price movement depends significantly on the price's position within the chart. By identifying whether the pattern is bullish or bearish, traders can determine the likely direction of the price reversal.
Bullish Crab :
Bearish Crab :
🔵 How to Use
When trading using the Crab pattern, crucial parameters include the end time of the correction and the point at which the chart reaches its peak. Generally, the best time to buy is when the chart nears the end of its correction, and the best time to sell is when it approaches the peak price.
As we discussed, the end of the price correction and the time to reach the peak are measured using Fibonacci ratios. By analyzing these levels, traders can estimate the end of the correction in the chart waves and select a buying position for their stock or asset upon reaching that ratio.
🟣 Bullish Crab Pattern
In this pattern, the stock price is expected to rise at the pattern's completion, transitioning into an upward trend. The bullish Crab pattern usually begins with an upward trend, followed by a price correction, after which the stock resumes its upward movement.
If a deeper correction occurs, the price will change direction at some point on the chart and rise again towards its target price. Price corrections play a critical role in this pattern, as it aims to identify entry and exit points using Fibonacci ratios, allowing traders to make purchases at the end of the corrections.
When the price movement lines are connected on the chart, the bullish Crab pattern resembles the letter M.
🟣 Bearish Crab Pattern
In this pattern, the stock price is expected to decline at the pattern's completion, leading to a strong downward trend. The bearish Crab pattern typically starts with a price correction in a downward trend and, after several fluctuations, reaches a peak where the direction changes downward, resulting in a significant price drop.
This pattern uses Fibonacci ratios to identify points where the price movement is likely to change direction, enabling traders to exit their positions at the chart's peak. When the price movement lines are connected on the chart, the bearish Crab pattern resembles the letter W.
🔵 Setting
🟣 Logical Setting
ZigZag Pivot Period : You can adjust the period so that the harmonic patterns are adjusted according to the pivot period you want. This factor is the most important parameter in pattern recognition.
Show Valid Format : If this parameter is on "On" mode, only patterns will be displayed that they have exact format and no noise can be seen in them. If "Off" is, the patterns displayed that maybe are noisy and do not exactly correspond to the original pattern.
Show Formation Last Pivot Confirm : if Turned on, you can see this ability of patterns when their last pivot is formed. If this feature is off, it will see the patterns as soon as they are formed. The advantage of this option being clear is less formation of fielded patterns, and it is accompanied by the latest pattern seeing and a sharp reduction in reward to risk.
Period of Formation Last Pivot : Using this parameter you can determine that the last pivot is based on Pivot period.
🟣 Genaral Setting
Show : Enter "On" to display the template and "Off" to not display the template.
Color : Enter the desired color to draw the pattern in this parameter.
LineWidth : You can enter the number 1 or numbers higher than one to adjust the thickness of the drawing lines. This number must be an integer and increases with increasing thickness.
LabelSize : You can adjust the size of the labels by using the "size.auto", "size.tiny", "size.smal", "size.normal", "size.large" or "size.huge" entries.
🟣 Alert Setting
Alert : On / Off
Message Frequency : This string parameter defines the announcement frequency. Choices include: "All" (activates the alert every time the function is called), "Once Per Bar" (activates the alert only on the first call within the bar), and "Once Per Bar Close" (the alert is activated only by a call at the last script execution of the real-time bar upon closing). The default setting is "Once per Bar".
Show Alert Time by Time Zone : The date, hour, and minute you receive in alert messages can be based on any time zone you choose. For example, if you want New York time, you should enter "UTC-4". This input is set to the time zone "UTC" by default.

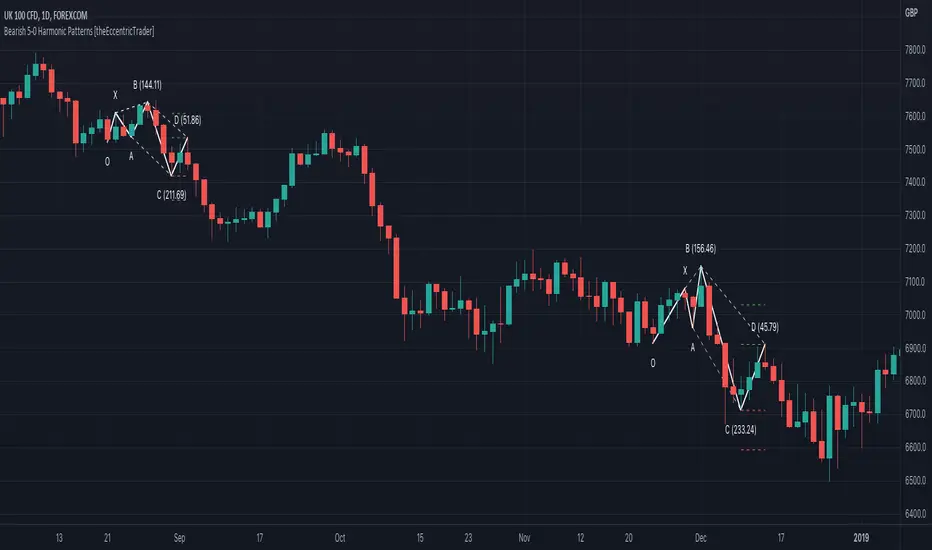
Bearish 5-0 Harmonic Patterns [theEccentricTrader]█ OVERVIEW
This indicator automatically draws bearish 5-0 harmonic patterns and price projections derived from the ranges that constitute the patterns.
█ CONCEPTS
Green and Red Candles
• A green candle is one that closes with a close price equal to or above the price it opened.
• A red candle is one that closes with a close price that is lower than the price it opened.
Swing Highs and Swing Lows
• A swing high is a green candle or series of consecutive green candles followed by a single red candle to complete the swing and form the peak.
• A swing low is a red candle or series of consecutive red candles followed by a single green candle to complete the swing and form the trough.
Peak and Trough Prices (Basic)
• The peak price of a complete swing high is the high price of either the red candle that completes the swing high or the high price of the preceding green candle, depending on which is higher.
• The trough price of a complete swing low is the low price of either the green candle that completes the swing low or the low price of the preceding red candle, depending on which is lower.
Historic Peaks and Troughs
The current, or most recent, peak and trough occurrences are referred to as occurrence zero. Previous peak and trough occurrences are referred to as historic and ordered numerically from right to left, with the most recent historic peak and trough occurrences being occurrence one.
Range
The range is simply the difference between the current peak and current trough prices, generally expressed in terms of points or pips.
Support and Resistance
• Support refers to a price level where the demand for an asset is strong enough to prevent the price from falling further.
• Resistance refers to a price level where the supply of an asset is strong enough to prevent the price from rising further.
Support and resistance levels are important because they can help traders identify where the price of an asset might pause or reverse its direction, offering potential entry and exit points. For example, a trader might look to buy an asset when it approaches a support level , with the expectation that the price will bounce back up. Alternatively, a trader might look to sell an asset when it approaches a resistance level , with the expectation that the price will drop back down.
It's important to note that support and resistance levels are not always relevant, and the price of an asset can also break through these levels and continue moving in the same direction.
Upper Trends
• A return line uptrend is formed when the current peak price is higher than the preceding peak price.
• A downtrend is formed when the current peak price is lower than the preceding peak price.
• A double-top is formed when the current peak price is equal to the preceding peak price.
Lower Trends
• An uptrend is formed when the current trough price is higher than the preceding trough price.
• A return line downtrend is formed when the current trough price is lower than the preceding trough price.
• A double-bottom is formed when the current trough price is equal to the preceding trough price.
Muti-Part Upper and Lower Trends
• A multi-part return line uptrend begins with the formation of a new return line uptrend, or higher peak, and continues until a new downtrend, or lower peak, completes the trend.
• A multi-part downtrend begins with the formation of a new downtrend, or lower peak, and continues until a new return line uptrend, or higher peak, completes the trend.
• A multi-part uptrend begins with the formation of a new uptrend, or higher trough, and continues until a new return line downtrend, or lower trough, completes the trend.
• A multi-part return line downtrend begins with the formation of a new return line downtrend, or lower trough, and continues until a new uptrend, or higher trough, completes the trend.
Wave Cycles
A wave cycle is here defined as a complete two-part move between a swing high and a swing low, or a swing low and a swing high. The first swing high or swing low will set the course for the sequence of wave cycles that follow; for example a chart that begins with a swing low will form its first complete wave cycle upon the formation of the first complete swing high and vice versa.
Figure 1.
Fibonacci Retracement and Extension Ratios
The Fibonacci sequence is a series of numbers in which each number is the sum of the two preceding numbers, starting with 0 and 1. For example 0 + 1 = 1, 1 + 1 = 2, 1 + 2 = 3, and so on. Ultimately, we could go on forever but the first few numbers in the sequence are as follows: 0 , 1, 1, 2, 3, 5, 8, 13, 21, 34, 55, 89, 144.
The extension ratios are calculated by dividing each number in the sequence by the number preceding it. For example 0/1 = 0, 1/1 = 1, 2/1 = 2, 3/2 = 1.5, 5/3 = 1.6666..., 8/5 = 1.6, 13/8 = 1.625, 21/13 = 1.6153..., 34/21 = 1.6190..., 55/34 = 1.6176..., 89/55 = 1.6181..., 144/89 = 1.6179..., and so on. The retracement ratios are calculated by inverting this process and dividing each number in the sequence by the number proceeding it. For example 0/1 = 0, 1/1 = 1, 1/2 = 0.5, 2/3 = 0.666..., 3/5 = 0.6, 5/8 = 0.625, 8/13 = 0.6153..., 13/21 = 0.6190..., 21/34 = 0.6176..., 34/55 = 0.6181..., 55/89 = 0.6179..., 89/144 = 0.6180..., and so on.
1.618 is considered to be the 'golden ratio', found in many natural phenomena such as the growth of seashells and the branching of trees. Some now speculate the universe oscillates at a frequency of 0,618 Hz, which could help to explain such phenomena, but this theory has yet to be proven.
Traders and analysts use Fibonacci retracement and extension indicators, consisting of horizontal lines representing different Fibonacci ratios, for identifying potential levels of support and resistance. Fibonacci ranges are typically drawn from left to right, with retracement levels representing ratios inside of the current range and extension levels representing ratios extended outside of the current range. If the current wave cycle ends on a swing low, the Fibonacci range is drawn from peak to trough. If the current wave cycle ends on a swing high the Fibonacci range is drawn from trough to peak.
Harmonic Patterns
The concept of harmonic patterns in trading was first introduced by H.M. Gartley in his book "Profits in the Stock Market", published in 1935. Gartley observed that markets have a tendency to move in repetitive patterns, and he identified several specific patterns that he believed could be used to predict future price movements.
Since then, many other traders and analysts have built upon Gartley's work and developed their own variations of harmonic patterns. One such contributor is Larry Pesavento, who developed his own methods for measuring harmonic patterns using Fibonacci ratios. Pesavento has written several books on the subject of harmonic patterns and Fibonacci ratios in trading. Another notable contributor to harmonic patterns is Scott Carney, who developed his own approach to harmonic trading in the late 1990s and also popularised the use of Fibonacci ratios to measure harmonic patterns. Carney expanded on Gartley's work and also introduced several new harmonic patterns, such as the Shark pattern and the 5-0 pattern.
The bullish and bearish Gartley patterns are the oldest recognized harmonic patterns in trading and all the other harmonic patterns are ultimately modifications of the original Gartley patterns. Gartley patterns are fundamentally composed of 5 points, or 4 waves.
Bullish and Bearish 5-0 Patterns
• Bullish 5-0 patterns are fundamentally composed of three peaks and three troughs, with the second peak being lower than the first peak and the third peak being higher than the first peak. And similarly, the second trough being lower than the first trough and the third trough being higher than both the first and second troughs.
• Bearish 5-0 patterns are fundamentally composed of three troughs and three peaks, with the second trough being higher than the first trough and the third trough being lower than the first trough. And similarly, the second peak being higher than the first peak and the third peak being lower than both the first and second peaks.
The ratio measurements recommended by Scott Carney, who originated the pattern, are as follows:
• Wave 1 of the pattern, referred to as OX, has no specific ratio requirements.
• Wave 2 of the pattern, referred to as XA, has no specific ratio requirements.
• Wave 3 of the pattern, referred to as AB, should extend to at least 113%, but no further than 161.8% of the range set by wave 2.
• Wave 4 of the pattern, referred to as BC, should extend to at least 161.8%, but no further than 224% of the range set by wave 3.
• Wave 5 of the pattern, referred to as CD, should retrace to 50.0% of the range set by wave 4.
Measurement Tolerances
In general, tolerance in measurements refers to the allowable variation or deviation from a specific value or dimension. It is the range within which a particular measurement is considered to be acceptable or accurate. In this script I have applied this concept to the measurement of harmonic pattern ratios to increase to the frequency of pattern occurrences.
For example, the AB measurement of Gartley patterns is generally set at around 61.8%, but with such specificity in the measuring requirements the patterns are very rare. We can increase the frequency of pattern occurrences by setting a tolerance. A tolerance of 10% to both downside and upside, which is the default setting for all tolerances, means we would have a tolerable measurement range between 51.8-71.8%, thus increasing the frequency of occurrence.
█ FEATURES
Inputs
• AB Lower Tolerance
• AB Upper Tolerance
• BC Lower Tolerance
• BC Upper Tolerance
• CD Lower Tolerance
• CD Upper Tolerance
• Pattern Color
• Label Color
• Show Projections
• Extend Current Projection Lines
█ LIMITATIONS
All green and red candle calculations are based on differences between open and close prices, as such I have made no attempt to account for green candles that gap lower and close below the close price of the preceding candle, or red candles that gap higher and close above the close price of the preceding candle. This may cause some unexpected behaviour on some markets and timeframes. I can only recommend using 24-hour markets, if and where possible, as there are far fewer gaps and, generally, more data to work with.
█ NOTES
Here is a link to Scott's harmonic patterns webpage for those who may be interested: harmonictrader.com
Bullish 5-0 Harmonic Patterns [theEccentricTrader]█ OVERVIEW
This indicator automatically draws bullish 5-0 harmonic patterns and price projections derived from the ranges that constitute the patterns.
█ CONCEPTS
Green and Red Candles
• A green candle is one that closes with a close price equal to or above the price it opened.
• A red candle is one that closes with a close price that is lower than the price it opened.
Swing Highs and Swing Lows
• A swing high is a green candle or series of consecutive green candles followed by a single red candle to complete the swing and form the peak.
• A swing low is a red candle or series of consecutive red candles followed by a single green candle to complete the swing and form the trough.
Peak and Trough Prices (Basic)
• The peak price of a complete swing high is the high price of either the red candle that completes the swing high or the high price of the preceding green candle, depending on which is higher.
• The trough price of a complete swing low is the low price of either the green candle that completes the swing low or the low price of the preceding red candle, depending on which is lower.
Historic Peaks and Troughs
The current, or most recent, peak and trough occurrences are referred to as occurrence zero. Previous peak and trough occurrences are referred to as historic and ordered numerically from right to left, with the most recent historic peak and trough occurrences being occurrence one.
Range
The range is simply the difference between the current peak and current trough prices, generally expressed in terms of points or pips.
Support and Resistance
• Support refers to a price level where the demand for an asset is strong enough to prevent the price from falling further.
• Resistance refers to a price level where the supply of an asset is strong enough to prevent the price from rising further.
Support and resistance levels are important because they can help traders identify where the price of an asset might pause or reverse its direction, offering potential entry and exit points. For example, a trader might look to buy an asset when it approaches a support level , with the expectation that the price will bounce back up. Alternatively, a trader might look to sell an asset when it approaches a resistance level , with the expectation that the price will drop back down.
It's important to note that support and resistance levels are not always relevant, and the price of an asset can also break through these levels and continue moving in the same direction.
Upper Trends
• A return line uptrend is formed when the current peak price is higher than the preceding peak price.
• A downtrend is formed when the current peak price is lower than the preceding peak price.
• A double-top is formed when the current peak price is equal to the preceding peak price.
Lower Trends
• An uptrend is formed when the current trough price is higher than the preceding trough price.
• A return line downtrend is formed when the current trough price is lower than the preceding trough price.
• A double-bottom is formed when the current trough price is equal to the preceding trough price.
Muti-Part Upper and Lower Trends
• A multi-part return line uptrend begins with the formation of a new return line uptrend, or higher peak, and continues until a new downtrend, or lower peak, completes the trend.
• A multi-part downtrend begins with the formation of a new downtrend, or lower peak, and continues until a new return line uptrend, or higher peak, completes the trend.
• A multi-part uptrend begins with the formation of a new uptrend, or higher trough, and continues until a new return line downtrend, or lower trough, completes the trend.
• A multi-part return line downtrend begins with the formation of a new return line downtrend, or lower trough, and continues until a new uptrend, or higher trough, completes the trend.
Wave Cycles
A wave cycle is here defined as a complete two-part move between a swing high and a swing low, or a swing low and a swing high. The first swing high or swing low will set the course for the sequence of wave cycles that follow; for example a chart that begins with a swing low will form its first complete wave cycle upon the formation of the first complete swing high and vice versa.
Figure 1.
Fibonacci Retracement and Extension Ratios
The Fibonacci sequence is a series of numbers in which each number is the sum of the two preceding numbers, starting with 0 and 1. For example 0 + 1 = 1, 1 + 1 = 2, 1 + 2 = 3, and so on. Ultimately, we could go on forever but the first few numbers in the sequence are as follows: 0 , 1, 1, 2, 3, 5, 8, 13, 21, 34, 55, 89, 144.
The extension ratios are calculated by dividing each number in the sequence by the number preceding it. For example 0/1 = 0, 1/1 = 1, 2/1 = 2, 3/2 = 1.5, 5/3 = 1.6666..., 8/5 = 1.6, 13/8 = 1.625, 21/13 = 1.6153..., 34/21 = 1.6190..., 55/34 = 1.6176..., 89/55 = 1.6181..., 144/89 = 1.6179..., and so on. The retracement ratios are calculated by inverting this process and dividing each number in the sequence by the number proceeding it. For example 0/1 = 0, 1/1 = 1, 1/2 = 0.5, 2/3 = 0.666..., 3/5 = 0.6, 5/8 = 0.625, 8/13 = 0.6153..., 13/21 = 0.6190..., 21/34 = 0.6176..., 34/55 = 0.6181..., 55/89 = 0.6179..., 89/144 = 0.6180..., and so on.
1.618 is considered to be the 'golden ratio', found in many natural phenomena such as the growth of seashells and the branching of trees. Some now speculate the universe oscillates at a frequency of 0,618 Hz, which could help to explain such phenomena, but this theory has yet to be proven.
Traders and analysts use Fibonacci retracement and extension indicators, consisting of horizontal lines representing different Fibonacci ratios, for identifying potential levels of support and resistance. Fibonacci ranges are typically drawn from left to right, with retracement levels representing ratios inside of the current range and extension levels representing ratios extended outside of the current range. If the current wave cycle ends on a swing low, the Fibonacci range is drawn from peak to trough. If the current wave cycle ends on a swing high the Fibonacci range is drawn from trough to peak.
Harmonic Patterns
The concept of harmonic patterns in trading was first introduced by H.M. Gartley in his book "Profits in the Stock Market", published in 1935. Gartley observed that markets have a tendency to move in repetitive patterns, and he identified several specific patterns that he believed could be used to predict future price movements.
Since then, many other traders and analysts have built upon Gartley's work and developed their own variations of harmonic patterns. One such contributor is Larry Pesavento, who developed his own methods for measuring harmonic patterns using Fibonacci ratios. Pesavento has written several books on the subject of harmonic patterns and Fibonacci ratios in trading. Another notable contributor to harmonic patterns is Scott Carney, who developed his own approach to harmonic trading in the late 1990s and also popularised the use of Fibonacci ratios to measure harmonic patterns. Carney expanded on Gartley's work and also introduced several new harmonic patterns, such as the Shark pattern and the 5-0 pattern.
The bullish and bearish Gartley patterns are the oldest recognized harmonic patterns in trading and all the other harmonic patterns are ultimately modifications of the original Gartley patterns. Gartley patterns are fundamentally composed of 5 points, or 4 waves.
Bullish and Bearish 5-0 Patterns
• Bullish 5-0 patterns are fundamentally composed of three peaks and three troughs, with the second peak being lower than the first peak and the third peak being higher than the first peak. And similarly, the second trough being lower than the first trough and the third trough being higher than both the first and second troughs.
• Bearish 5-0 patterns are fundamentally composed of three troughs and three peaks, with the second trough being higher than the first trough and the third trough being lower than the first trough. And similarly, the second peak being higher than the first peak and the third peak being lower than both the first and second peaks.
The ratio measurements recommended by Scott Carney, who originated the pattern, are as follows:
• Wave 1 of the pattern, referred to as OX, has no specific ratio requirements.
• Wave 2 of the pattern, referred to as XA, has no specific ratio requirements.
• Wave 3 of the pattern, referred to as AB, should extend to at least 113%, but no further than 161.8% of the range set by wave 2.
• Wave 4 of the pattern, referred to as BC, should extend to at least 161.8%, but no further than 224% of the range set by wave 3.
• Wave 5 of the pattern, referred to as CD, should retrace to 50.0% of the range set by wave 4.
Measurement Tolerances
In general, tolerance in measurements refers to the allowable variation or deviation from a specific value or dimension. It is the range within which a particular measurement is considered to be acceptable or accurate. In this script I have applied this concept to the measurement of harmonic pattern ratios to increase to the frequency of pattern occurrences.
For example, the AB measurement of Gartley patterns is generally set at around 61.8%, but with such specificity in the measuring requirements the patterns are very rare. We can increase the frequency of pattern occurrences by setting a tolerance. A tolerance of 10% to both downside and upside, which is the default setting for all tolerances, means we would have a tolerable measurement range between 51.8-71.8%, thus increasing the frequency of occurrence.
█ FEATURES
Inputs
• AB Lower Tolerance
• AB Upper Tolerance
• BC Lower Tolerance
• BC Upper Tolerance
• CD Lower Tolerance
• CD Upper Tolerance
• Pattern Color
• Label Color
• Show Projections
• Extend Current Projection Lines
█ LIMITATIONS
All green and red candle calculations are based on differences between open and close prices, as such I have made no attempt to account for green candles that gap lower and close below the close price of the preceding candle, or red candles that gap higher and close above the close price of the preceding candle. This may cause some unexpected behaviour on some markets and timeframes. I can only recommend using 24-hour markets, if and where possible, as there are far fewer gaps and, generally, more data to work with.
█ NOTES
Here is a link to Scott's harmonic patterns webpage for those who may be interested: harmonictrader.com

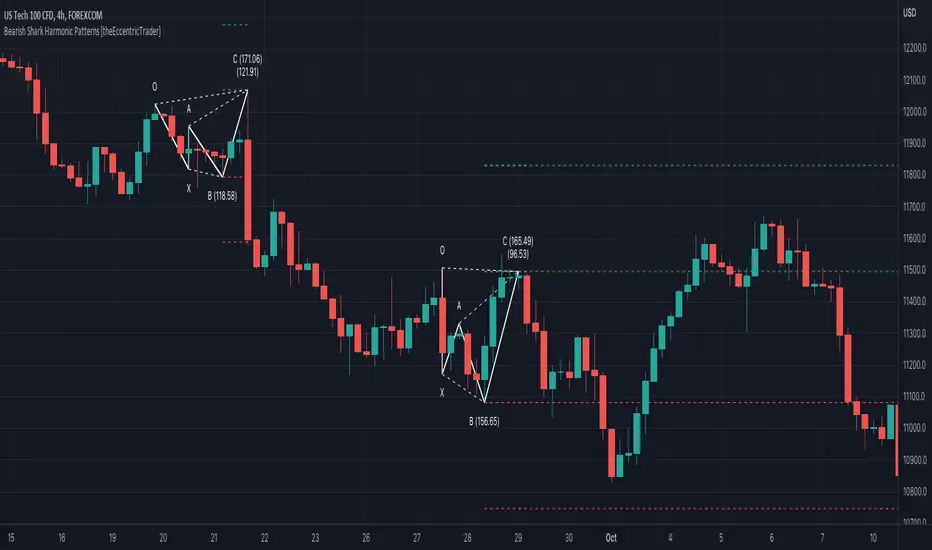
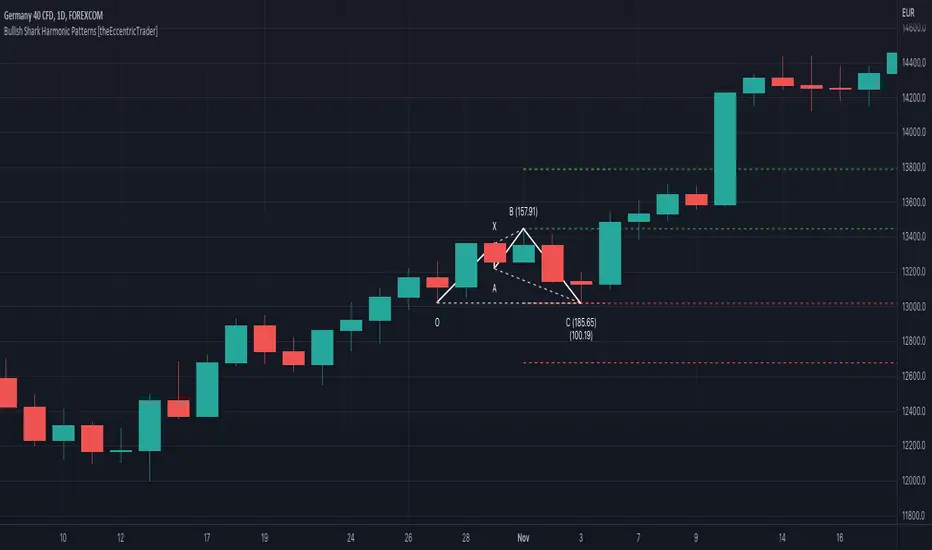
Bearish Shark Harmonic Patterns [theEccentricTrader]█ OVERVIEW
This indicator automatically draws bearish Shark harmonic patterns and price projections derived from the ranges that constitute the patterns.
█ CONCEPTS
Green and Red Candles
• A green candle is one that closes with a close price equal to or above the price it opened.
• A red candle is one that closes with a close price that is lower than the price it opened.
Swing Highs and Swing Lows
• A swing high is a green candle or series of consecutive green candles followed by a single red candle to complete the swing and form the peak.
• A swing low is a red candle or series of consecutive red candles followed by a single green candle to complete the swing and form the trough.
Peak and Trough Prices (Basic)
• The peak price of a complete swing high is the high price of either the red candle that completes the swing high or the high price of the preceding green candle, depending on which is higher.
• The trough price of a complete swing low is the low price of either the green candle that completes the swing low or the low price of the preceding red candle, depending on which is lower.
Historic Peaks and Troughs
The current, or most recent, peak and trough occurrences are referred to as occurrence zero. Previous peak and trough occurrences are referred to as historic and ordered numerically from right to left, with the most recent historic peak and trough occurrences being occurrence one.
Range
The range is simply the difference between the current peak and current trough prices, generally expressed in terms of points or pips.
Support and Resistance
• Support refers to a price level where the demand for an asset is strong enough to prevent the price from falling further.
• Resistance refers to a price level where the supply of an asset is strong enough to prevent the price from rising further.
Support and resistance levels are important because they can help traders identify where the price of an asset might pause or reverse its direction, offering potential entry and exit points. For example, a trader might look to buy an asset when it approaches a support level , with the expectation that the price will bounce back up. Alternatively, a trader might look to sell an asset when it approaches a resistance level , with the expectation that the price will drop back down.
It's important to note that support and resistance levels are not always relevant, and the price of an asset can also break through these levels and continue moving in the same direction.
Upper Trends
• A return line uptrend is formed when the current peak price is higher than the preceding peak price.
• A downtrend is formed when the current peak price is lower than the preceding peak price.
• A double-top is formed when the current peak price is equal to the preceding peak price.
Lower Trends
• An uptrend is formed when the current trough price is higher than the preceding trough price.
• A return line downtrend is formed when the current trough price is lower than the preceding trough price.
• A double-bottom is formed when the current trough price is equal to the preceding trough price.
Muti-Part Upper and Lower Trends
• A multi-part return line uptrend begins with the formation of a new return line uptrend, or higher peak, and continues until a new downtrend, or lower peak, completes the trend.
• A multi-part downtrend begins with the formation of a new downtrend, or lower peak, and continues until a new return line uptrend, or higher peak, completes the trend.
• A multi-part uptrend begins with the formation of a new uptrend, or higher trough, and continues until a new return line downtrend, or lower trough, completes the trend.
• A multi-part return line downtrend begins with the formation of a new return line downtrend, or lower trough, and continues until a new uptrend, or higher trough, completes the trend.
Wave Cycles
A wave cycle is here defined as a complete two-part move between a swing high and a swing low, or a swing low and a swing high. The first swing high or swing low will set the course for the sequence of wave cycles that follow; for example a chart that begins with a swing low will form its first complete wave cycle upon the formation of the first complete swing high and vice versa.
Figure 1.
Fibonacci Retracement and Extension Ratios
The Fibonacci sequence is a series of numbers in which each number is the sum of the two preceding numbers, starting with 0 and 1. For example 0 + 1 = 1, 1 + 1 = 2, 1 + 2 = 3, and so on. Ultimately, we could go on forever but the first few numbers in the sequence are as follows: 0 , 1, 1, 2, 3, 5, 8, 13, 21, 34, 55, 89, 144.
The extension ratios are calculated by dividing each number in the sequence by the number preceding it. For example 0/1 = 0, 1/1 = 1, 2/1 = 2, 3/2 = 1.5, 5/3 = 1.6666..., 8/5 = 1.6, 13/8 = 1.625, 21/13 = 1.6153..., 34/21 = 1.6190..., 55/34 = 1.6176..., 89/55 = 1.6181..., 144/89 = 1.6179..., and so on. The retracement ratios are calculated by inverting this process and dividing each number in the sequence by the number proceeding it. For example 0/1 = 0, 1/1 = 1, 1/2 = 0.5, 2/3 = 0.666..., 3/5 = 0.6, 5/8 = 0.625, 8/13 = 0.6153..., 13/21 = 0.6190..., 21/34 = 0.6176..., 34/55 = 0.6181..., 55/89 = 0.6179..., 89/144 = 0.6180..., and so on.
1.618 is considered to be the 'golden ratio', found in many natural phenomena such as the growth of seashells and the branching of trees. Some now speculate the universe oscillates at a frequency of 0,618 Hz, which could help to explain such phenomena, but this theory has yet to be proven.
Traders and analysts use Fibonacci retracement and extension indicators, consisting of horizontal lines representing different Fibonacci ratios, for identifying potential levels of support and resistance. Fibonacci ranges are typically drawn from left to right, with retracement levels representing ratios inside of the current range and extension levels representing ratios extended outside of the current range. If the current wave cycle ends on a swing low, the Fibonacci range is drawn from peak to trough. If the current wave cycle ends on a swing high the Fibonacci range is drawn from trough to peak.
Harmonic Patterns
The concept of harmonic patterns in trading was first introduced by H.M. Gartley in his book "Profits in the Stock Market", published in 1935. Gartley observed that markets have a tendency to move in repetitive patterns, and he identified several specific patterns that he believed could be used to predict future price movements.
Since then, many other traders and analysts have built upon Gartley's work and developed their own variations of harmonic patterns. One such contributor is Larry Pesavento, who developed his own methods for measuring harmonic patterns using Fibonacci ratios. Pesavento has written several books on the subject of harmonic patterns and Fibonacci ratios in trading. Another notable contributor to harmonic patterns is Scott Carney, who developed his own approach to harmonic trading in the late 1990s and also popularised the use of Fibonacci ratios to measure harmonic patterns. Carney expanded on Gartley's work and also introduced several new harmonic patterns, such as the Shark pattern and the 5-0 pattern.
The bullish and bearish Gartley patterns are the oldest recognized harmonic patterns in trading and all the other harmonic patterns are ultimately modifications of the original Gartley patterns. Gartley patterns are fundamentally composed of 5 points, or 4 waves.
Bullish and Bearish Shark Patterns
• Bullish shark patterns are fundamentally composed of three troughs and two peaks, with the second peak being higher than the first peak and the second trough being higher than the first trough. The third trough must be lower than the second trough but can be above or below the first trough providing it meets the ratio requirements.
• Bearish shark patterns are fundamentally composed of three peaks and two troughs, with the second trough being lower than the first trough and the second peak being lower than the first peak. The third peak must be higher than the second peak but can be above or below the first peak providing it meets the ratio requirements.
The ratio measurements recommended by Scott Carney, who originated the pattern, are as follows:
• Wave 1 of the pattern, referred to as OX, has no specific ratio requirements.
• Wave 2 of the pattern, referred to as XA, has no specific ratio requirements.
• Wave 3 of the pattern, referred to as AB, should extend to at least 113%, but no further than 161.8% of the range set by wave 2.
• Wave 4 of the pattern, referred to as BC, should extend to at least 161.8%, but no further than 224% of the range set by wave 3.
• The last measure, referred to as XC, is that of wave 4 as a ratio of the range set by wave 1, which should extend to at least 88.6%, but no further than 113%.
Measurement Tolerances
In general, tolerance in measurements refers to the allowable variation or deviation from a specific value or dimension. It is the range within which a particular measurement is considered to be acceptable or accurate. In this script I have applied this concept to the measurement of harmonic pattern ratios to increase to the frequency of pattern occurrences.
For example, the AB measurement of Gartley patterns is generally set at around 61.8%, but with such specificity in the measuring requirements the patterns are very rare. We can increase the frequency of pattern occurrences by setting a tolerance. A tolerance of 10% to both downside and upside, which is the default setting for all tolerances, means we would have a tolerable measurement range between 51.8-71.8%, thus increasing the frequency of occurrence.
█ FEATURES
Inputs
• AB Lower Tolerance
• AB Upper Tolerance
• BC Lower Tolerance
• BC Upper Tolerance
• XC Lower Tolerance
• XC Upper Tolerance
• Pattern Color
• Label Color
• Show Projections
• Extend Current Projection Lines
█ LIMITATIONS
All green and red candle calculations are based on differences between open and close prices, as such I have made no attempt to account for green candles that gap lower and close below the close price of the preceding candle, or red candles that gap higher and close above the close price of the preceding candle. This may cause some unexpected behaviour on some markets and timeframes. I can only recommend using 24-hour markets, if and where possible, as there are far fewer gaps and, generally, more data to work with.
█ NOTES
Here is a link to Scott's harmonic patterns webpage for those who may be interested: harmonictrader.com
Bullish Shark Harmonic Patterns [theEccentricTrader]█ OVERVIEW
This indicator automatically draws bullish Shark harmonic patterns and price projections derived from the ranges that constitute the patterns.
█ CONCEPTS
Green and Red Candles
• A green candle is one that closes with a close price equal to or above the price it opened.
• A red candle is one that closes with a close price that is lower than the price it opened.
Swing Highs and Swing Lows
• A swing high is a green candle or series of consecutive green candles followed by a single red candle to complete the swing and form the peak.
• A swing low is a red candle or series of consecutive red candles followed by a single green candle to complete the swing and form the trough.
Peak and Trough Prices (Basic)
• The peak price of a complete swing high is the high price of either the red candle that completes the swing high or the high price of the preceding green candle, depending on which is higher.
• The trough price of a complete swing low is the low price of either the green candle that completes the swing low or the low price of the preceding red candle, depending on which is lower.
Historic Peaks and Troughs
The current, or most recent, peak and trough occurrences are referred to as occurrence zero. Previous peak and trough occurrences are referred to as historic and ordered numerically from right to left, with the most recent historic peak and trough occurrences being occurrence one.
Range
The range is simply the difference between the current peak and current trough prices, generally expressed in terms of points or pips.
Support and Resistance
• Support refers to a price level where the demand for an asset is strong enough to prevent the price from falling further.
• Resistance refers to a price level where the supply of an asset is strong enough to prevent the price from rising further.
Support and resistance levels are important because they can help traders identify where the price of an asset might pause or reverse its direction, offering potential entry and exit points. For example, a trader might look to buy an asset when it approaches a support level , with the expectation that the price will bounce back up. Alternatively, a trader might look to sell an asset when it approaches a resistance level , with the expectation that the price will drop back down.
It's important to note that support and resistance levels are not always relevant, and the price of an asset can also break through these levels and continue moving in the same direction.
Upper Trends
• A return line uptrend is formed when the current peak price is higher than the preceding peak price.
• A downtrend is formed when the current peak price is lower than the preceding peak price.
• A double-top is formed when the current peak price is equal to the preceding peak price.
Lower Trends
• An uptrend is formed when the current trough price is higher than the preceding trough price.
• A return line downtrend is formed when the current trough price is lower than the preceding trough price.
• A double-bottom is formed when the current trough price is equal to the preceding trough price.
Muti-Part Upper and Lower Trends
• A multi-part return line uptrend begins with the formation of a new return line uptrend, or higher peak, and continues until a new downtrend, or lower peak, completes the trend.
• A multi-part downtrend begins with the formation of a new downtrend, or lower peak, and continues until a new return line uptrend, or higher peak, completes the trend.
• A multi-part uptrend begins with the formation of a new uptrend, or higher trough, and continues until a new return line downtrend, or lower trough, completes the trend.
• A multi-part return line downtrend begins with the formation of a new return line downtrend, or lower trough, and continues until a new uptrend, or higher trough, completes the trend.
Wave Cycles
A wave cycle is here defined as a complete two-part move between a swing high and a swing low, or a swing low and a swing high. The first swing high or swing low will set the course for the sequence of wave cycles that follow; for example a chart that begins with a swing low will form its first complete wave cycle upon the formation of the first complete swing high and vice versa.
Figure 1.
Fibonacci Retracement and Extension Ratios
The Fibonacci sequence is a series of numbers in which each number is the sum of the two preceding numbers, starting with 0 and 1. For example 0 + 1 = 1, 1 + 1 = 2, 1 + 2 = 3, and so on. Ultimately, we could go on forever but the first few numbers in the sequence are as follows: 0 , 1, 1, 2, 3, 5, 8, 13, 21, 34, 55, 89, 144.
The extension ratios are calculated by dividing each number in the sequence by the number preceding it. For example 0/1 = 0, 1/1 = 1, 2/1 = 2, 3/2 = 1.5, 5/3 = 1.6666..., 8/5 = 1.6, 13/8 = 1.625, 21/13 = 1.6153..., 34/21 = 1.6190..., 55/34 = 1.6176..., 89/55 = 1.6181..., 144/89 = 1.6179..., and so on. The retracement ratios are calculated by inverting this process and dividing each number in the sequence by the number proceeding it. For example 0/1 = 0, 1/1 = 1, 1/2 = 0.5, 2/3 = 0.666..., 3/5 = 0.6, 5/8 = 0.625, 8/13 = 0.6153..., 13/21 = 0.6190..., 21/34 = 0.6176..., 34/55 = 0.6181..., 55/89 = 0.6179..., 89/144 = 0.6180..., and so on.
1.618 is considered to be the 'golden ratio', found in many natural phenomena such as the growth of seashells and the branching of trees. Some now speculate the universe oscillates at a frequency of 0,618 Hz, which could help to explain such phenomena, but this theory has yet to be proven.
Traders and analysts use Fibonacci retracement and extension indicators, consisting of horizontal lines representing different Fibonacci ratios, for identifying potential levels of support and resistance. Fibonacci ranges are typically drawn from left to right, with retracement levels representing ratios inside of the current range and extension levels representing ratios extended outside of the current range. If the current wave cycle ends on a swing low, the Fibonacci range is drawn from peak to trough. If the current wave cycle ends on a swing high the Fibonacci range is drawn from trough to peak.
Harmonic Patterns
The concept of harmonic patterns in trading was first introduced by H.M. Gartley in his book "Profits in the Stock Market", published in 1935. Gartley observed that markets have a tendency to move in repetitive patterns, and he identified several specific patterns that he believed could be used to predict future price movements.
Since then, many other traders and analysts have built upon Gartley's work and developed their own variations of harmonic patterns. One such contributor is Larry Pesavento, who developed his own methods for measuring harmonic patterns using Fibonacci ratios. Pesavento has written several books on the subject of harmonic patterns and Fibonacci ratios in trading. Another notable contributor to harmonic patterns is Scott Carney, who developed his own approach to harmonic trading in the late 1990s and also popularised the use of Fibonacci ratios to measure harmonic patterns. Carney expanded on Gartley's work and also introduced several new harmonic patterns, such as the Shark pattern and the 5-0 pattern.
The bullish and bearish Gartley patterns are the oldest recognized harmonic patterns in trading and all the other harmonic patterns are ultimately modifications of the original Gartley patterns. Gartley patterns are fundamentally composed of 5 points, or 4 waves.
Bullish and Bearish Shark Patterns
• Bullish shark patterns are fundamentally composed of three troughs and two peaks, with the second peak being higher than the first peak and the second trough being higher than the first trough. The third trough must be lower than the second trough but can be above or below the first trough providing it meets the ratio requirements.
• Bearish shark patterns are fundamentally composed of three peaks and two troughs, with the second trough being lower than the first trough and the second peak being lower than the first peak. The third peak must be higher than the second peak but can be above or below the first peak providing it meets the ratio requirements.
The ratio measurements recommended by Scott Carney, who originated the pattern, are as follows:
• Wave 1 of the pattern, referred to as OX, has no specific ratio requirements.
• Wave 2 of the pattern, referred to as XA, has no specific ratio requirements.
• Wave 3 of the pattern, referred to as AB, should extend to at least 113%, but no further than 161.8% of the range set by wave 2.
• Wave 4 of the pattern, referred to as BC, should extend to at least 161.8%, but no further than 224% of the range set by wave 3.
• The last measure, referred to as XC, is that of wave 4 as a ratio of the range set by wave 1, which should extend to at least 88.6%, but no further than 113%.
Measurement Tolerances
In general, tolerance in measurements refers to the allowable variation or deviation from a specific value or dimension. It is the range within which a particular measurement is considered to be acceptable or accurate. In this script I have applied this concept to the measurement of harmonic pattern ratios to increase to the frequency of pattern occurrences.
For example, the AB measurement of Gartley patterns is generally set at around 61.8%, but with such specificity in the measuring requirements the patterns are very rare. We can increase the frequency of pattern occurrences by setting a tolerance. A tolerance of 10% to both downside and upside, which is the default setting for all tolerances, means we would have a tolerable measurement range between 51.8-71.8%, thus increasing the frequency of occurrence.
█ FEATURES
Inputs
• AB Lower Tolerance
• AB Upper Tolerance
• BC Lower Tolerance
• BC Upper Tolerance
• XC Lower Tolerance
• XC Upper Tolerance
• Pattern Color
• Label Color
• Show Projections
• Extend Current Projection Lines
█ LIMITATIONS
All green and red candle calculations are based on differences between open and close prices, as such I have made no attempt to account for green candles that gap lower and close below the close price of the preceding candle, or red candles that gap higher and close above the close price of the preceding candle. This may cause some unexpected behaviour on some markets and timeframes. I can only recommend using 24-hour markets, if and where possible, as there are far fewer gaps and, generally, more data to work with.
█ NOTES
Here is a link to Scott's harmonic patterns webpage for those who may be interested: harmonictrader.com
Butterfly Harmonic Pattern [TradingFinder] Harmonic Detector🔵 Introduction
The Butterfly Harmonic Pattern is a sophisticated and highly regarded tool in technical analysis, utilized by traders to identify potential reversal points in the financial markets. This pattern is distinguished by its reliance on Fibonacci ratios and geometric configurations, which aid in predicting price movements with remarkable precision.
The origin of the Butterfly Harmonic Pattern can be traced back to the pioneering work of Bryce Gilmore, who is credited with discovering this pattern. Gilmore's extensive research and expertise in Fibonacci ratios laid the groundwork for the identification and application of this pattern in technical analysis.
The Butterfly pattern, like other harmonic patterns, is based on the principle that market movements are not random but follow specific structures and ratios.
The pattern is characterized by a distinct "M" shape in bullish scenarios and a "W" shape in bearish scenarios, each indicating a potential reversal point. These formations are identified by specific Fibonacci retracement and extension levels, making the Butterfly pattern a powerful tool for traders seeking to capitalize on market turning points.
The precise nature of the Butterfly pattern allows for the accurate prediction of target prices and the establishment of strategic entry and exit points, making it an indispensable component of a trader's analytical arsenal.
Bullish :
Bearish :
🔵 How to Use
Like other harmonic patterns, the Butterfly pattern is categorized based on how it forms at the end of an uptrend or downtrend. Unlike the Gartley and Bat patterns, the Butterfly pattern, similar to the Crab pattern, forms outside the wave 3 range at the end of a rally.
🟣 Types of Butterfly Harmonic Patterns
🟣 Bullish Butterfly Pattern
This pattern forms at the end of a downtrend and leads to a trend reversal from a downtrend to an uptrend.
🟣 Bearish Butterfly Pattern
In contrast to the Bullish Butterfly pattern, this pattern forms at the end of an uptrend and warns analysts of a trend reversal to a downtrend. In this case, traders are encouraged to shift their trading stance from buy trades to sell trades.
Advantages and Limitations of the Butterfly Pattern in Technical Analysis :
The Butterfly pattern is considered one of the precise and stable tools in financial market analysis. However, it is always important to pay special attention to the advantages and limitations of each pattern.
Here, we review the advantages and disadvantages of using the Butterfly harmonic pattern :
The main advantage of the Butterfly pattern is providing very accurate signals.
Using Fibonacci golden ratios and geometric rules, the Butterfly pattern identifies patterns accurately and systematically. (This high accuracy significantly helps investors in making trading decisions.)
Identifying this pattern requires expertise and experience in technical analysis.
Recognizing the Butterfly pattern might be complex for beginner traders. (Correct identification of the pattern necessitates mastery over geometric principles and Fibonacci ratios.)
The Butterfly harmonic pattern might issue false trading signals. (Traders usually combine the Butterfly pattern with other technical tools to confirm buy and sell signals.)
🔵 Setting
🟣 Logical Setting
ZigZag Pivot Period : You can adjust the period so that the harmonic patterns are adjusted according to the pivot period you want. This factor is the most important parameter in pattern recognition.
Show Valid Forma t: If this parameter is on "On" mode, only patterns will be displayed that they have exact format and no noise can be seen in them. If "Off" is, the patterns displayed that maybe are noisy and do not exactly correspond to the original pattern.
Show Formation Last Pivot Confirm : if Turned on, you can see this ability of patterns when their last pivot is formed. If this feature is off, it will see the patterns as soon as they are formed. The advantage of this option being clear is less formation of fielded patterns, and it is accompanied by the latest pattern seeing and a sharp reduction in reward to risk.
Period of Formation Last Pivot : Using this parameter you can determine that the last pivot is based on Pivot period.
🟣 Genaral Setting
Show : Enter "On" to display the template and "Off" to not display the template.
Color : Enter the desired color to draw the pattern in this parameter.
LineWidth : You can enter the number 1 or numbers higher than one to adjust the thickness of the drawing lines. This number must be an integer and increases with increasing thickness.
LabelSize : You can adjust the size of the labels by using the "size.auto", "size.tiny", "size.smal", "size.normal", "size.large" or "size.huge" entries.
🟣 Alert Setting
Alert : On / Off
Message Frequency : This string parameter defines the announcement frequency. Choices include: "All" (activates the alert every time the function is called), "Once Per Bar" (activates the alert only on the first call within the bar), and "Once Per Bar Close" (the alert is activated only by a call at the last script execution of the real-time bar upon closing). The default setting is "Once per Bar".
Show Alert Time by Time Zone : The date, hour, and minute you receive in alert messages can be based on any time zone you choose. For example, if you want New York time, you should enter "UTC-4". This input is set to the time zone "UTC" by default.

Bearish Deep Crab Harmonic Patterns [theEccentricTrader]█ OVERVIEW
This indicator automatically draws bearish deep crab harmonic patterns and price projections derived from the ranges that constitute the patterns.
█ CONCEPTS
Green and Red Candles
• A green candle is one that closes with a close price equal to or above the price it opened.
• A red candle is one that closes with a close price that is lower than the price it opened.
Swing Highs and Swing Lows
• A swing high is a green candle or series of consecutive green candles followed by a single red candle to complete the swing and form the peak.
• A swing low is a red candle or series of consecutive red candles followed by a single green candle to complete the swing and form the trough.
Peak and Trough Prices (Basic)
• The peak price of a complete swing high is the high price of either the red candle that completes the swing high or the high price of the preceding green candle, depending on which is higher.
• The trough price of a complete swing low is the low price of either the green candle that completes the swing low or the low price of the preceding red candle, depending on which is lower.
Historic Peaks and Troughs
The current, or most recent, peak and trough occurrences are referred to as occurrence zero. Previous peak and trough occurrences are referred to as historic and ordered numerically from right to left, with the most recent historic peak and trough occurrences being occurrence one.
Range
The range is simply the difference between the current peak and current trough prices, generally expressed in terms of points or pips.
Support and Resistance
• Support refers to a price level where the demand for an asset is strong enough to prevent the price from falling further.
• Resistance refers to a price level where the supply of an asset is strong enough to prevent the price from rising further.
Support and resistance levels are important because they can help traders identify where the price of an asset might pause or reverse its direction, offering potential entry and exit points. For example, a trader might look to buy an asset when it approaches a support level , with the expectation that the price will bounce back up. Alternatively, a trader might look to sell an asset when it approaches a resistance level , with the expectation that the price will drop back down.
It's important to note that support and resistance levels are not always relevant, and the price of an asset can also break through these levels and continue moving in the same direction.
Upper Trends
• A return line uptrend is formed when the current peak price is higher than the preceding peak price.
• A downtrend is formed when the current peak price is lower than the preceding peak price.
• A double-top is formed when the current peak price is equal to the preceding peak price.
Lower Trends
• An uptrend is formed when the current trough price is higher than the preceding trough price.
• A return line downtrend is formed when the current trough price is lower than the preceding trough price.
• A double-bottom is formed when the current trough price is equal to the preceding trough price.
Wave Cycles
A wave cycle is here defined as a complete two-part move between a swing high and a swing low, or a swing low and a swing high. The first swing high or swing low will set the course for the sequence of wave cycles that follow; for example a chart that begins with a swing low will form its first complete wave cycle upon the formation of the first complete swing high and vice versa.
Figure 1.
Fibonacci Retracement and Extension Ratios
The Fibonacci sequence is a series of numbers in which each number is the sum of the two preceding numbers, starting with 0 and 1. For example 0 + 1 = 1, 1 + 1 = 2, 1 + 2 = 3, and so on. Ultimately, we could go on forever but the first few numbers in the sequence are as follows: 0 , 1, 1, 2, 3, 5, 8, 13, 21, 34, 55, 89, 144.
The extension ratios are calculated by dividing each number in the sequence by the number preceding it. For example 0/1 = 0, 1/1 = 1, 2/1 = 2, 3/2 = 1.5, 5/3 = 1.6666..., 8/5 = 1.6, 13/8 = 1.625, 21/13 = 1.6153..., 34/21 = 1.6190..., 55/34 = 1.6176..., 89/55 = 1.6181..., 144/89 = 1.6179..., and so on. The retracement ratios are calculated by inverting this process and dividing each number in the sequence by the number proceeding it. For example 0/1 = 0, 1/1 = 1, 1/2 = 0.5, 2/3 = 0.666..., 3/5 = 0.6, 5/8 = 0.625, 8/13 = 0.6153..., 13/21 = 0.6190..., 21/34 = 0.6176..., 34/55 = 0.6181..., 55/89 = 0.6179..., 89/144 = 0.6180..., and so on.
1.618 is considered to be the 'golden ratio', found in many natural phenomena such as the growth of seashells and the branching of trees. Some now speculate the universe oscillates at a frequency of 0,618 Hz, which could help to explain such phenomena, but this theory has yet to be proven.
Traders and analysts use Fibonacci retracement and extension indicators, consisting of horizontal lines representing different Fibonacci ratios, for identifying potential levels of support and resistance. Fibonacci ranges are typically drawn from left to right, with retracement levels representing ratios inside of the current range and extension levels representing ratios extended outside of the current range. If the current wave cycle ends on a swing low, the Fibonacci range is drawn from peak to trough. If the current wave cycle ends on a swing high the Fibonacci range is drawn from trough to peak.
Harmonic Patterns
The concept of harmonic patterns in trading was first introduced by H.M. Gartley in his book "Profits in the Stock Market", published in 1935. Gartley observed that markets have a tendency to move in repetitive patterns, and he identified several specific patterns that he believed could be used to predict future price movements.
Since then, many other traders and analysts have built upon Gartley's work and developed their own variations of harmonic patterns. One such contributor is Larry Pesavento, who developed his own methods for measuring harmonic patterns using Fibonacci ratios. Pesavento has written several books on the subject of harmonic patterns and Fibonacci ratios in trading. Another notable contributor to harmonic patterns is Scott Carney, who developed his own approach to harmonic trading in the late 1990s and also popularised the use of Fibonacci ratios to measure harmonic patterns. Carney expanded on Gartley's work and also introduced several new harmonic patterns, such as the Shark pattern and the 5-0 pattern.
The bullish and bearish Gartley patterns are the oldest recognized harmonic patterns in trading and all the other harmonic patterns are ultimately modifications of the original Gartley patterns. Gartley patterns are fundamentally composed of 5 points, or 4 waves.
Bullish and Bearish Deep Crab Patterns
• Bullish deep crab patterns are fundamentally composed of three troughs and two peaks. The second peak being lower than the first peak. And the third trough being lower than both the first and second troughs, while the second trough is higher than the first.
• Bearish deep crab patterns are fundamentally composed of three peaks and two troughs. The second trough being higher than the first trough. And the third peak being higher than both the first and second peaks, while the second peak is lower than the first.
The ratio measurements recommended by Scott Carney, who originated the pattern, are as follows:
• Wave 1 of the pattern, generally referred to as XA, has no specific ratio requirements.
• Wave 2 of the pattern, generally referred to as AB, should retrace to 88.6% of the range set by wave 1.
• Wave 3 of the pattern, generally referred to as BC, should retrace by at least 38.2%, but no further than 88.6% of the range set by wave 2.
• Wave 4 of the pattern, generally referred to as CD, should extend to at least 200%, but no further than 361.8% of the range set by wave 3.
• The last measure, generally referred to as AD, is that of wave 4 as a ratio of the range set by wave 1, which should extend to 161.8%.
Measurement Tolerances
In general, tolerance in measurements refers to the allowable variation or deviation from a specific value or dimension. It is the range within which a particular measurement is considered to be acceptable or accurate. In this script I have applied this concept to the measurement of harmonic pattern ratios to increase to the frequency of pattern occurrences.
For example, the AB measurement of Gartley patterns is generally set at around 61.8%, but with such specificity in the measuring requirements the patterns are very rare. We can increase the frequency of pattern occurrences by setting a tolerance. A tolerance of 10% to both downside and upside, which is the default setting for all tolerances, means we would have a tolerable measurement range between 51.8-71.8%, thus increasing the frequency of occurrence.
█ FEATURES
Inputs
• AB Lower Tolerance
• AB Upper Tolerance
• BC Lower Tolerance
• BC Upper Tolerance
• CD Lower Tolerance
• CD Upper Tolerance
• AD Lower Tolerance
• AD Upper Tolerance
• Pattern Color
• Label Color
• Show Projections
• Extend Current Projection Lines
Alerts
Users can set alerts for when the patterns occur.
█ LIMITATIONS
All green and red candle calculations are based on differences between open and close prices, as such I have made no attempt to account for green candles that gap lower and close below the close price of the preceding candle, or red candles that gap higher and close above the close price of the preceding candle. This may cause some unexpected behaviour on some markets and timeframes. I can only recommend using 24-hour markets, if and where possible, as there are far fewer gaps and, generally, more data to work with.
█ NOTES
A link to Scott's harmonic patterns webpage for anyone who may be interested: harmonictrader.com/harmonic-patterns/

Bullish Deep Crab Harmonic Patterns [theEccentricTrader]█ OVERVIEW
This indicator automatically draws bullish deep crab harmonic patterns and price projections derived from the ranges that constitute the patterns.
█ CONCEPTS
Green and Red Candles
• A green candle is one that closes with a close price equal to or above the price it opened.
• A red candle is one that closes with a close price that is lower than the price it opened.
Swing Highs and Swing Lows
• A swing high is a green candle or series of consecutive green candles followed by a single red candle to complete the swing and form the peak.
• A swing low is a red candle or series of consecutive red candles followed by a single green candle to complete the swing and form the trough.
Peak and Trough Prices (Basic)
• The peak price of a complete swing high is the high price of either the red candle that completes the swing high or the high price of the preceding green candle, depending on which is higher.
• The trough price of a complete swing low is the low price of either the green candle that completes the swing low or the low price of the preceding red candle, depending on which is lower.
Historic Peaks and Troughs
The current, or most recent, peak and trough occurrences are referred to as occurrence zero. Previous peak and trough occurrences are referred to as historic and ordered numerically from right to left, with the most recent historic peak and trough occurrences being occurrence one.
Range
The range is simply the difference between the current peak and current trough prices, generally expressed in terms of points or pips.
Support and Resistance
• Support refers to a price level where the demand for an asset is strong enough to prevent the price from falling further.
• Resistance refers to a price level where the supply of an asset is strong enough to prevent the price from rising further.
Support and resistance levels are important because they can help traders identify where the price of an asset might pause or reverse its direction, offering potential entry and exit points. For example, a trader might look to buy an asset when it approaches a support level , with the expectation that the price will bounce back up. Alternatively, a trader might look to sell an asset when it approaches a resistance level , with the expectation that the price will drop back down.
It's important to note that support and resistance levels are not always relevant, and the price of an asset can also break through these levels and continue moving in the same direction.
Upper Trends
• A return line uptrend is formed when the current peak price is higher than the preceding peak price.
• A downtrend is formed when the current peak price is lower than the preceding peak price.
• A double-top is formed when the current peak price is equal to the preceding peak price.
Lower Trends
• An uptrend is formed when the current trough price is higher than the preceding trough price.
• A return line downtrend is formed when the current trough price is lower than the preceding trough price.
• A double-bottom is formed when the current trough price is equal to the preceding trough price.
Wave Cycles
A wave cycle is here defined as a complete two-part move between a swing high and a swing low, or a swing low and a swing high. The first swing high or swing low will set the course for the sequence of wave cycles that follow; for example a chart that begins with a swing low will form its first complete wave cycle upon the formation of the first complete swing high and vice versa.
Figure 1.
Fibonacci Retracement and Extension Ratios
The Fibonacci sequence is a series of numbers in which each number is the sum of the two preceding numbers, starting with 0 and 1. For example 0 + 1 = 1, 1 + 1 = 2, 1 + 2 = 3, and so on. Ultimately, we could go on forever but the first few numbers in the sequence are as follows: 0 , 1, 1, 2, 3, 5, 8, 13, 21, 34, 55, 89, 144.
The extension ratios are calculated by dividing each number in the sequence by the number preceding it. For example 0/1 = 0, 1/1 = 1, 2/1 = 2, 3/2 = 1.5, 5/3 = 1.6666..., 8/5 = 1.6, 13/8 = 1.625, 21/13 = 1.6153..., 34/21 = 1.6190..., 55/34 = 1.6176..., 89/55 = 1.6181..., 144/89 = 1.6179..., and so on. The retracement ratios are calculated by inverting this process and dividing each number in the sequence by the number proceeding it. For example 0/1 = 0, 1/1 = 1, 1/2 = 0.5, 2/3 = 0.666..., 3/5 = 0.6, 5/8 = 0.625, 8/13 = 0.6153..., 13/21 = 0.6190..., 21/34 = 0.6176..., 34/55 = 0.6181..., 55/89 = 0.6179..., 89/144 = 0.6180..., and so on.
1.618 is considered to be the 'golden ratio', found in many natural phenomena such as the growth of seashells and the branching of trees. Some now speculate the universe oscillates at a frequency of 0,618 Hz, which could help to explain such phenomena, but this theory has yet to be proven.
Traders and analysts use Fibonacci retracement and extension indicators, consisting of horizontal lines representing different Fibonacci ratios, for identifying potential levels of support and resistance. Fibonacci ranges are typically drawn from left to right, with retracement levels representing ratios inside of the current range and extension levels representing ratios extended outside of the current range. If the current wave cycle ends on a swing low, the Fibonacci range is drawn from peak to trough. If the current wave cycle ends on a swing high the Fibonacci range is drawn from trough to peak.
Harmonic Patterns
The concept of harmonic patterns in trading was first introduced by H.M. Gartley in his book "Profits in the Stock Market", published in 1935. Gartley observed that markets have a tendency to move in repetitive patterns, and he identified several specific patterns that he believed could be used to predict future price movements.
Since then, many other traders and analysts have built upon Gartley's work and developed their own variations of harmonic patterns. One such contributor is Larry Pesavento, who developed his own methods for measuring harmonic patterns using Fibonacci ratios. Pesavento has written several books on the subject of harmonic patterns and Fibonacci ratios in trading. Another notable contributor to harmonic patterns is Scott Carney, who developed his own approach to harmonic trading in the late 1990s and also popularised the use of Fibonacci ratios to measure harmonic patterns. Carney expanded on Gartley's work and also introduced several new harmonic patterns, such as the Shark pattern and the 5-0 pattern.
The bullish and bearish Gartley patterns are the oldest recognized harmonic patterns in trading and all the other harmonic patterns are ultimately modifications of the original Gartley patterns. Gartley patterns are fundamentally composed of 5 points, or 4 waves.
Bullish and Bearish Deep Crab Patterns
• Bullish deep crab patterns are fundamentally composed of three troughs and two peaks. The second peak being lower than the first peak. And the third trough being lower than both the first and second troughs, while the second trough is higher than the first.
• Bearish deep crab patterns are fundamentally composed of three peaks and two troughs. The second trough being higher than the first trough. And the third peak being higher than both the first and second peaks, while the second peak is lower than the first.
The ratio measurements recommended by Scott Carney, who originated the pattern, are as follows:
• Wave 1 of the pattern, generally referred to as XA, has no specific ratio requirements.
• Wave 2 of the pattern, generally referred to as AB, should retrace to 88.6% of the range set by wave 1.
• Wave 3 of the pattern, generally referred to as BC, should retrace by at least 38.2%, but no further than 88.6% of the range set by wave 2.
• Wave 4 of the pattern, generally referred to as CD, should extend to at least 200%, but no further than 361.8% of the range set by wave 3.
• The last measure, generally referred to as AD, is that of wave 4 as a ratio of the range set by wave 1, which should extend to 161.8%.
Measurement Tolerances
In general, tolerance in measurements refers to the allowable variation or deviation from a specific value or dimension. It is the range within which a particular measurement is considered to be acceptable or accurate. In this script I have applied this concept to the measurement of harmonic pattern ratios to increase to the frequency of pattern occurrences.
For example, the AB measurement of Gartley patterns is generally set at around 61.8%, but with such specificity in the measuring requirements the patterns are very rare. We can increase the frequency of pattern occurrences by setting a tolerance. A tolerance of 10% to both downside and upside, which is the default setting for all tolerances, means we would have a tolerable measurement range between 51.8-71.8%, thus increasing the frequency of occurrence.
█ FEATURES
Inputs
• AB Lower Tolerance
• AB Upper Tolerance
• BC Lower Tolerance
• BC Upper Tolerance
• CD Lower Tolerance
• CD Upper Tolerance
• AD Lower Tolerance
• AD Upper Tolerance
• Pattern Color
• Label Color
• Show Projections
• Extend Current Projection Lines
Alerts
Users can set alerts for when the patterns occur.
█ LIMITATIONS
All green and red candle calculations are based on differences between open and close prices, as such I have made no attempt to account for green candles that gap lower and close below the close price of the preceding candle, or red candles that gap higher and close above the close price of the preceding candle. This may cause some unexpected behaviour on some markets and timeframes. I can only recommend using 24-hour markets, if and where possible, as there are far fewer gaps and, generally, more data to work with.
█ NOTES
A link to Scott's harmonic patterns webpage for anyone who may be interested: harmonictrader.com/harmonic-patterns/
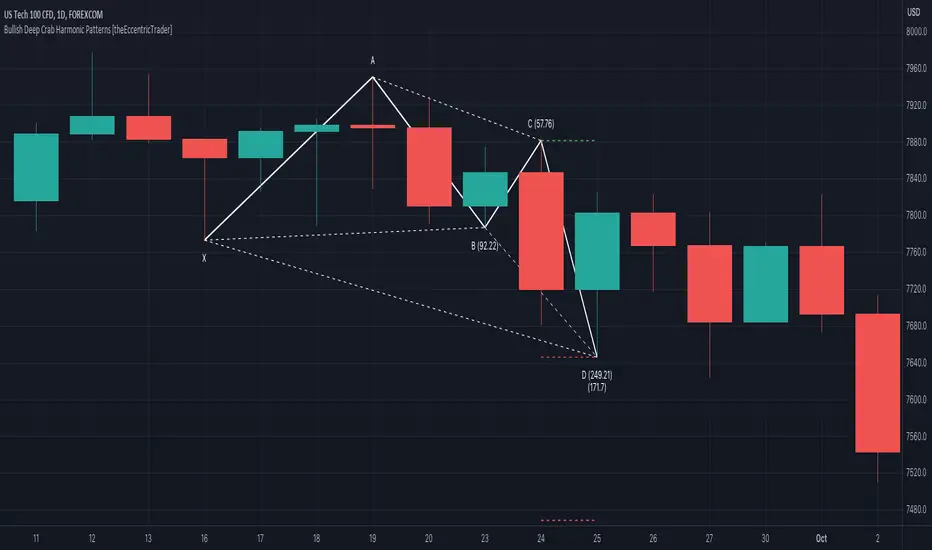
Bearish Alternate Bat Harmonic Patterns [theEccentricTrader]█ OVERVIEW
This indicator automatically draws bearish alternate bat harmonic patterns and price projections derived from the ranges that constitute the patterns.
█ CONCEPTS
Green and Red Candles
• A green candle is one that closes with a close price equal to or above the price it opened.
• A red candle is one that closes with a close price that is lower than the price it opened.
Swing Highs and Swing Lows
• A swing high is a green candle or series of consecutive green candles followed by a single red candle to complete the swing and form the peak.
• A swing low is a red candle or series of consecutive red candles followed by a single green candle to complete the swing and form the trough.
Peak and Trough Prices (Basic)
• The peak price of a complete swing high is the high price of either the red candle that completes the swing high or the high price of the preceding green candle, depending on which is higher.
• The trough price of a complete swing low is the low price of either the green candle that completes the swing low or the low price of the preceding red candle, depending on which is lower.
Historic Peaks and Troughs
The current, or most recent, peak and trough occurrences are referred to as occurrence zero. Previous peak and trough occurrences are referred to as historic and ordered numerically from right to left, with the most recent historic peak and trough occurrences being occurrence one.
Range
The range is simply the difference between the current peak and current trough prices, generally expressed in terms of points or pips.
Support and Resistance
• Support refers to a price level where the demand for an asset is strong enough to prevent the price from falling further.
• Resistance refers to a price level where the supply of an asset is strong enough to prevent the price from rising further.
Support and resistance levels are important because they can help traders identify where the price of an asset might pause or reverse its direction, offering potential entry and exit points. For example, a trader might look to buy an asset when it approaches a support level , with the expectation that the price will bounce back up. Alternatively, a trader might look to sell an asset when it approaches a resistance level , with the expectation that the price will drop back down.
It's important to note that support and resistance levels are not always relevant, and the price of an asset can also break through these levels and continue moving in the same direction.
Upper Trends
• A return line uptrend is formed when the current peak price is higher than the preceding peak price.
• A downtrend is formed when the current peak price is lower than the preceding peak price.
• A double-top is formed when the current peak price is equal to the preceding peak price.
Lower Trends
• An uptrend is formed when the current trough price is higher than the preceding trough price.
• A return line downtrend is formed when the current trough price is lower than the preceding trough price.
• A double-bottom is formed when the current trough price is equal to the preceding trough price.
Wave Cycles
A wave cycle is here defined as a complete two-part move between a swing high and a swing low, or a swing low and a swing high. The first swing high or swing low will set the course for the sequence of wave cycles that follow; for example a chart that begins with a swing low will form its first complete wave cycle upon the formation of the first complete swing high and vice versa.
Figure 1.
Fibonacci Retracement and Extension Ratios
The Fibonacci sequence is a series of numbers in which each number is the sum of the two preceding numbers, starting with 0 and 1. For example 0 + 1 = 1, 1 + 1 = 2, 1 + 2 = 3, and so on. Ultimately, we could go on forever but the first few numbers in the sequence are as follows: 0 , 1, 1, 2, 3, 5, 8, 13, 21, 34, 55, 89, 144.
The extension ratios are calculated by dividing each number in the sequence by the number preceding it. For example 0/1 = 0, 1/1 = 1, 2/1 = 2, 3/2 = 1.5, 5/3 = 1.6666..., 8/5 = 1.6, 13/8 = 1.625, 21/13 = 1.6153..., 34/21 = 1.6190..., 55/34 = 1.6176..., 89/55 = 1.6181..., 144/89 = 1.6179..., and so on. The retracement ratios are calculated by inverting this process and dividing each number in the sequence by the number proceeding it. For example 0/1 = 0, 1/1 = 1, 1/2 = 0.5, 2/3 = 0.666..., 3/5 = 0.6, 5/8 = 0.625, 8/13 = 0.6153..., 13/21 = 0.6190..., 21/34 = 0.6176..., 34/55 = 0.6181..., 55/89 = 0.6179..., 89/144 = 0.6180..., and so on.
1.618 is considered to be the 'golden ratio', found in many natural phenomena such as the growth of seashells and the branching of trees. Some now speculate the universe oscillates at a frequency of 0,618 Hz, which could help to explain such phenomena, but this theory has yet to be proven.
Traders and analysts use Fibonacci retracement and extension indicators, consisting of horizontal lines representing different Fibonacci ratios, for identifying potential levels of support and resistance. Fibonacci ranges are typically drawn from left to right, with retracement levels representing ratios inside of the current range and extension levels representing ratios extended outside of the current range. If the current wave cycle ends on a swing low, the Fibonacci range is drawn from peak to trough. If the current wave cycle ends on a swing high the Fibonacci range is drawn from trough to peak.
Harmonic Patterns
The concept of harmonic patterns in trading was first introduced by H.M. Gartley in his book "Profits in the Stock Market", published in 1935. Gartley observed that markets have a tendency to move in repetitive patterns, and he identified several specific patterns that he believed could be used to predict future price movements.
Since then, many other traders and analysts have built upon Gartley's work and developed their own variations of harmonic patterns. One such contributor is Larry Pesavento, who developed his own methods for measuring harmonic patterns using Fibonacci ratios. Pesavento has written several books on the subject of harmonic patterns and Fibonacci ratios in trading. Another notable contributor to harmonic patterns is Scott Carney, who developed his own approach to harmonic trading in the late 1990s and also popularised the use of Fibonacci ratios to measure harmonic patterns. Carney expanded on Gartley's work and also introduced several new harmonic patterns, such as the Shark pattern and the 5-0 pattern.
The bullish and bearish Gartley patterns are the oldest recognized harmonic patterns in trading and all the other harmonic patterns are ultimately modifications of the original Gartley patterns. Gartley patterns are fundamentally composed of 5 points, or 4 waves.
Bullish and Bearish Alternate Bat Patterns
• Bullish alternate bat patterns are fundamentally composed of three troughs and two peaks. The second peak being lower than the first peak and the second trough being higher than the first, with the third trough being lower than both the first and second troughs.
• Bearish alternate bat patterns are fundamentally composed of three peaks and two troughs. The second trough being higher than the first trough and the second peak being lower than the first, with the third peak being higher than both the first and second peaks.
The ratio measurements recommended by Scott Carney, who originated the pattern, are as follows:
• Wave 1 of the pattern, generally referred to as XA, has no specific ratio requirements.
• Wave 2 of the pattern, generally referred to as AB, should retrace to 38.2% of the range set by wave 1.
• Wave 3 of the pattern, generally referred to as BC, should retrace by at least 38.2%, but no further than 88.6% of the range set by wave 2.
• Wave 4 of the pattern, generally referred to as CD, should extend to at least 200%, but no further than 361.8% of the range set by wave 3.
• The last measure, generally referred to as AD, is that of wave 4 as a ratio of the range set by wave 1, which should extend to 113%.
Measurement Tolerances
In general, tolerance in measurements refers to the allowable variation or deviation from a specific value or dimension. It is the range within which a particular measurement is considered to be acceptable or accurate. In this script I have applied this concept to the measurement of harmonic pattern ratios to increase to the frequency of pattern occurrences.
For example, the AB measurement of Gartley patterns is generally set at around 61.8%, but with such specificity in the measuring requirements the patterns are very rare. We can increase the frequency of pattern occurrences by setting a tolerance. A tolerance of 10% to both downside and upside, which is the default setting for all tolerances, means we would have a tolerable measurement range between 51.8-71.8%, thus increasing the frequency of occurrence.
█ FEATURES
Inputs
• AB Lower Tolerance
• AB Upper Tolerance
• BC Lower Tolerance
• BC Upper Tolerance
• CD Lower Tolerance
• CD Upper Tolerance
• AD Lower Tolerance
• AD Upper Tolerance
• Pattern Color
• Label Color
• Show Projections
• Extend Current Projection Lines
Alerts
Users can set alerts for when the patterns occur.
█ LIMITATIONS
All green and red candle calculations are based on differences between open and close prices, as such I have made no attempt to account for green candles that gap lower and close below the close price of the preceding candle, or red candles that gap higher and close above the close price of the preceding candle. This may cause some unexpected behaviour on some markets and timeframes. I can only recommend using 24-hour markets, if and where possible, as there are far fewer gaps and, generally, more data to work with.
█ NOTES
A link to Scott's harmonic patterns webpage for anyone who may be interested: harmonictrader.com/harmonic-patterns/
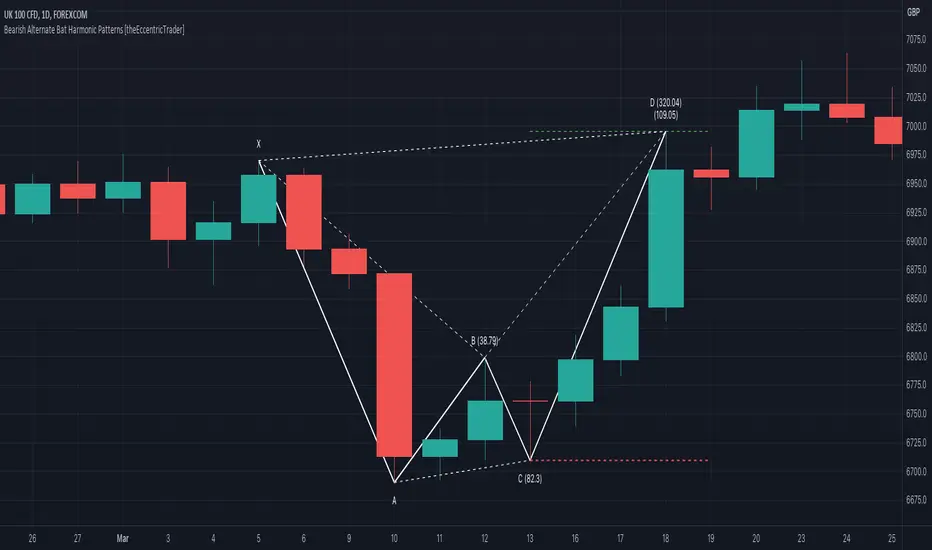
Bullish Alternate Bat Harmonic Patterns [theEccentricTrader]█ OVERVIEW
This indicator automatically draws bullish alternate bat harmonic patterns and price projections derived from the ranges that constitute the patterns.
█ CONCEPTS
Green and Red Candles
• A green candle is one that closes with a close price equal to or above the price it opened.
• A red candle is one that closes with a close price that is lower than the price it opened.
Swing Highs and Swing Lows
• A swing high is a green candle or series of consecutive green candles followed by a single red candle to complete the swing and form the peak.
• A swing low is a red candle or series of consecutive red candles followed by a single green candle to complete the swing and form the trough.
Peak and Trough Prices (Basic)
• The peak price of a complete swing high is the high price of either the red candle that completes the swing high or the high price of the preceding green candle, depending on which is higher.
• The trough price of a complete swing low is the low price of either the green candle that completes the swing low or the low price of the preceding red candle, depending on which is lower.
Historic Peaks and Troughs
The current, or most recent, peak and trough occurrences are referred to as occurrence zero. Previous peak and trough occurrences are referred to as historic and ordered numerically from right to left, with the most recent historic peak and trough occurrences being occurrence one.
Range
The range is simply the difference between the current peak and current trough prices, generally expressed in terms of points or pips.
Support and Resistance
• Support refers to a price level where the demand for an asset is strong enough to prevent the price from falling further.
• Resistance refers to a price level where the supply of an asset is strong enough to prevent the price from rising further.
Support and resistance levels are important because they can help traders identify where the price of an asset might pause or reverse its direction, offering potential entry and exit points. For example, a trader might look to buy an asset when it approaches a support level , with the expectation that the price will bounce back up. Alternatively, a trader might look to sell an asset when it approaches a resistance level , with the expectation that the price will drop back down.
It's important to note that support and resistance levels are not always relevant, and the price of an asset can also break through these levels and continue moving in the same direction.
Upper Trends
• A return line uptrend is formed when the current peak price is higher than the preceding peak price.
• A downtrend is formed when the current peak price is lower than the preceding peak price.
• A double-top is formed when the current peak price is equal to the preceding peak price.
Lower Trends
• An uptrend is formed when the current trough price is higher than the preceding trough price.
• A return line downtrend is formed when the current trough price is lower than the preceding trough price.
• A double-bottom is formed when the current trough price is equal to the preceding trough price.
Wave Cycles
A wave cycle is here defined as a complete two-part move between a swing high and a swing low, or a swing low and a swing high. The first swing high or swing low will set the course for the sequence of wave cycles that follow; for example a chart that begins with a swing low will form its first complete wave cycle upon the formation of the first complete swing high and vice versa.
Figure 1.
Fibonacci Retracement and Extension Ratios
The Fibonacci sequence is a series of numbers in which each number is the sum of the two preceding numbers, starting with 0 and 1. For example 0 + 1 = 1, 1 + 1 = 2, 1 + 2 = 3, and so on. Ultimately, we could go on forever but the first few numbers in the sequence are as follows: 0 , 1, 1, 2, 3, 5, 8, 13, 21, 34, 55, 89, 144.
The extension ratios are calculated by dividing each number in the sequence by the number preceding it. For example 0/1 = 0, 1/1 = 1, 2/1 = 2, 3/2 = 1.5, 5/3 = 1.6666..., 8/5 = 1.6, 13/8 = 1.625, 21/13 = 1.6153..., 34/21 = 1.6190..., 55/34 = 1.6176..., 89/55 = 1.6181..., 144/89 = 1.6179..., and so on. The retracement ratios are calculated by inverting this process and dividing each number in the sequence by the number proceeding it. For example 0/1 = 0, 1/1 = 1, 1/2 = 0.5, 2/3 = 0.666..., 3/5 = 0.6, 5/8 = 0.625, 8/13 = 0.6153..., 13/21 = 0.6190..., 21/34 = 0.6176..., 34/55 = 0.6181..., 55/89 = 0.6179..., 89/144 = 0.6180..., and so on.
1.618 is considered to be the 'golden ratio', found in many natural phenomena such as the growth of seashells and the branching of trees. Some now speculate the universe oscillates at a frequency of 0,618 Hz, which could help to explain such phenomena, but this theory has yet to be proven.
Traders and analysts use Fibonacci retracement and extension indicators, consisting of horizontal lines representing different Fibonacci ratios, for identifying potential levels of support and resistance. Fibonacci ranges are typically drawn from left to right, with retracement levels representing ratios inside of the current range and extension levels representing ratios extended outside of the current range. If the current wave cycle ends on a swing low, the Fibonacci range is drawn from peak to trough. If the current wave cycle ends on a swing high the Fibonacci range is drawn from trough to peak.
Harmonic Patterns
The concept of harmonic patterns in trading was first introduced by H.M. Gartley in his book "Profits in the Stock Market", published in 1935. Gartley observed that markets have a tendency to move in repetitive patterns, and he identified several specific patterns that he believed could be used to predict future price movements.
Since then, many other traders and analysts have built upon Gartley's work and developed their own variations of harmonic patterns. One such contributor is Larry Pesavento, who developed his own methods for measuring harmonic patterns using Fibonacci ratios. Pesavento has written several books on the subject of harmonic patterns and Fibonacci ratios in trading. Another notable contributor to harmonic patterns is Scott Carney, who developed his own approach to harmonic trading in the late 1990s and also popularised the use of Fibonacci ratios to measure harmonic patterns. Carney expanded on Gartley's work and also introduced several new harmonic patterns, such as the Shark pattern and the 5-0 pattern.
The bullish and bearish Gartley patterns are the oldest recognized harmonic patterns in trading and all the other harmonic patterns are ultimately modifications of the original Gartley patterns. Gartley patterns are fundamentally composed of 5 points, or 4 waves.
Bullish and Bearish Alternate Bat Patterns
• Bullish alternate bat patterns are fundamentally composed of three troughs and two peaks. The second peak being lower than the first peak and the second trough being higher than the first, with the third trough being lower than both the first and second troughs.
• Bearish alternate bat patterns are fundamentally composed of three peaks and two troughs. The second trough being higher than the first trough and the second peak being lower than the first, with the third peak being higher than both the first and second peaks.
The ratio measurements recommended by Scott Carney, who originated the pattern, are as follows:
• Wave 1 of the pattern, generally referred to as XA, has no specific ratio requirements.
• Wave 2 of the pattern, generally referred to as AB, should retrace to 38.2% of the range set by wave 1.
• Wave 3 of the pattern, generally referred to as BC, should retrace by at least 38.2%, but no further than 88.6% of the range set by wave 2.
• Wave 4 of the pattern, generally referred to as CD, should extend to at least 200%, but no further than 361.8% of the range set by wave 3.
• The last measure, generally referred to as AD, is that of wave 4 as a ratio of the range set by wave 1, which should extend to 113%.
Measurement Tolerances
In general, tolerance in measurements refers to the allowable variation or deviation from a specific value or dimension. It is the range within which a particular measurement is considered to be acceptable or accurate. In this script I have applied this concept to the measurement of harmonic pattern ratios to increase to the frequency of pattern occurrences.
For example, the AB measurement of Gartley patterns is generally set at around 61.8%, but with such specificity in the measuring requirements the patterns are very rare. We can increase the frequency of pattern occurrences by setting a tolerance. A tolerance of 10% to both downside and upside, which is the default setting for all tolerances, means we would have a tolerable measurement range between 51.8-71.8%, thus increasing the frequency of occurrence.
█ FEATURES
Inputs
• AB Lower Tolerance
• AB Upper Tolerance
• BC Lower Tolerance
• BC Upper Tolerance
• CD Lower Tolerance
• CD Upper Tolerance
• AD Lower Tolerance
• AD Upper Tolerance
• Pattern Color
• Label Color
• Show Projections
• Extend Current Projection Lines
Alerts
Users can set alerts for when the patterns occur.
█ LIMITATIONS
All green and red candle calculations are based on differences between open and close prices, as such I have made no attempt to account for green candles that gap lower and close below the close price of the preceding candle, or red candles that gap higher and close above the close price of the preceding candle. This may cause some unexpected behaviour on some markets and timeframes. I can only recommend using 24-hour markets, if and where possible, as there are far fewer gaps and, generally, more data to work with.
█ NOTES
A link to Scott's harmonic patterns webpage for anyone who may be interested: harmonictrader.com/harmonic-patterns/
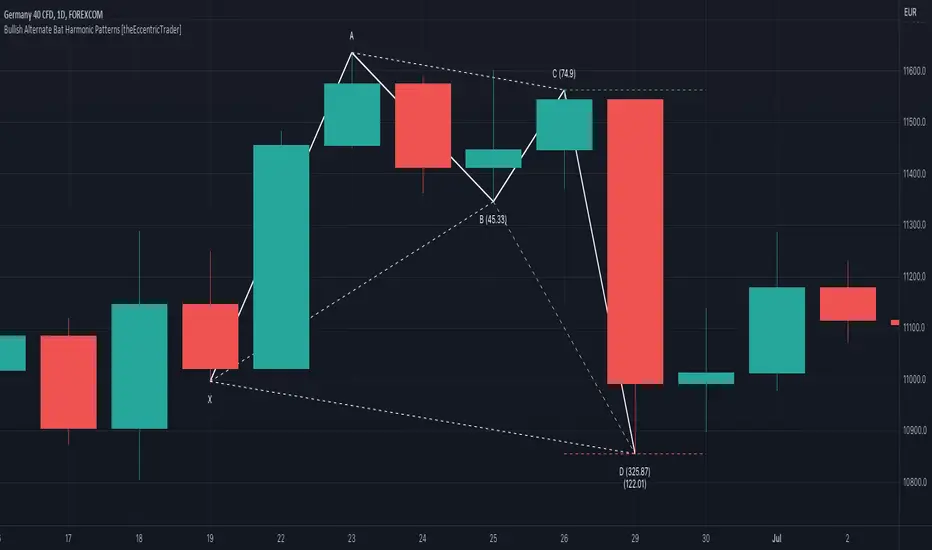
ABC 123 Harmonic Ratio Custom Range Interactive█ OVERVIEW
This indicator was designed based on Harmonic Trading : Volume One written by Scott Carney.
This is about harmonic ratios which expanded through retracement and projection.
Derivation is pretty much explained here such as Primary, Primary Derivation, Secondary Derivation and Secondary Derivation Extreme.
Derivation value depends on minimum retracement or maximum projection.
This derivation value utilize Fibonacci value which later expand to Harmonic Ratio.
█ INSPIRATION
Inspired by design, code and usage of CAGR . Basic usage of custom range / interactive, pretty much explained here . Credits to TradingView.
This build is based and visualized upon Harmonic Trading Ratios.
This build also was stripped down from XABCD Harmonic Pattern Custom Range Interactive .
█ CREDITS
Scott Carney, Harmonic Trading : Volume One (Page 18)
█ FEATURES
Table can positioned by any position and font size can be resized.
Labels can be either changed to alphabets or numbers.
█ HOW TO USE
Draw points from Point A to Point C.
Dont worry about magnet, point will attached depends on High or Low of the candle.
█ USAGE / TIPS EXAMPLES (Description explained in each image)
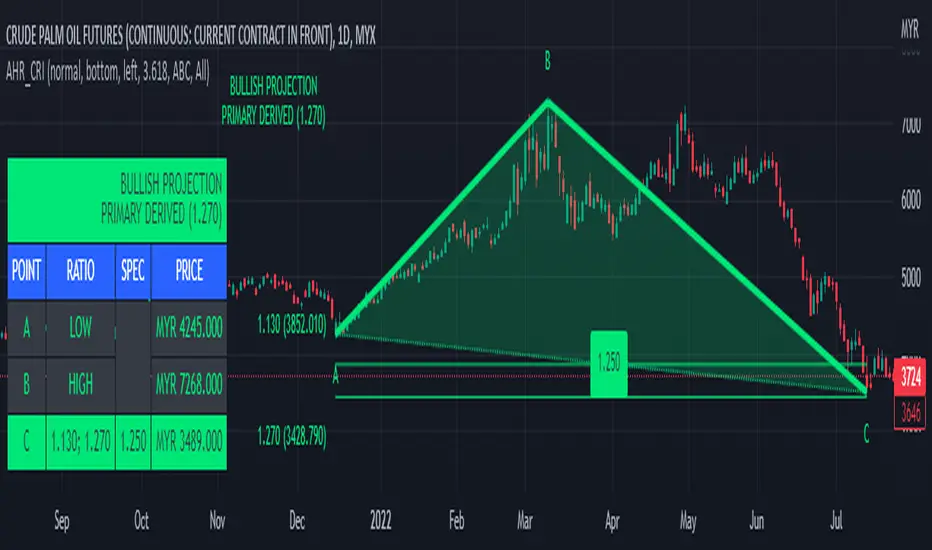
Bat Harmonic Pattern [TradingFinder] Bat Chart Indicator🔵 Introduction
The Bat Harmonic Pattern, created by Scott Carney in the 1990s, is a sophisticated tool in technical analysis, used to identify potential reversal points in price movements by leveraging Fibonacci ratios.
This pattern is classified into two primary types: the Bullish Bat Pattern, which signals the end of a downtrend and the beginning of an uptrend, and the Bearish Bat Pattern, which indicates the conclusion of an uptrend and the onset of a downtrend.
🟣 Bullish Bat Pattern
The Bullish Bat Pattern is designed to identify when a downtrend is likely to end and a new uptrend is about to begin. The key feature of this pattern is Point D, which typically aligns near the 88.6% Fibonacci retracement of the XA leg.
This point is considered a strong buy zone. When the price reaches Point D after a significant downtrend, it often indicates a potential reversal, presenting a buying opportunity for traders anticipating the start of an upward movement.
🟣 Bearish Bat Pattern
In contrast, the Bearish Bat Pattern forms when an uptrend is nearing its conclusion. Point D, which also typically aligns near the 88.6% Fibonacci retracement of the XA leg, serves as a critical point for traders.
This point is regarded as a strong sell zone, signaling that the uptrend may be ending, and a downtrend could be imminent. Traders often open short positions when they identify this pattern, aiming to capitalize on the anticipated downward movement.
🔵 How to Use
The Bat Pattern consists of five key points: X, A, B, C, and D, and four waves: XA, AB, BC, and CD. Fibonacci ratios play a crucial role in this pattern, helping traders pinpoint precise entry and exit points. In both the Bullish and Bearish Bat Patterns, the 88.6% retracement of the XA leg is a critical level for identifying potential reversal points.
🟣 Bullish Bat Pattern
Traders typically enter buy positions after Point D forms, expecting the downtrend to end and a new uptrend to start. This point, located near the 88.6% retracement of the XA leg, serves as a reliable buy signal.
🟣 Bearish Bat Pattern
Traders usually open short positions after identifying Point D, expecting the uptrend to end and a downtrend to begin. This point, also near the 88.6% retracement of the XA leg, acts as a valid sell signal.
🟣 Trading Tips for the Bat Pattern
Accurate Fibonacci Point Identification : Accurately identify Points X, A, B, C, and D, and calculate the Fibonacci ratios between these points. Point D should ideally be near the 88.6% retracement of the XA leg.
Signal Confirmation with Other Tools : To enhance the pattern's accuracy, avoid trading solely based on the Bat Pattern.
Risk Management : Always use stop-loss orders. In a Bullish Bat Pattern, place the stop-loss below Point X, and in a Bearish Bat Pattern, above Point X. This helps limit potential losses if the pattern fails.
Wait for Price Movement Confirmation : After identifying Point D, wait for the price to move in the anticipated direction to confirm the pattern's validity before entering a trade.
Set Realistic Profit Targets : Use Fibonacci retracement levels to set realistic profit targets, such as 38.2%, 50%, and 61.8% retracement levels of the CD leg. This strategy helps maximize profits and prevents premature exits.
🔵 Setting
🟣 Logical Setting
ZigZag Pivot Period : You can adjust the period so that the harmonic patterns are adjusted according to the pivot period you want. This factor is the most important parameter in pattern recognition.
Show Valid Forma t: If this parameter is on "On" mode, only patterns will be displayed that they have exact format and no noise can be seen in them. If "Off" is, the patterns displayed that maybe are noisy and do not exactly correspond to the original pattern.
Show Formation Last Pivot Confirm : if Turned on, you can see this ability of patterns when their last pivot is formed. If this feature is off, it will see the patterns as soon as they are formed. The advantage of this option being clear is less formation of fielded patterns, and it is accompanied by the latest pattern seeing and a sharp reduction in reward to risk.
Period of Formation Last Pivot : Using this parameter you can determine that the last pivot is based on Pivot period.
🟣 Genaral Setting
Show : Enter "On" to display the template and "Off" to not display the template.
Color : Enter the desired color to draw the pattern in this parameter.
LineWidth : You can enter the number 1 or numbers higher than one to adjust the thickness of the drawing lines. This number must be an integer and increases with increasing thickness.
LabelSize : You can adjust the size of the labels by using the "size.auto", "size.tiny", "size.smal", "size.normal", "size.large" or "size.huge" entries.
🟣 Alert Setting
Alert : On / Off
Message Frequency : This string parameter defines the announcement frequency. Choices include: "All" (activates the alert every time the function is called), "Once Per Bar" (activates the alert only on the first call within the bar), and "Once Per Bar Close" (the alert is activated only by a call at the last script execution of the real-time bar upon closing). The default setting is "Once per Bar".
Show Alert Time by Time Zone : The date, hour, and minute you receive in alert messages can be based on any time zone you choose. For example, if you want New York time, you should enter "UTC-4". This input is set to the time zone "UTC" by default.
🔵 Conclusion
The Bat Harmonic Pattern is a powerful tool in technical analysis, offering traders the ability to identify critical reversal points using Fibonacci ratios. By recognizing the Bullish and Bearish Bat Patterns, traders can anticipate potential trend reversals and make informed trading decisions.
However, it is essential to combine the Bat Pattern with other technical analysis tools and confirm signals for better trading outcomes. With proper use, this pattern can help traders minimize risk and optimize their entry and exit points in the market.

Alternative Shark Harmonic Pattern [TradingFinder] ALT Shark🔵 Introduction
The Alternative Shark harmonic pattern, similar to the original Shark harmonic pattern introduced by Scott Carney, is a powerful tool in technical analysis used to identify potential reversal zones (PRZ) in financial markets.
These harmonic patterns help traders spot key turning points in market trends by relying on specific Fibonacci ratios. The Alternative Shark pattern is particularly unique due to its distinct Fibonacci retracements within the PRZ, which differentiate it from the standard Shark pattern and provide traders with more precise entry and exit signals.
By focusing on harmonic patterns and utilizing tools like the Harmonic Pattern Indicator, traders can easily identify both the Shark and Alternative Shark patterns, making it easier to find PRZs and capture potential trend reversals. This enhanced detection of potential reversal zones allows for better trade optimization and improved risk management.
Incorporating the Alternative Shark pattern into your technical analysis strategy enables you to enhance your trading performance by identifying market reversals with greater accuracy, improving the timing of your trades, and reducing risks associated with sudden market shifts.
🟣 Understanding the Types of Alternative Shark Pattern
The Alternative Shark harmonic pattern, much like the original Shark pattern, forms at the end of price trends and is divided into two types: Bullish and Bearish Alternative Shark patterns.
Bullish Alternative Shark Pattern :
This pattern typically forms at the end of a downtrend, signaling a potential reversal into an uptrend. Traders can use this pattern to identify buy entry points. The image below illustrates the core components of the Bullish Alternative Shark Pattern.
Bearish Alternative Shark Pattern :
Conversely, the Bearish Alternative Shark Pattern appears at the end of an uptrend and signals a potential reversal to a downtrend. This variation allows traders to adjust their strategies for selling. The image below outlines the characteristics of the Bearish Alternative Shark Pattern.
🟣 Differences Between Shark and Alternative Shark Patterns
Although both patterns share similar structures and serve as tools for identifying price reversals, there is one key difference between them :
AB to XA Ratio : In the Shark pattern, the AB leg retraces between 1 and 2 of the XA leg, whereas in the Alternative Shark pattern, this retracement is reduced to 0.382 to 0.618 of the XA leg. This difference in the retracement ratio leads to slightly different trade signals and can affect the timing of entry and exit points.
Other ratios and reversal signals remain consistent between the two patterns, but this difference in the AB to XA ratio provides traders with more nuanced opportunities to optimize their trades.
🔵 How to Use
🟣 Trading with the Bullish Alternative Shark Pattern
The Bullish Alternative Shark Pattern functions similarly to the traditional Bullish Shark, acting as a reversal pattern that helps traders recognize the end of a downtrend and the beginning of an uptrend.
The main distinction lies in the reduced AB retracement, which can offer more refined entry signals. Once the pattern completes, traders can look to enter buy trades and place a stop-loss below the lowest point of the pattern for effective risk management.
🟣 Trading with the Bearish Alternative Shark Pattern
The Bearish Alternative Shark Pattern operates much like the Bearish Shark pattern but with the adjusted AB to XA ratio. This difference provides traders with unique entry points for sell trades. Once the pattern is fully identified, traders can enter short positions, placing a stop-loss above the highest point of the pattern to safeguard against market fluctuations.
🔵 Setting
🟣 Logical Setting
ZigZag Pivot Period : You can adjust the period so that the harmonic patterns are adjusted according to the pivot period you want. This factor is the most important parameter in pattern recognition.
Show Valid Forma t: If this parameter is on "On" mode, only patterns will be displayed that they have exact format and no noise can be seen in them. If "Off" is, the patterns displayed that maybe are noisy and do not exactly correspond to the original pattern.
Show Formation Last Pivot Confirm : if Turned on, you can see this ability of patterns when their last pivot is formed. If this feature is off, it will see the patterns as soon as they are formed. The advantage of this option being clear is less formation of fielded patterns, and it is accompanied by the latest pattern seeing and a sharp reduction in reward to risk.
Period of Formation Last Pivot : Using this parameter you can determine that the last pivot is based on Pivot period.
🟣 Genaral Setting
Show : Enter "On" to display the template and "Off" to not display the template.
Color : Enter the desired color to draw the pattern in this parameter.
LineWidth : You can enter the number 1 or numbers higher than one to adjust the thickness of the drawing lines. This number must be an integer and increases with increasing thickness.
LabelSize : You can adjust the size of the labels by using the "size.auto", "size.tiny", "size.smal", "size.normal", "size.large" or "size.huge" entries.
🟣 Alert Setting
Alert : On / Off
Message Frequency : This string parameter defines the announcement frequency. Choices include: "All" (activates the alert every time the function is called), "Once Per Bar" (activates the alert only on the first call within the bar), and "Once Per Bar Close" (the alert is activated only by a call at the last script execution of the real-time bar upon closing). The default setting is "Once per Bar".
Show Alert Time by Time Zone : The date, hour, and minute you receive in alert messages can be based on any time zone you choose. For example, if you want New York time, you should enter "UTC-4". This input is set to the time zone "UTC" by default.
🔵 Conclusion
The Alternative Shark harmonic pattern, despite its structural similarity to the traditional Shark pattern, introduces a key difference in the AB to XA ratio, making it a valuable addition to the trader’s toolkit. This subtle variation enables traders to pinpoint reversal points with greater accuracy and fine-tune their trading strategies.
As with any technical pattern, it is crucial to use the Alternative Shark pattern in combination with other technical indicators and strong risk management practices. Incorporating this pattern into a broader trading strategy can help traders enhance their ability to detect and capitalize on market reversals more effectively.

All Harmonic Patterns [theEccentricTrader]█ OVERVIEW
This indicator automatically draws and sends alerts for all of the harmonic patterns in my public library as they occur. The patterns included are as follows:
• Bearish 5-0
• Bullish 5-0
• Bearish ABCD
• Bullish ABCD
• Bearish Alternate Bat
• Bullish Alternate Bat
• Bearish Bat
• Bullish Bat
• Bearish Butterfly
• Bullish Butterfly
• Bearish Cassiopeia A
• Bullish Cassiopeia A
• Bearish Cassiopeia B
• Bullish Cassiopeia B
• Bearish Cassiopeia C
• Bullish Cassiopeia C
• Bearish Crab
• Bullish Crab
• Bearish Deep Crab
• Bullish Deep Crab
• Bearish Cypher
• Bullish Cypher
• Bearish Gartley
• Bullish Gartley
• Bearish Shark
• Bullish Shark
• Bearish Three-Drive
• Bullish Three-Drive
█ CONCEPTS
Green and Red Candles
• A green candle is one that closes with a close price equal to or above the price it opened.
• A red candle is one that closes with a close price that is lower than the price it opened.
Swing Highs and Swing Lows
• A swing high is a green candle or series of consecutive green candles followed by a single red candle to complete the swing and form the peak.
• A swing low is a red candle or series of consecutive red candles followed by a single green candle to complete the swing and form the trough.
Peak and Trough Prices
• The peak price of a complete swing high is the high price of either the red candle that completes the swing high or the high price of the preceding green candle, depending on which is higher.
• The trough price of a complete swing low is the low price of either the green candle that completes the swing low or the low price of the preceding red candle, depending on which is lower.
Historic Peaks and Troughs
The current, or most recent, peak and trough occurrences are referred to as occurrence zero. Previous peak and trough occurrences are referred to as historic and ordered numerically from right to left, with the most recent historic peak and trough occurrences being occurrence one.
Upper Trends
• A return line uptrend is formed when the current peak price is higher than the preceding peak price.
• A downtrend is formed when the current peak price is lower than the preceding peak price.
• A double-top is formed when the current peak price is equal to the preceding peak price.
Lower Trends
• An uptrend is formed when the current trough price is higher than the preceding trough price.
• A return line downtrend is formed when the current trough price is lower than the preceding trough price.
• A double-bottom is formed when the current trough price is equal to the preceding trough price.
Range
The range is simply the difference between the current peak and current trough prices, generally expressed in terms of points or pips.
Wave Cycles
A wave cycle is here defined as a complete two-part move between a swing high and a swing low, or a swing low and a swing high. The first swing high or swing low will set the course for the sequence of wave cycles that follow; for example a chart that begins with a swing low will form its first complete wave cycle upon the formation of the first complete swing high and vice versa.
Figure 1.
Retracement and Extension Ratios
Retracement and extension ratios are calculated by dividing the current range by the preceding range and multiplying the answer by 100. Retracement ratios are those that are equal to or below 100% of the preceding range and extension ratios are those that are above 100% of the preceding range.
Fibonacci Retracement and Extension Ratios
The Fibonacci sequence is a series of numbers in which each number is the sum of the two preceding numbers, starting with 0 and 1. For example 0 + 1 = 1, 1 + 1 = 2, 1 + 2 = 3, and so on. Ultimately, we could go on forever but the first few numbers in the sequence are as follows: 0 , 1, 1, 2, 3, 5, 8, 13, 21, 34, 55, 89, 144.
The extension ratios are calculated by dividing each number in the sequence by the number preceding it. For example 0/1 = 0, 1/1 = 1, 2/1 = 2, 3/2 = 1.5, 5/3 = 1.6666..., 8/5 = 1.6, 13/8 = 1.625, 21/13 = 1.6153..., 34/21 = 1.6190..., 55/34 = 1.6176..., 89/55 = 1.6181..., 144/89 = 1.6179..., and so on. The retracement ratios are calculated by inverting this process and dividing each number in the sequence by the number proceeding it. For example 0/1 = 0, 1/1 = 1, 1/2 = 0.5, 2/3 = 0.666..., 3/5 = 0.6, 5/8 = 0.625, 8/13 = 0.6153..., 13/21 = 0.6190..., 21/34 = 0.6176..., 34/55 = 0.6181..., 55/89 = 0.6179..., 89/144 = 0.6180..., and so on.
Fibonacci ranges are typically drawn from left to right, with retracement levels representing ratios inside of the current range and extension levels representing ratios extended outside of the current range. If the current wave cycle ends on a swing low, the Fibonacci range is drawn from peak to trough. If the current wave cycle ends on a swing high the Fibonacci range is drawn from trough to peak.
Measurement Tolerances
Tolerance refers to the allowable variation or deviation from a specific value or dimension. It is the range within which a particular measurement is considered to be acceptable or accurate. I have applied this concept in my pattern detection logic and have set default tolerances where applicable, as perfect patterns are, needless to say, very rare.
Chart Patterns
Generally speaking price charts are nothing more than a series of swing highs and swing lows. When demand outweighs supply over a period of time prices swing higher and when supply outweighs demand over a period of time prices swing lower. These swing highs and swing lows can form patterns that offer insight into the prevailing supply and demand dynamics at play at the relevant moment in time.
‘Let us assume… that you the reader, are not a member of that mysterious inner circle known to the boardrooms as “the insiders”… But it is fairly certain that there are not nearly so many “insiders” as amateur trader supposes and… It is even more certain that insiders can be wrong… Any success they have, however, can be accomplished only by buying and selling… hey can do neither without altering the delicate poise of supply and demand that governs prices. Whatever they do is sooner or later reflected on the charts where you… can detect it. Or detect, at least, the way in which the supply-demand equation is being affected… So, you do not need to be an insider to ride with them frequently… prices move in trends. Some of those trends are straight, some are curved; some are brief and some are long and continued… produced in a series of action and reaction waves of great uniformity. Sooner or later, these trends change direction; they may reverse (as from up to down), or they may be interrupted by some sort of sideways movement and then, after a time, proceed again in their former direction… when a price trend is in the process of reversal… a characteristic area or pattern takes shape on the chart, which becomes recognisable as a reversal formation… Needless to say, the first and most important task of the technical chart analyst is to learn to know the important reversal formations and to judge what they may signify in terms of trading opportunities’ (Edwards & Magee, 1948).
This is as true today as it was when Edwards and Magee were writing in the first half of the last Century, study your patterns and make judgements for yourself about what their implications truly are on the markets and timeframes you are interested in trading.
Over the years, traders have come to discover a multitude of chart and candlestick patterns that are supposed to pertain information on future price movements. However, it is never so clear cut in practice and patterns that where once considered to be reversal patterns are now considered to be continuation patterns and vice versa. Bullish patterns can have bearish implications and bearish patterns can have bullish implications. As such, I would highly encourage you to do your own backtesting.
There is no denying that chart patterns exist, but their implications will vary from market to market and timeframe to timeframe. So it is down to you as an individual to study them and make decisions about how they may be used in a strategic sense.
Harmonic Patterns
The concept of harmonic patterns in trading was first introduced by H.M. Gartley in his book "Profits in the Stock Market", published in 1935. Gartley observed that markets have a tendency to move in repetitive patterns, and he identified several specific patterns that he believed could be used to predict future price movements. The bullish and bearish Gartley patterns are the oldest recognized harmonic patterns in trading and all the other harmonic patterns are modifications of the original Gartley patterns. Gartley patterns are fundamentally composed of 5 points, or 4 waves.
Since then, many other traders and analysts have built upon Gartley's work and developed their own variations of harmonic patterns. One such contributor is Larry Pesavento, who developed his own methods for measuring harmonic patterns using Fibonacci ratios. Pesavento has written several books on the subject of harmonic patterns and Fibonacci ratios in trading. Another notable contributor to harmonic patterns is Scott Carney, who developed his own approach to harmonic trading in the late 1990s and also popularised the use of Fibonacci ratios to measure harmonic patterns. Carney expanded on Gartley's work and also introduced several new harmonic patterns, such as the Shark pattern and the 5-0 pattern.
█ INPUTS
• Change pattern and label colours
• Show or hide patterns individually
• Adjust pattern tolerances
• Set or remove alerts for individual patterns
█ NOTES
You can test the patterns with your own strategies manually by applying the indicator to your chart while in bar replay mode and playing through the history. You could also automate this process with PineScript by using the conditions from my swing and pattern libraries as entry conditions in the strategy tester or your own custom made strategy screener.
█ LIMITATIONS
All green and red candle calculations are based on differences between open and close prices, as such I have made no attempt to account for green candles that gap lower and close below the close price of the preceding candle, or red candles that gap higher and close above the close price of the preceding candle. This may cause some unexpected behaviour on some markets and timeframes. I can only recommend using 24-hour markets, if and where possible, as there are far fewer gaps and, generally, more data to work with.
█ SOURCES
Edwards, R., & Magee, J. (1948) Technical Analysis of Stock Trends (10th edn). Reprint, Boca Raton, Florida: Taylor and Francis Group, CRC Press: 2013.
