Harmonic Pattern Table (Source Code)This table indicator was intended as helper / reference for using XABCD Pattern.
Indikator berjadual bertujuan sebagai bantuan / rujukan untuk kegunaan XABCD Pattern.
The values shown in table was based on Harmonic Trading Volume 3: Reaction vs. Reversal written by Scott M Carney.
Nilai yang ditunjukkan dalam jadual adalah berdasarkan buku Harmonic Trading Volume 3: Reaction vs. Reversal ditulis oleh Scott M Carney.
Indicator features :
1. List Harmonic Patterns.
2. Font size small for mobile app and font size normal for desktop.
Kemampuan indikator :
1. Senarai Harmonic Pattern.
2. Saiz font kecil untuk mobile app dan saiz size normal untuk desktop.
FAQ
1. Credits / Kredit
Scott M Carney,
Scott M Carney, Trading Volume 3: Reaction vs. Reversal
2. Code Usage / Penggunaan Kod
Free to use for personal usage but credits are most welcomed especially for credits to Scott M Carney.
Bebas untuk kegunaan peribadi tetapi kredit adalah amat dialu-alukan terutamanya kredit kepada Scott M Carney.
Default Settings.
Setting asal.
Setting for selected Harmonic Pattern (Example : Bat)
Setting untuk pilihan Harmonic Pattern (Contoh : Bat)
Setting for show Harmonic Pattern only (Example : Bat)
Setting untuk nama Harmonic Pattern sahaja(Contoh : Bat)
Search in scripts for "harmonic"

[RS]Fractal Pattern Recognition V0EXPERIMENTAL: reads the rates for the last top/bottom in a zigzag fractal series, outputs XAB, XAD, ABC, and BCD rates, im interested in earing what your opinion is as im a total noob in harmonics :p.
use with Fractals V5 for visual confirmation ;).

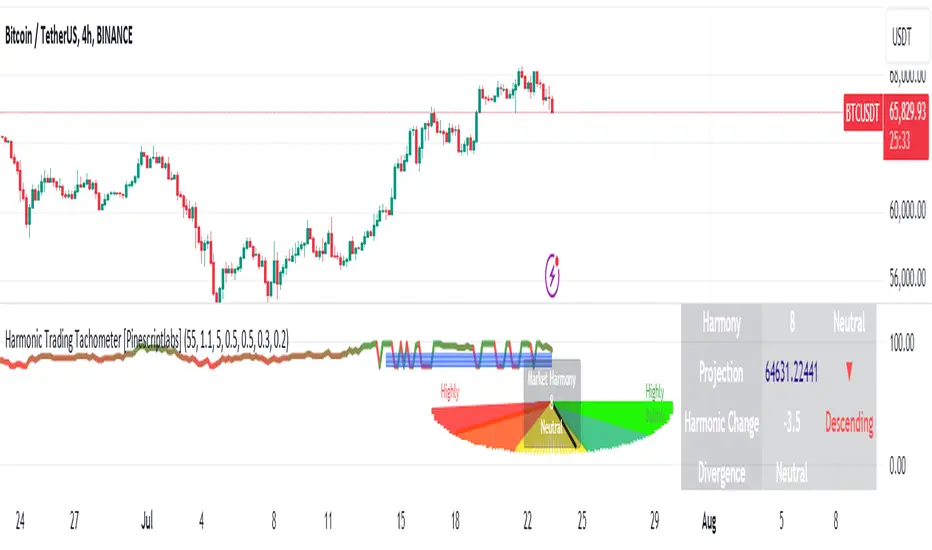
Harmonic Trading Tachometer [Pinescriptlabs]Key Features:
Visual Tachometer:
Represents market harmony through a speedometer on the chart.
The tachometer displays a range of harmony from "Highly Bearish" to "Highly Bullish."
Harmony Calculation:
Harmony Score: Based on ATR (Average True Range) range calculations for short, medium, and long periods. The harmony score is a weighted combination of these scores.
Interpretation: Harmony is translated into an interpretive category that can be "Highly Bearish," "Bearish," "Neutral," "Bullish," or "Highly Bullish."
Price Projection:
Estimates future price movement considering the current trend and the weight of each trend period (short, medium, and long).
Harmonic Change Detection:
Identifies significant changes in market harmony and adjusts sensitivity with predefined thresholds.
Confirmation and Divergence Signals:
Detects bullish or bearish confirmation signals as well as divergences, based on market harmony and price projection.
Additional Visualization:
Includes an optional market pentagram chart to visualize harmony on a broader scale.
Provides detailed information in a table about harmony, price projection, and harmonic changes.
How the Script Works:
Initial Calculations:
Ranges and Scores: Calculates ATR ranges for different periods (short, medium, and long). Then, evaluates the harmony score using the given formula.
Harmony: Obtained through the weighted combination of short, medium, and long-term scores.
Price Projection:
The projection is adjusted based on the difference between the current closing price and the exponential moving averages (EMAs) for different periods, weighted by the defined factors.
How to Use :
Tachometer Interpretation:
Observe the needle's position on the tachometer to assess the current market harmony.
Use the colors and labels to quickly interpret the market's state.
Projection and Changes:
Use the price projection to identify potential support or resistance levels.
Monitor harmonic changes and their strengths to adjust your trading strategies.
Confirmations and Divergences:
Pay attention to confirmation and divergence signals to decide on potential entries or exits.
Customization:
Adjust the indicator parameters, such as base length, harmony factor, change detection period, and trend weights, to fit your trading style and timeframe.
Español:
**Tacómetro Visual:
- Representa la armonía del mercado mediante un velocímetro en el gráfico.
- El tacómetro muestra un rango de armonía desde "Altamente Bajista" hasta "Altamente Alcista."
Cálculo de Armonía:
- Puntuación de Armonía:** Basada en los cálculos del rango ATR (Average True Range) para períodos cortos, medios y largos. La puntuación de armonía es una combinación ponderada de estas puntuaciones.
- Interpretación: La armonía se traduce en una categoría interpretativa que puede ser "Altamente Bajista," "Bajista," "Neutral," "Alcista," o "Altamente Alcista."
**Proyección de Precios:
- Estima el movimiento futuro de los precios considerando la tendencia actual y el peso de cada período de tendencia (corto, medio y largo).
**Detección de Cambios Armonicos:
- Identifica cambios significativos en la armonía del mercado y ajusta la sensibilidad con umbrales predefinidos.
**Señales de Confirmación y Divergencia:
- Detecta señales de confirmación alcista o bajista, así como divergencias, basadas en la armonía del mercado y la proyección de precios.
**Visualización Adicional:**
- Incluye un gráfico opcional de un pentagrama de mercado para visualizar la armonía en una escala más amplia.
- Proporciona información detallada en una tabla sobre la armonía, la proyección de precios y los cambios armónicos.
**Cómo Funciona el Script:**
Cálculos Iniciales:
- **Rangos y Puntuaciones:** Calcula los rangos del ATR para diferentes períodos (corto, medio y largo). Luego, evalúa la puntuación de armonía utilizando la fórmula dada.
- **Armonía:** Se obtiene a través de la combinación ponderada de las puntuaciones de corto, medio y largo plazo.
**Proyección de Precios:**
- La proyección se ajusta según la diferencia entre el precio de cierre actual y las medias móviles exponenciales (EMA) para diferentes períodos, ponderadas por los factores definidos.
**Cómo Usar:**
**Interpretación del Tacómetro:**
- Observa la posición de la aguja en el tacómetro para evaluar la armonía actual del mercado.
- Usa los colores y las etiquetas para interpretar rápidamente el estado del mercado.
**Proyección y Cambios:**
- Usa la proyección de precios para identificar posibles niveles de soporte o resistencia.
- Monitorea los cambios armónicos y sus fortalezas para ajustar tus estrategias de trading.
**Confirmaciones y Divergencias:**
- Presta atención a las señales de confirmación y divergencia para decidir posibles entradas o salidas.
**Personalización:**
- Ajusta los parámetros del indicador, como la longitud base, el factor de armonía, el período de detección de cambios y los pesos de tendencia, para adaptarlo a tu estilo de trading y marco de tiempo.
Harmonic Trend Fusion [kikfraben]📈 Harmonic Trend Fusion - Your Personal Trading Assistant
This versatile tool combines multiple indicators to provide a holistic view of market trends and potential signals.
🚀 Key Features:
Multi-Indicator Synergy: Benefit from the combined insights of Aroon, DMI, MACD, Parabolic SAR, RSI, Supertrend, and SMI Ergodic Oscillator, all in one powerful indicator.
Customizable Plot Options: Tailor your chart by choosing which signals to visualize. Whether you're interested in trendlines, histograms, or specific indicators, the choice is yours.
Color-Coded Trends: Quickly identify bullish and bearish trends with the color-coded visualizations. Stay ahead of market movements with clear and intuitive signals.
Table Display: Stay informed at a glance with the interactive table. It dynamically updates to reflect the current market sentiment, providing you with key information and trend direction.
Precision Control: Fine-tune your analysis with precision control over indicator parameters. Adjust lengths, colors, and other settings to align with your unique trading strategy.
🛠️ How to Use:
Customize Your View: Select which indicators to display and adjust plot options to suit your preferences.
Table Insights: Monitor the dynamic table for real-time updates on market sentiment and trend direction.
Indicator Parameters: Experiment with different lengths and settings to find the combination that aligns with your trading style.
Whether you're a seasoned trader or just starting, Harmonic Trend Fusion equips you with the tools you need to navigate the markets confidently. Take control of your trading journey and enhance your decision-making process with this comprehensive trading assistant.

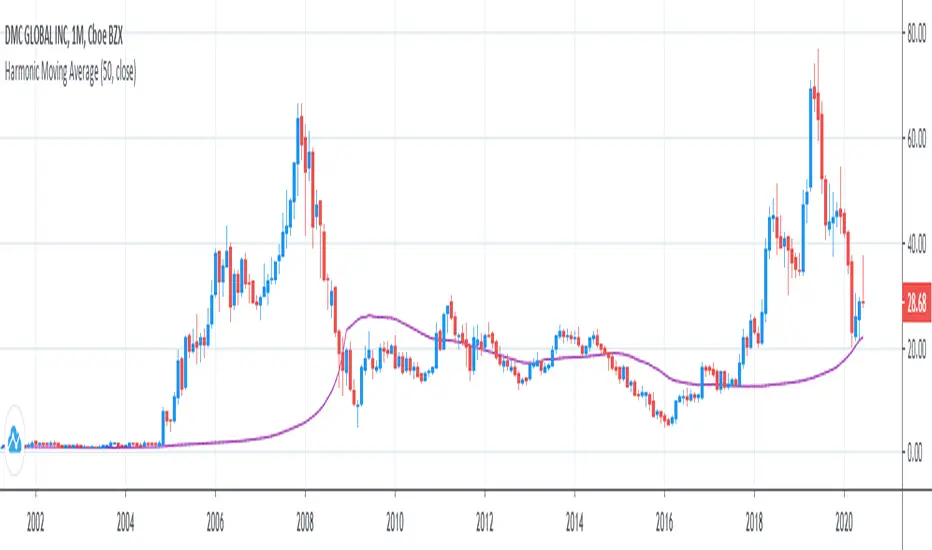
Harmonic Moving AverageI was legitimately surprised no1 has already coded it out on TradingView, but you guys can copypaste & include it in Pine 5 if your see this xd
Here is it.
I've checked and double checked everything, the calculations are right, it can be proved by plotting mean, geometric mean & harmonic mean together and noticing that geometric mean will be always between Harmonic mean, which is always below, and Mean, which is always above.
...
Other central tendency measures are also here as well for usability.
Harmonic forecastSo how to use this shit ?
1. we have the orange line and the lime line (they represent strongest resistance =orange, support=lime)
2. we use harmonic pattern to make prediction , blue lines are weak prediction direction and black one is the strongest prediction direction
3. so the black line show us where the trend go by the harmonic pattern

Harmonic Sniper Trigger [Fisher] - PyraTime**Concept: Precision Momentum**
The Harmonic Sniper Trigger is a custom-tuned implementation of the Fisher Transform, designed specifically to identify sharp market reversals with zero lag. Unlike standard moving averages that react slowly to price changes, the Fisher Transform uses Gaussian probability to convert price into a normal distribution, creating clear, sharp turning points.
This indicator serves as the *Trigger* component of the PyraTime system. While Time Cycles tell you *when* to look, this indicator tells you *what* to do.
Key Features
Visual Signal Markers : Prints clear "B" (Buy) and "S" (Sell) labels on the oscillator pane for instant recognition.
Trend Fills : Dynamic Green/Red shading between the signal lines makes it easy to identify trend direction at a glance.
Integrated Alerts: Fully compatible with TradingView alerts, allowing you to be notified the second momentum flips.
How to Use This Indicator
This tool is designed to filter out noise and identify the exact moment a trend reverses.
1. Wait for the Setup: Do not trade every signal. This indicator is most powerful when price is approaching a key support/resistance level or a specific Time Pivot.
2. The Trigger: When the Fisher line crosses the Signal line (changing from Red to Green or vice versa), it confirms that momentum has mathematically shifted.
3. The Execution: Use this crossover as your entry signal *only* if it aligns with your broader market thesis.
Best Practice:
Use this in conjunction with a Time-Cycle indicator (such as the GPM Architecture).
Scenario: Price hits a Vertical Time Line.
Action: Wait for this Fisher indicator to print a "B" or "S".
Result: You enter exactly at the pivot, minimizing drawdown.
Disclaimer: This tool is for technical analysis purposes only. Past performance does not guarantee future results.

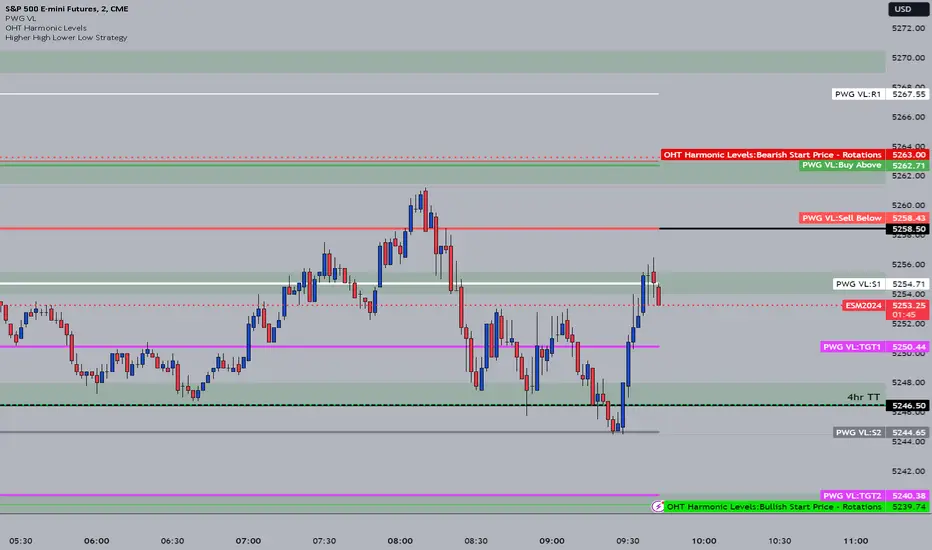
OHT Harmonic LevelsHarmonic Level plotter I've been talking about on the discord - right now a lot of this is manual and some day maybe we can get it to be automatic across different time frames but that is probably far off in the future.
For now, you need to probably create a new tab/layout for each instrument you add this to. It will then ask for the long start price and short start price. I would like to leave this how it is as I don't like using the top of pivot points, its lazy and you don't learn to go find the current trend.
The levels have an area around them equal to 10% of the rotation size, so if NQ has a rotation size of 60, there is a 6pt area around the actual level to either size to account for rotation average changes.
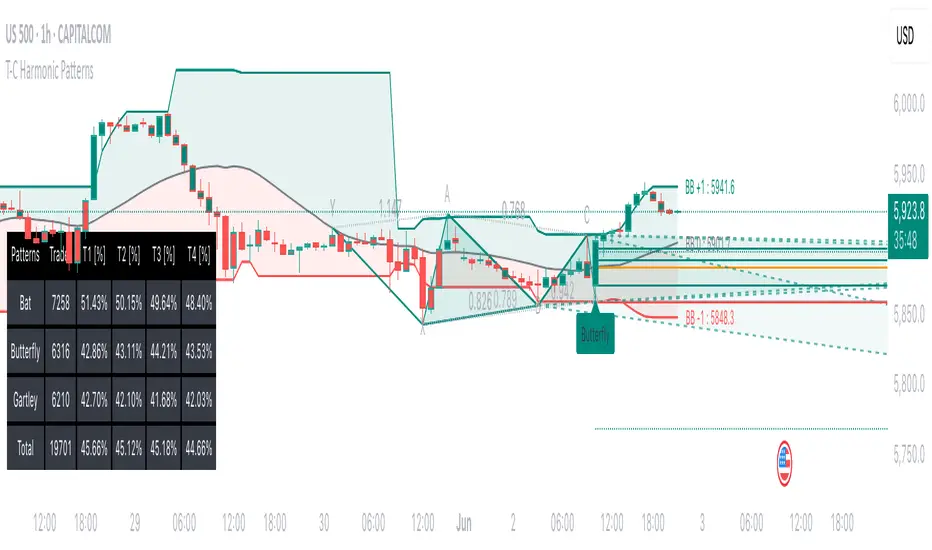
Tailored-Custom Hamonic Patterns█ OVERVIEW
We have included by default 3 known Patterns. The Bat, the Butterfly and the Gartley. But have you ever wondered how effective other,
not yet known models could be? Don't ask yourself the question anymore, it's time to find out for yourself! You have the option to customize
your own Patterns with the Backtesting tool and set Retracement Ratios and Targets for your own Patterns. In addition to this, in order to determine
the Trend at a glance and make Pattern detection more efficient, we have linked the calculation of Patterns to Bands of several types to choose
from (Bollinger, Keltner, Donchian) that you can select from a drop-down menu in the settings and play with the Multiplier
and the Adaptive Length of the Patterns to see how it affects the success rate in the Backtesting table.
█ HOW DOES IT WORK?
- Harmonic Patterns
-Pattern Names, Colors, Style etc… Everything is customizable.
-Dynamic Adaptative Length with Min/Max Length.
- XAB/ABC Ratio
-Min/Max XAB/ABC Configurable Ratio for each Pattern to create your own Patterns.
(This is really the particular option of this Indicator, because it allows you to be able to Backtest in real time
after having played at configuring your own Ratios)
- Bands
-Contrary to the original logic of the HeWhoMustNotBeNamed script, here when the price breaks out of the upper Bands
(example, Bollinger band, Keltner Channel or Donchian Channel) , with a predetermined Minimum and Maximum Length and Multiplier, we can consider
the Trend to be Bearish (and not Bullish) and similarly when the price breaks down in the lower band, we can consider the Trend
to be Bullish (not Bearish) . We have also added the middle line of the Channels (which can be useful for 'Scalper' type Traders.
-The Length of the Bands Filter is directly related to the Dynamic Length of the Patterns.
-You can use a drop-down menu to select from the following Bands Filters :
SMA, EMA, HMA, RMA, WMA, VWMA, HIGH/LOW, LINREG, MEDIAN.
-Sticky and Adaptive Bands options has been included.
- Projections
-BD/CD Projection Ratio configurable for each Pattern.
(Projections are visible as Dotted Lines which we can choose to Extend or not)
- Targets
-Target, PRZ and Stop Levels are set to optimal values based on individual Patterns. (The PRZ Level corresponds to point D
of the detected Pattern so its value should always be 0) but you can change the Targets value (defined in %) as you wish.
Again here, you have the option to fully configure the Style and Extend the Lines or not.
- Backtesting Table
-As said previously, with the possibility of testing the Success Rate of each of the 3 Customizable Patterns,
this option is part of the logic of this Indicator.
- Alerts
-We originally believe that this Indicator does not even need Alerts. But we still decided to include at least one Alert
that you can set for when a new Pattern is detected.
█ NOTES
Thanks to HeWhoMustNotBeNamed for his permission to reuse some part of his zigzag scripts.
Remember to only make a decision once you are sure of your analysis. Good trading sessions to everyone and don't forget,
risk management remains the most important!
Harmonic IndicatorThis indicator finds all of the gartley and cypher patterns on anychart and personally I have been using them profitably with BTC, ETH, and LTC. It includes entry points for both patterns but not TP levels, that is up to you to do research on. In version 2 I am working on this, if any of you can help me with that, it would be appreciated. Goodluck!

Fourier Extrapolator of Price w/ Projection Forecast [Loxx]Due to popular demand, I'm pusblishing Fourier Extrapolator of Price w/ Projection Forecast.. As stated in it's twin indicator, this one is also multi-harmonic (or multi-tone) trigonometric model of a price series xi, i=1..n, is given by:
xi = m + Sum( a*Cos(w*i) + b*Sin(w*i), h=1..H )
Where:
xi - past price at i-th bar, total n past prices;
m - bias;
a and b - scaling coefficients of harmonics;
w - frequency of a harmonic ;
h - harmonic number;
H - total number of fitted harmonics.
Fitting this model means finding m, a, b, and w that make the modeled values to be close to real values. Finding the harmonic frequencies w is the most difficult part of fitting a trigonometric model. In the case of a Fourier series, these frequencies are set at 2*pi*h/n. But, the Fourier series extrapolation means simply repeating the n past prices into the future.
This indicator uses the Quinn-Fernandes algorithm to find the harmonic frequencies. It fits harmonics of the trigonometric series one by one until the specified total number of harmonics H is reached. After fitting a new harmonic , the coded algorithm computes the residue between the updated model and the real values and fits a new harmonic to the residue.
see here: A Fast Efficient Technique for the Estimation of Frequency , B. G. Quinn and J. M. Fernandes, Biometrika, Vol. 78, No. 3 (Sep., 1991), pp . 489-497 (9 pages) Published By: Oxford University Press
The indicator has the following input parameters:
src - input source
npast - number of past bars, to which trigonometric series is fitted;
Nfut - number of predicted future bars;
nharm - total number of harmonics in model;
frqtol - tolerance of frequency calculations.
The indicator plots two curves: the green/red curve indicates modeled past values and the yellow/fuchsia curve indicates the modeled future values.
The purpose of this indicator is to showcase the Fourier Extrapolator method to be used in future indicators.

Fourier Extrapolator of Price [Loxx]Fourier Extrapolator of Price is a multi-harmonic (or multi-tone) trigonometric model of a price series xi, i=1..n, is given by:
xi = m + Sum( a *Cos(w *i) + b *Sin(w *i), h=1..H )
Where:
xi - past price at i-th bar, total n past prices;
m - bias;
a and b - scaling coefficients of harmonics;
w - frequency of a harmonic;
h - harmonic number;
H - total number of fitted harmonics.
Fitting this model means finding m, a , b , and w that make the modeled values to be close to real values. Finding the harmonic frequencies w is the most difficult part of fitting a trigonometric model. In the case of a Fourier series, these frequencies are set at 2*pi*h/n. But, the Fourier series extrapolation means simply repeating the n past prices into the future.
This indicator uses the Quinn-Fernandes algorithm to find the harmonic frequencies. It fits harmonics of the trigonometric series one by one until the specified total number of harmonics H is reached. After fitting a new harmonic, the coded algorithm computes the residue between the updated model and the real values and fits a new harmonic to the residue.
see here: A Fast Efficient Technique for the Estimation of Frequency , B. G. Quinn and J. M. Fernandes, Biometrika, Vol. 78, No. 3 (Sep., 1991), pp. 489-497 (9 pages) Published By: Oxford University Press
The indicator has the following input parameters:
src - input source
npast - number of past bars, to which trigonometric series is fitted;
nharm - total number of harmonics in model;
frqtol - tolerance of frequency calculations.
The indicator plots the modeled past values
The purpose of this indicator is to showcase the Fourier Extrapolator method to be used in future indicators. While this method can also prediction future price movements, for our purpose here we will avoid doing.

projectiontrackingLibrary "projectiontracking"
Library contains few data structures and methods for tracking harmonic patterns and projections via pinescript.
method erase(this)
erase Harmonic Projection Drawing
Namespace types: HarmonicProjectionDrawing
Parameters:
this (HarmonicProjectionDrawing) : HarmonicProjectionDrawing object
Returns: void
method erase(this)
erase HarmonicProjection
Namespace types: HarmonicProjection
Parameters:
this (HarmonicProjection) : HarmonicProjection object
Returns: void
method draw(this)
draw HarmonicProjection
Namespace types: HarmonicProjection
Parameters:
this (HarmonicProjection) : HarmonicProjection object
Returns: HarmonicProjection object
method getRanges(projectionPrzRanges, dir)
Convert PRZRange to Projection ranges
Namespace types: array
Parameters:
projectionPrzRanges (array type from Trendoscope/HarmonicMapLib/1) : array of PrzRange objects
dir (int) : Projection direction
Returns: array
ProjectionRange
Harmonic Projection Range
Fields:
patterns (array) : array of pattern names
start (series float) : Start Range
end (series float) : End Range
status (series int) : Projection Status
ProjectionProperties
Harmonic Projection Properties
Fields:
fillMajorTriangles (series bool) : Use linefill for major triangles
fillMinorTriangles (series bool) : Use linefill for minor triangles
majorFillTransparency (series int) : transparency of major triangles
minorFillTransparency (series int) : transparency of minor triangles
showXABC (series bool) : Show XABC labels
lblSizePivots (series string) : Pivot labels size
showRatios (series bool) : Show ratio labels
useLogScaleForScan (series bool) : Log scale is used for scanning projections
activateOnB (series bool) : Activate projections on reaching B
activationRatio (series float) : Use activation ratio for activation
confirmationRatio (series float) : Confirmation ratio of projection before removal
HarmonicProjectionDrawing
Harmonic Projection Projection drawing objects
Fields:
xa (series line) : line xa
ab (series line) : line ab
bc (series line) : line bc
xb (series line) : line xb
ac (series line) : line ac
x (series label) : Pivot label x
a (series label) : Pivot label a
b (series label) : Pivot label b
c (series label) : Pivot label c
xabRatio (series label) : Label XAB Ratio
abcRatio (series label) : Label ABC Ratio
HarmonicProjection
Harmonic Projection Projection object
Fields:
patternId (series int) : id of the pattern
dir (series int) : projection direction
x (chart.point) : Pivot X
a (chart.point) : Pivot A
b (chart.point) : Pivot B
c (chart.point) : Pivot C
patternColor (series color) : Color in which pattern is displayed
przRange (PrzRange type from Trendoscope/HarmonicMapLib/1) : PRZ Range
activationPrice (series float) : Projection activation price
reversalPrice (series float) : Projection reversal price
status (series int) : Projection status
properties (ProjectionProperties) : Projection properties
projectionRanges (array) : array of Projection Ranges
initialD (series float) : Initial D pivot
d (chart.point) : Pivot D
drawing (HarmonicProjectionDrawing) : HarmonicProjectionDrawing Object

PyraTime Harmonic 369Concept and Methodology PyraTime Harmonic 369 is a quantitative time-projection tool designed to apply Modular Arithmetic to market analysis. Unlike linear time indicators, this tool projects non-linear integer sequences derived from Digital Root Summation (Base-9 Reduction).
The core logic utilizes the mathematical progression of the 3-6-9 constants. By anchoring to a user-defined "Origin Pivot," the script projects three distinct harmonic triads to identify potential Temporal Confluence—moments where mathematical time cycles align with price action.
Technical Features This script focuses on the Standard Scalar (1x) projection of the Digital Root sequence:
The Root-3 Triad (Red): Projects intervals of 174, 285, 396. (Mathematical Sum: 1+7+4=12→3)
The Root-6 Triad (Green): Projects intervals of 417, 528, 639. (Mathematical Sum: 4+1+7=12→3, inverted)
The Root-9 Triad (Blue): Projects intervals of 741, 852, 963. (Mathematical Sum: 7+4+1=12→3... completion to 9)
How to Use
Set Anchor: Input the time of a significant High or Low in the settings.
Select Resolution: This tool is optimized for 1-minute (Micro-Harmonics) and 15-minute (Intraday Harmonics) charts.
Analyze Clusters: The vertical lines represent calculated harmonic intervals. Traders look for "Clusters" where a Root-3 and Root-9 cycle land on adjacent bars, indicating a high-probability pivot.
System Architecture & Version Comparison This script represents the foundational layer of the PyraTime ecosystem.
This Script (PyraTime Harmonic 369):
Scalar: Standard 1x Multiplier only.
Focus: Intraday & Micro-structure (1m, 15m).
Engine: Core Digital Root Integers.
PyraTime Harmonic Matrix (Advanced Edition):
Scalar Engine: Unlocks Quad-Fractal (4x), Tri-Fractal (3x), and Bi-Fractal (2x) multipliers for institutional cycle analysis.
Apex Logic: Auto-detection of the "963" Completion Sequence (Gold Highlight).
Event Horizon: Includes a live Predictive Dashboard that calculates the time-delta to the next harmonic event across all scalar groups.
Disclaimer This tool is for the educational analysis of Number Theory in financial markets. It projects time intervals and does not predict price direction. Past performance does not guarantee future results.

Pattern Detector [theUltimator5]🎯 Overview
The Pattern Detector is a comprehensive technical analysis indicator that automatically identifies and visualizes multiple pattern types on your charts. Built with advanced ZigZag technology and sophisticated pattern recognition algorithms, this tool helps traders spot high-probability trading opportunities across all timeframes and markets.
✨ Key Features
🔍 Multi-Pattern Detection System
Harmonic Patterns: Butterfly, Gartley, Bat, and Crab patterns with precise Fibonacci ratios
Classic Reversal Patterns: Head & Shoulders and Inverse Head & Shoulders
Double Patterns: Double Tops and Double Bottoms with extreme validation
Wedge Patterns: Rising and Falling Wedges with volume confirmation
📊 Advanced ZigZag Engine
Customizable sensitivity (5-50 levels)
Depth multiplier for multi-timeframe analysis
Real-time pivot detection with noise filtering
Option to display ZigZag lines only for pure price action analysis
🎨 Visualization
Clean pattern lines with distinct color coding
Point labeling system (X, A, B, C, D for harmonics / LS, H, RS for H&S)
Pattern name displays with bullish/bearish direction
Price target projections with arrow indicators
Subtle pattern fills for enhanced visibility
🛠️ Settings & Configuration
Core ZigZag Settings
ZigZag Sensitivity (5-50): Controls pattern detection sensitivity. Lower values detect more patterns but may include noise. Higher values focus on major swings only.
ZigZag Depth Multiplier (1-5): Multiplies sensitivity for deeper analysis. Level 1 = most responsive, Level 5 = major swings only.
Pattern Detection Toggles
Show ZigZag Lines Only: Displays pure ZigZag without pattern detection for price structure analysis
Detect Harmonic Patterns: Enable/disable Fibonacci-based harmonic pattern detection
Detect Head & Shoulders: Toggle classic reversal pattern identification
Detect Double Tops/Bottoms: Enable double pattern detection with extreme validation
Detect Wedge Patterns: Toggle wedge pattern detection with volume confirmation
Display Options
Show Pattern Names: Display pattern names directly on chart (e.g., "Butterfly (Bullish)")
Show Point Labels: Add lettered labels at key pattern points for structure identification
Project Harmonic Targets: Show projected completion points for incomplete harmonic patterns
📈 Pattern Types Explained
Harmonic Patterns 🦋
Advanced Fibonacci-based patterns that provide high-probability reversal signals:
Butterfly: AB=0.786 XA, BC=0.382-0.886 AB, CD=1.618-2.24 BC
Gartley: AB=0.618 XA, BC=0.382-0.886 AB, CD=1.272-1.618 BC
Bat: AB=0.382-0.50 XA, BC=0.382-0.886 AB, CD=1.618-2.24 BC
Crab: AB=0.382-0.618 XA, BC=0.382-0.886 AB, CD=2.24-3.618 BC
Head & Shoulders 👤
Classic three-peak reversal pattern indicating trend exhaustion:
Standard H&S: Bearish reversal at tops
Inverse H&S: Bullish reversal at bottoms
Automatic neckline validation and price target calculation
Double Patterns 📊
Powerful reversal patterns with extreme validation:
Double Top: Two similar highs with valley between (bearish)
Double Bottom: Two similar lows with peak between (bullish)
Includes lookback period validation to ensure patterns are significant extremes
Wedge Patterns 📐
Continuation/reversal patterns with converging trend lines:
Rising Wedge: Converging upward slopes (typically bearish)
Falling Wedge: Converging downward slopes (typically bullish)
Volume confirmation required for increased accuracy
🎯 Trading Applications
Entry Signals
Harmonic Patterns: Enter at point D completion with targets at point A
H&S Patterns: Enter on neckline break with calculated targets
Double Patterns: Enter on support/resistance break with measured moves
Wedge Patterns: Enter on breakout direction with volume confirmation
Risk Management
Use pattern structure for logical stop placement
Pattern invalidation levels provide clear exit rules
Multiple pattern confirmation increases probability
Multi-Timeframe Analysis
Higher ZigZag depth for longer-term patterns
Lower sensitivity for short-term trading patterns
Combine with other timeframes for confluence
⚙️ Optimal Settings
For Day Trading (1m-15m charts)
ZigZag Sensitivity: 5-9
Depth Multiplier: 1-2
Enable all pattern types for maximum opportunities
For Swing Trading (1H-4H charts)
ZigZag Sensitivity: 9-15
Depth Multiplier: 2-3
Focus on harmonic and H&S patterns
For Position Trading (Daily+ charts)
ZigZag Sensitivity: 15-25
Depth Multiplier: 3-5
Emphasize major harmonic and double patterns
🔧 Technical Specifications
Maximum Lookback: 5000 bars for comprehensive analysis
Pattern Overlap Prevention: Intelligent filtering prevents duplicate patterns
Performance Optimized: Efficient algorithms for real-time detection
Volume Integration: Advanced volume analysis for wedge confirmation
Fibonacci Precision: 10% tolerance for harmonic ratio validation
📚 How to Use
Add to Chart: Apply indicator to any timeframe/market
Configure Settings: Adjust sensitivity based on trading style
Enable Patterns: Toggle desired pattern types
Analyze Results: Look for completed patterns with clear structure
Plan Trades: Use price targets and pattern invalidation for trade management
Perfect for both novice and experienced traders seeking systematic pattern recognition with visualization and entry/exit signals.

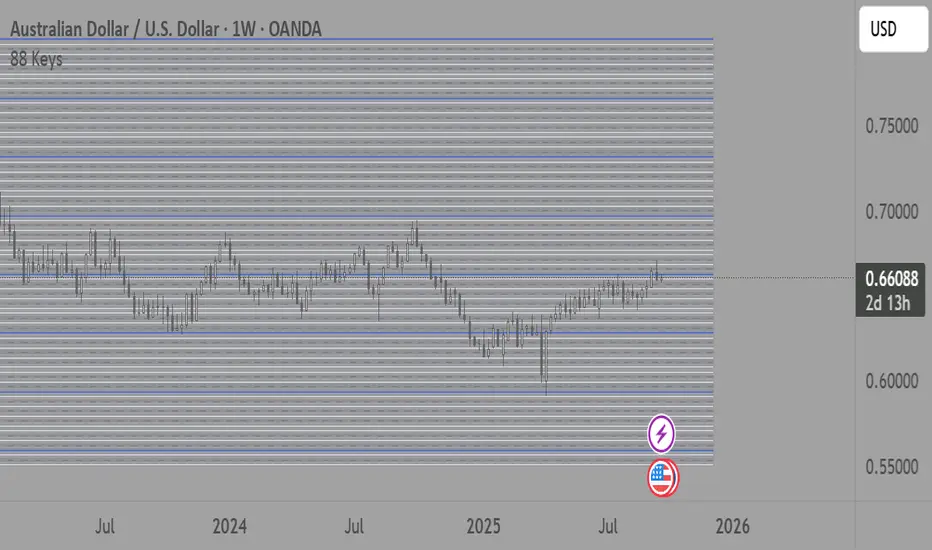
88-Key Piano Range - Musical Price Levels88-Key Piano Range - Musical Price Levels
Description:
Explore price analysis through musical harmony! This educational indicator maps price movements to the standard 88-key piano keyboard (A0 to C8), offering a creative way to visualize market ranges and explore harmonic price relationships with authentic keyboard-style background fills.
🎹 KEY FEATURES:
• Complete 88-Key Mapping - Full piano range from A0 to C8 mapped to your price range
• Piano-Style Visual Design - Clean background fills distinguishing white keys, black keys, and octaves
• Dual Anchor System - Set two time/price points to define your analytical range
• Flexible Display Options - Show all 88 keys, octaves only (C notes), or custom selections
• Harmonic Exploration - Explore consonant/dissonant key relationships based on music theory
• Real-time Price Note - See what musical note your current price represents
• Customizable Interface - Adjust colors, line widths, fills, and visual elements
🎵 EDUCATIONAL CONCEPTS:
• Octave Levels - C notes as harmonic reference points (similar to round numbers)
• Key Classifications - Natural notes (white keys) vs chromatic notes (black keys)
• Harmonic Intervals - Musical relationships applied to price analysis
• Creative Visualization - Alternative way to view price ranges and movements
⚙️ HOW TO USE:
1. Select Your Price Leg - Choose an upleg, downleg, or significant price movement to explore
2. Set Anchor A - Place at the start of your selected leg (swing low for upleg, swing high for downleg)
3. Set Anchor B - Place at the end of your selected leg (swing high for upleg, swing low for downleg)
4. Configure Display - Select all keys, octaves only, or enable background fills
5. Explore Harmonics - Enable harmony coloring to see musical relationships
6. Study Patterns - Observe how price movements align with musical intervals
🎼 CREATIVE APPLICATIONS:
• Experimental Analysis - Try a musical approach to leg analysis
• Educational Tool - Learn about mathematical relationships in both music and markets
• Alternative Perspective - View support/resistance through a musical lens
• Pattern Recognition - Explore if harmonic levels show interesting price behavior
• Fun Learning - Combine musical knowledge with trading concepts
📊 EXPERIMENTAL USE:
• Creative alternative to traditional Fibonacci levels
• Educational exploration of mathematical harmony in markets
• Interesting way to visualize price ranges and retracements
• Novel approach for musicians interested in trading concepts
Important Note: This is an educational and experimental tool that applies musical theory concepts to price analysis. It should be used for learning and exploration purposes alongside proven technical analysis methods. The musical relationships are mathematically based but not validated as reliable trading signals.
VPOC Harmonics - Liquidity-Weighted Price / Time RatiosVPOC Harmonics - Liquidity-Weighted Price / Time Ratios
Summary
This indicator transforms a swing’s price range, duration, and liquidity profile into a structured set of price-per-bar ratios. By anchoring two points and manually entering the swing’s VPOC (highest-volume price), it generates candidate compression values that unify price, time, and liquidity structure. These values can be applied to chart scaling, harmonic testing, and liquidity-aware market geometry.
________________________________________
Overview
Most swing analysis tools only consider price (ΔP) and time (N bars). This script goes further by incorporating the VPOC (Point of Control) — the price with the highest traded volume — directly into swing geometry.
• Anchors define the swing’s Low (L), High (H), and bar count (N).
• The user manually enters the VPOC (highest-volume price).
• The indicator then computes a suite of ratios that integrate range, duration, and liquidity placement.
The output is a table of liquidity-weighted price-per-bar candidates, designed for compression testing and harmonic analysis across swings and instruments.
________________________________________
How to Use
1. Select a Swing
- Place Anchor A and Anchor B to define the swing’s Low, High, and bar count.
2. Find the VPOC
- Apply TradingView’s Fixed Range Volume Profile tool over the same swing.
- Identify the Point of Control (POC) — the price level with the highest traded volume.
3. Enter the VPOC
- Manually input the POC into the indicator settings.
4. Review Outputs
- The table will display candidate ratios expressed mainly as price-per-bar values.
5. Apply in Practice
- Use the ratios as chart compression inputs or as benchmarks for testing harmonic alignments across swings.
________________________________________
Outputs
Swing & Inputs
• Bars (N): total bar count of the swing.
• Low (L): swing low price.
• High (H): swing high price.
• ΔP = H − L: price range.
• Mid = (L + H) ÷ 2: midpoint price.
• VPOC (V): user-entered highest-volume price.
• Base slope s0 = ΔP ÷ N: average change per bar.
• π-adjusted slope sπ = (π × ΔP) ÷ (2 × N): slope adjusted for half-cycle arc geometry.
________________________________________
VPOC Harmony Ratios (L, H, V, N)
• λ = (V − L) ÷ ΔP: normalized VPOC position within the range.
• R = (V − L) ÷ (H − V): symmetry ratio comparing lower vs. upper segment.
• s1 = (V − L) ÷ N: slope from Low → VPOC.
• s2 = (H − V) ÷ N: slope from VPOC → High.
________________________________________
Blended Means (s1, s2)
These combine the two segment slopes in different ways:
• HM(s1,s2) = 2 ÷ (1/s1 + 1/s2): Harmonic mean, emphasizes the smaller slope.
• GM(s1,s2) = sqrt(s1 × s2): Geometric mean, balances both slopes proportionally.
• RMS(s1,s2) = sqrt((s1² + s2²) ÷ 2): Root-mean-square, emphasizes the larger slope.
• L2 = sqrt(s1² + s2²): Euclidean norm, the vector length of both slopes combined.
________________________________________
Slope Blends
• Quadratic weighting: s_quad = s0 × ((V−L)² + (H−V)²) ÷ (ΔP²)
• Tilted slope: s_tilt = s0 × (0.5 + λ)
• Entropy-scaled slope: s_ent = s0 × H2(λ), with H2(λ) = −
________________________________________
Curvature & Liquidity Extensions
• π-arc × λ: s_arc = sπ × λ
• Liquidity-π: s_piV = sπ × (V ÷ Mid)
________________________________________
Scale-Normalized Families
With k = sqrt(H ÷ L):
• k (scale factor) = sqrt(H ÷ L)
• s_comp = s0 ÷ k: compressed slope candidate
• s_exp = s0 × k: expanded slope candidate
• Exponentiated blends:
- s_kλ = s0 × k^(2λ−1)
- s_φλ = s0 × φ^(2λ−1), with φ = golden ratio ≈ 1.618
- s_√2λ = s0 × (√2)^(2λ−1)
________________________________________
Practical Application
All formulas generate liquidity-weighted price-per-bar ratios that integrate range, time, and VPOC placement.
These values are designed for:
• Chart compression settings
• Testing harmonic alignments across swings
• Liquidity-aware scaling experiments
________________________________________

Gyspy Bot Trade Engine - V1.2B - Alerts - 12-7-25 - SignalLynxGypsy Bot Trade Engine (MK6 V1.2B) - Alerts & Visualization
Brought to you by Signal Lynx | Automation for the Night-Shift Nation 🌙
1. Executive Summary & Architecture
Gypsy Bot (MK6 V1.2B) is not merely a strategy; it is a massive, modular Trade Engine built specifically for the TradingView Pine Script V6 environment. While most tools rely on a single dominant indicator to generate signals, Gypsy Bot functions as a sophisticated Consensus Algorithm.
Note: This is the Indicator / Alerts version of the engine. It is designed for visual analysis and generating live alert signals for automation. If you wish to see Backtest data (Equity Curves, Drawdown, Profit Factors), please use the Strategy version of this script.
The engine calculates data from up to 12 distinct Technical Analysis Modules simultaneously on every bar closing. It aggregates these signals into a "Vote Count" and only fires a signal plot when a user-defined threshold of concurring signals is met. This "Voting System" acts as a noise filter, requiring multiple independent mathematical models—ranging from volume flow and momentum to cyclical harmonics and trend strength—to agree on market direction.
Beyond entries, Gypsy Bot features a proprietary Risk Management suite called the Dump Protection Team (DPT). This logic layer operates independently of the entry modules, specifically scanning for "Moon" (Parabolic) or "Nuke" (Crash) volatility events to signal forced exits, preserving capital during Black Swan events.
2. ⚠️ The Philosophy of "Curve Fitting" (Must Read)
One must be careful when applying Gypsy Bot to new pairs or charts.
To be fully transparent: Gypsy Bot is, by definition, a very advanced curve-fitting engine. Because it grants the user granular control over 12 modules, dozens of thresholds, and specific voting requirements, it is extremely easy to "over-fit" the data. You can easily toggle switches until the charts look perfect in hindsight, only to have the signals fail in live markets because they were tuned to historical noise rather than market structure.
To use this engine successfully:
Visual Verification: Do not just look for "green arrows." Look for signals that occur at logical market structure points.
Stability: Ensure signals are not flickering. This script uses closed-candle logic for key decisions to ensure that once a signal plots, it remains painted.
Regular Maintenance is Mandatory: Markets shift regimes (e.g., from Bull Trend to Crab Range). Gypsy Bot settings should be reviewed and adjusted at regular intervals to ensure the voting logic remains aligned with current market volatility.
Timeframe Recommendations:
Gypsy Bot is optimized for High Time Frame (HTF) trend following. It generally produces the most reliable results on charts ranging from 1-Hour to 12-Hours, with the 4-Hour timeframe historically serving as the "sweet spot" for most major cryptocurrency assets.
3. The Voting Mechanism: How Entries Are Generated
The heart of the Gypsy Bot engine is the ActivateOrders input (found in the "Order Signal Modifier" settings).
The engine constantly monitors the output of all enabled Modules.
Long Votes: GoLongCount
Short Votes: GoShortCount
If you have 10 Modules enabled, and you set ActivateOrders to 7:
The engine will ONLY plot a Buy Signal if 7 or more modules return a valid "Buy" signal on the same closed candle.
If only 6 modules agree, the signal is rejected.
4. Technical Deep Dive: The 12 Modules
Gypsy Bot allows you to toggle the following modules On/Off individually to suit the asset you are trading.
Module 1: Modified Slope Angle (MSA)
Logic: Calculates the geometric angle of a moving average relative to the timeline.
Function: Filters out "lazy" trends. A trend is only considered valid if the slope exceeds a specific steepness threshold.
Module 2: Correlation Trend Indicator (CTI)
Logic: Measures how closely the current price action correlates to a straight line (a perfect trend).
Function: Ensures that we are moving up with high statistical correlation, reducing fake-outs.
Module 3: Ehlers Roofing Filter
Logic: A spectral filter combining High-Pass (trend removal) and Super Smoother (noise removal).
Function: Isolates the "Roof" of price action to catch cyclical turning points before standard moving averages.
Module 4: Forecast Oscillator
Logic: Uses Linear Regression forecasting to predict where price "should" be relative to where it is.
Function: Signals when the regression trend flips. Offers "Aggressive" and "Conservative" calculation modes.
Module 5: Chandelier ATR Stop
Logic: A volatility-based trend follower that hangs a "leash" (ATR multiple) from extremes.
Function: Used as an entry filter. If price is above the Chandelier line, the trend is Bullish.
Module 6: Crypto Market Breadth (CMB)
Logic: Pulls data from multiple major tickers (BTC, ETH, and Perpetual Contracts).
Function: Calculates "Market Health." If Bitcoin is rising but the rest of the market is dumping, this module can veto a trade.
Module 7: Directional Index Convergence (DIC)
Logic: Analyzes the convergence/divergence between Fast and Slow Directional Movement indices.
Function: Identifies when trend strength is expanding.
Module 8: Market Thrust Indicator (MTI)
Logic: A volume-weighted breadth indicator using Advance/Decline and Volume data.
Function: One of the most powerful modules. Confirms that price movement is supported by actual volume flow. Recommended setting: "SSMA" (Super Smoother).
Module 9: Simple Ichimoku Cloud
Logic: Traditional Japanese trend analysis.
Function: Checks for a "Kumo Breakout." Price must be fully above/below the Cloud to confirm entry.
Module 10: Simple Harmonic Oscillator
Logic: Analyzes harmonic wave properties to detect cyclical tops and bottoms.
Function: Serves as a counter-trend or early-reversal detector.
Module 11: HSRS Compression / Super AO
Logic: Detects volatility compression (HSRS) or Momentum/Trend confluence (Super AO).
Function: Great for catching explosive moves resulting from consolidation.
Module 12: Fisher Transform (MTF)
Logic: Converts price data into a Gaussian normal distribution.
Function: Identifies extreme price deviations. Uses Multi-Timeframe (MTF) logic to ensure you aren't trading against the major trend.
5. Global Inhibitors (The Veto Power)
Even if 12 out of 12 modules vote "Buy," Gypsy Bot performs a final safety check using Global Inhibitors.
Bitcoin Halving Logic: Prevents trading during chaotic weeks surrounding Halving events (dates projected through 2040).
Miner Capitulation: Uses Hash Rate Ribbons to identify bearish regimes when miners are shutting down.
ADX Filter: Prevents trading in "Flat/Choppy" markets (Low ADX).
CryptoCap Trend: Checks the total Crypto Market Cap chart for broad market alignment.
6. Risk Management & The Dump Protection Team (DPT)
Even in this Indicator version, the RM logic runs to generate Exit Signals.
Dump Protection Team (DPT): Detects "Nuke" (Crash) or "Moon" (Pump) volatility signatures. If triggered, it plots an immediate Exit Signal (Yellow Plot).
Advanced Adaptive Trailing Stop (AATS): Dynamically tightens stops in low volatility ("Dungeon") and loosens them in high volatility ("Penthouse").
Staged Take Profits: Plots TP1, TP2, and TP3 events on the chart for visual confirmation or partial exit alerts.
7. Recommended Setup Guide
When applying Gypsy Bot to a new chart, follow this sequence:
Set Timeframe: 4 Hours (4H).
Tune DPT: Adjust "Dump/Moon Protection" inputs first. These filter out bad signals during high volatility.
Tune Module 8 (MTI): Experiment with the MA Type (SSMA is recommended).
Select Modules: Enable/Disable modules based on the asset's personality (Trending vs. Ranging).
Voting Threshold: Adjust ActivateOrders to filter out noise.
Alert Setup: Once visually satisfied, use the "Any Alert Function Call" option when creating an alert in TradingView to capture all Buy/Sell/Close events generated by the engine.
8. Technical Specs
Engine Version: Pine Script V6
Repainting: This indicator uses Closed Candle data for all Risk Management and Entry decisions. This ensures that signals do not vanish after the candle closes.
Visuals:
Blue Plot: Buy/Sell Signal.
Yellow Plot: Risk Management (RM) / DPT Close Signal.
Green/Lime/Olive Plots: Take Profit hits.
Disclaimer:
This script is a complex algorithmic tool for market analysis. Past performance is not indicative of future results. Cryptocurrency trading involves substantial risk of loss. Use this tool to assist your own decision-making, not to replace it.
9. About Signal Lynx
Automation for the Night-Shift Nation 🌙
Signal Lynx focuses on helping traders and developers bridge the gap between indicator logic and real-world automation. The same RM engine you see here powers multiple internal systems and templates, including other public scripts like the Super-AO Strategy with Advanced Risk Management.
We provide this code open source under the Mozilla Public License 2.0 (MPL-2.0) to:
Demonstrate how Adaptive Logic and structured Risk Management can outperform static, one-layer indicators
Give Pine Script users a battle-tested RM backbone they can reuse, remix, and extend
If you are looking to automate your TradingView strategies, route signals to exchanges, or simply want safer, smarter strategy structures, please keep Signal Lynx in your search.
License: Mozilla Public License 2.0 (Open Source).
If you make beneficial modifications, please consider releasing them back to the community so everyone can benefit.

Gyspy Bot Trade Engine - V1.2B - Strategy 12-7-25 - SignalLynxGypsy Bot Trade Engine (MK6 V1.2B) - Ultimate Strategy & Backtest
Brought to you by Signal Lynx | Automation for the Night-Shift Nation 🌙
1. Executive Summary & Architecture
Gypsy Bot (MK6 V1.2B) is not merely a strategy; it is a massive, modular Trade Engine built specifically for the TradingView Pine Script environment. While most strategies rely on a single dominant indicator (like an RSI cross or a MACD flip) to generate signals, Gypsy Bot functions as a sophisticated Consensus Algorithm.
The engine calculates data from up to 12 distinct Technical Analysis Modules simultaneously on every bar closing. It aggregates these signals into a "Vote Count" and only executes a trade entry when a user-defined threshold of concurring signals is met. This "Voting System" acts as a noise filter, requiring multiple independent mathematical models—ranging from volume flow and momentum to cyclical harmonics and trend strength—to agree on market direction before capital is committed.
Beyond entries, Gypsy Bot features a proprietary Risk Management suite called the Dump Protection Team (DPT). This logic layer operates independently of the entry modules, specifically scanning for "Moon" (Parabolic) or "Nuke" (Crash) volatility events to force-exit positions, overriding standard stops to preserve capital during Black Swan events.
2. ⚠️ The Philosophy of "Curve Fitting" (Must Read)
One must be careful when applying Gypsy Bot to new pairs or charts.
To be fully transparent: Gypsy Bot is, by definition, a very advanced curve-fitting engine. Because it grants the user granular control over 12 modules, dozens of thresholds, and specific voting requirements, it is extremely easy to "over-fit" the data. You can easily toggle switches until the backtest shows a 100% win rate, only to have the strategy fail immediately in live markets because it was tuned to historical noise rather than market structure.
To use this engine successfully, you must adopt a specific optimization mindset:
Ignore Raw Net Profit: Do not tune for the highest dollar amount. A strategy that makes $1M in the backtest but has a 40% drawdown is useless.
Prioritize Stability: Look for a high Profit Factor (1.5+), a high Percent Profitable, and a smooth equity curve.
Regular Maintenance is Mandatory: Markets shift regimes (e.g., from Bull Trend to Crab Range). Parameters that worked perfectly in 2021 may fail in 2024. Gypsy Bot settings should be reviewed and adjusted at regular intervals (e.g., quarterly) to ensure the voting logic remains aligned with current market volatility.
Timeframe Recommendations:
Gypsy Bot is optimized for High Time Frame (HTF) trend following. It generally produces the most reliable results on charts ranging from 1-Hour to 12-Hours, with the 4-Hour timeframe historically serving as the "sweet spot" for most major cryptocurrency assets.
3. The Voting Mechanism: How Entries Are Generated
The heart of the Gypsy Bot engine is the ActivateOrders input (found in the "Order Signal Modifier" settings).
The engine constantly monitors the output of all enabled Modules.
Long Votes: GoLongCount
Short Votes: GoShortCount
If you have 10 Modules enabled, and you set ActivateOrders to 7:
The engine will ONLY trigger a Buy Entry if 7 or more modules return a valid "Buy" signal on the same closed candle.
If only 6 modules agree, the trade is rejected.
This allows you to mix "Leading" indicators (Oscillators) with "Lagging" indicators (Moving Averages) to create a high-probability entry signal that requires momentum, volume, and trend to all be in alignment.
4. Technical Deep Dive: The 12 Modules
Gypsy Bot allows you to toggle the following modules On/Off individually to suit the asset you are trading.
Module 1: Modified Slope Angle (MSA)
Logic: Calculates the geometric angle of a moving average relative to the timeline.
Function: It filters out "lazy" trends. A trend is only considered valid if the slope exceeds a specific steepness threshold. This helps avoid entering trades during weak drifts that often precede a reversal.
Module 2: Correlation Trend Indicator (CTI)
Logic: Based on John Ehlers' work, this measures how closely the current price action correlates to a straight line (a perfect trend).
Function: It outputs a confidence score (-1 to 1). Gypsy Bot uses this to ensure that we are not just moving up, but moving up with high statistical correlation, reducing fake-outs.
Module 3: Ehlers Roofing Filter
Logic: A sophisticated spectral filter that combines a High-Pass filter (to remove long-term drift) with a Super Smoother (to remove high-frequency noise).
Function: It attempts to isolate the "Roof" of the price action. It is excellent at catching cyclical turning points before standard moving averages react.
Module 4: Forecast Oscillator
Logic: Uses Linear Regression forecasting to predict where price "should" be relative to where it is.
Function: When the Forecast Oscillator crosses its zero line, it indicates that the regression trend has flipped. We offer both "Aggressive" and "Conservative" calculation modes for this module.
Module 5: Chandelier ATR Stop
Logic: A volatility-based trend follower that hangs a "leash" (ATR multiple) from the highest high (for longs) or lowest low (for shorts).
Function: Used here as an entry filter. If price is above the Chandelier line, the trend is Bullish. It also includes a "Bull/Bear Qualifier" check to ensure structural support.
Module 6: Crypto Market Breadth (CMB)
Logic: This is a macro-filter. It pulls data from multiple major tickers (BTC, ETH, and Perpetual Contracts) across different exchanges.
Function: It calculates a "Market Health" percentage. If Bitcoin is rising but the rest of the market is dumping, this module can veto a trade, ensuring you don't buy into a "fake" rally driven by a single asset.
Module 7: Directional Index Convergence (DIC)
Logic: Analyzes the convergence/divergence between Fast and Slow Directional Movement indices.
Function: Identifies when trend strength is expanding. A buy signal is generated only when the positive directional movement overpowers the negative movement with expanding momentum.
Module 8: Market Thrust Indicator (MTI)
Logic: A volume-weighted breadth indicator. It uses Advance/Decline data and Up/Down Volume data.
Function: This is one of the most powerful modules. It confirms that price movement is supported by actual volume flow. We recommend using the "SSMA" (Super Smoother) MA Type for the cleanest signals on the 4H chart.
Module 9: Simple Ichimoku Cloud
Logic: Traditional Japanese trend analysis using the Tenkan-sen and Kijun-sen.
Function: Checks for a "Kumo Breakout." Price must be fully above the Cloud (for longs) or below it (for shorts). This is a classic "trend confirmation" module.
Module 10: Simple Harmonic Oscillator
Logic: Analyzes the harmonic wave properties of price action to detect cyclical tops and bottoms.
Function: Serves as a counter-trend or early-reversal detector. It tries to identify when a cycle has bottomed out (for buys) or topped out (for sells) before the main trend indicators catch up.
Module 11: HSRS Compression / Super AO
Logic: Two options in one.
HSRS: Hirashima Sugita Resistance Support. Detects volatility compression (squeezes) relative to dynamic support/resistance bands.
Super AO: A combination of the Awesome Oscillator and SuperTrend logic.
Function: Great for catching explosive moves that result from periods of low volatility (consolidation).
Module 12: Fisher Transform (MTF)
Logic: Converts price data into a Gaussian normal distribution.
Function: Identifies extreme price deviations. This module uses Multi-Timeframe (MTF) logic to look at higher-timeframe trends (e.g., looking at the Daily Fisher while trading the 4H chart) to ensure you aren't trading against the major trend.
5. Global Inhibitors (The Veto Power)
Even if 12 out of 12 modules vote "Buy," Gypsy Bot performs a final safety check using Global Inhibitors. If any of these are triggered, the trade is blocked.
Bitcoin Halving Logic:
Hardcoded dates for past and projected future Bitcoin halvings (up to 2040).
Trading is inhibited or restricted during the chaotic weeks immediately surrounding a Halving event to avoid volatility crushes.
Miner Capitulation:
Uses Hash Rate Ribbons (Moving averages of Hash Rate).
If miners are capitulating (Shutting down rigs due to unprofitability), the engine flags a "Bearish" regime and can flip logic to Short-only or flat.
ADX Filter (Flat Market Protocol):
If the Average Directional Index (ADX) is below a specific threshold (e.g., 20), the market is deemed "Flat/Choppy." The bot will refuse to open trend-following trades in a flat market.
CryptoCap Trend:
Checks the total Crypto Market Cap chart. If the broad market is in a downtrend, it can inhibit Long entries on individual altcoins.
6. Risk Management & The Dump Protection Team (DPT)
Gypsy Bot separates "Entry Logic" from "Risk Management Logic."
Dump Protection Team (DPT)
This is a specialized logic branch designed to save the account during Black Swan events.
Nuke Protection: If the DPT detects a volatility signature consistent with a flash crash, it overrides all other logic and forces an immediate exit.
Moon Protection: If a parabolic pump is detected that violates statistical probability (Bollinger deviations), DPT can force a profit take before the inevitable correction.
Advanced Adaptive Trailing Stop (AATS)
Unlike a static trailing stop (e.g., "trail by 5%"), AATS is dynamic.
Penthouse Level: If price is at the top of the HSRS channel (High Volatility), the stop loosens to allow for wicks.
Dungeon Level: If price is compressed at the bottom, the stop tightens to protect capital.
Staged Take Profits
TP1: Scalp a portion (e.g., 10%) to cover fees and secure a win.
TP2: Take the bulk of profit.
TP3: Leave a "Runner" position with a loose trailing stop to catch "Moon" moves.
7. Recommended Setup Guide
When applying Gypsy Bot to a new chart, follow this sequence:
Set Timeframe: 4 Hours (4H).
Reset: Turn OFF Trailing Stop, Stop Loss, and Take Profits. (We want to see raw entry performance first).
Tune DPT: Adjust "Dump/Moon Protection" inputs first. These have the highest impact on net performance.
Tune Module 8 (MTI): This module is a heavy filter. Experiment with the MA Type (SSMA is recommended).
Select Modules: Enable/Disable modules 1-12 based on the asset's personality (Trending vs. Ranging).
Voting Threshold: Adjust ActivateOrders. A lower number = More Trades (Aggressive). A higher number = Fewer, higher conviction trades (Conservative).
Final Polish: Re-enable Stop Losses, Trailing Stops, and Staged Take Profits to smooth the equity curve and define your max risk per trade.
8. Technical Specs
Engine Version: Pine Script V6
Repainting: This strategy uses Closed Candle data for all Risk Management and Entry decisions. This ensures that Backtest results align closely with real-time behavior (no repainting of historical signals).
Alerts: This script generates Strategy alerts. If you require visual-only alerts, see the source code header for instructions on switching to "Study" (Indicator) mode.
Disclaimer:
This script is a complex algorithmic tool for market analysis. Past performance is not indicative of future results. Use this tool to assist your own decision-making, not to replace it.
9. About Signal Lynx
Automation for the Night-Shift Nation 🌙
Signal Lynx focuses on helping traders and developers bridge the gap between indicator logic and real-world automation. The same RM engine you see here powers multiple internal systems and templates, including other public scripts like the Super-AO Strategy with Advanced Risk Management.
We provide this code open source under the Mozilla Public License 2.0 (MPL-2.0) to:
Demonstrate how Adaptive Logic and structured Risk Management can outperform static, one-layer indicators
Give Pine Script users a battle-tested RM backbone they can reuse, remix, and extend
If you are looking to automate your TradingView strategies, route signals to exchanges, or simply want safer, smarter strategy structures, please keep Signal Lynx in your search.
License: Mozilla Public License 2.0 (Open Source).
If you make beneficial modifications, please consider releasing them back to the community so everyone can benefit.

Fibonacci Circle Zones🟩 The Fibonacci Circle Zones indicator is a technical visualization tool, building upon the concept of traditional Fibonacci circles. It provides configurable options for analyzing geometric relationships between price and time, used to identify potential support and resistance zones derived from circle-based projections. The indicator constructs these Fibonacci circles based on two user-selected anchor points (Point A and Point B), which define the foundational price range and time duration for the geometric analysis.
Key features include multiple mathematical Circle Formulas for radius scaling and several options for defining the circle's center point, enabling exploration of complex, non-linear geometric relationships between price and time distinct from traditional linear Fibonacci analysis. Available formulas incorporate various mathematical constants (π, e, φ variants, Silver Ratio) alongside traditional Fibonacci ratios, facilitating investigation into different scaling hypotheses. Furthermore, selecting the Center point relative to the A-B anchors allows these circular time-price patterns to be constructed and analyzed from different geometric perspectives. Analysis can be further tailored through detailed customization of up to 12 Fibonacci levels, including their mathematical values, colors, and visibility..
📚 THEORY and CONCEPT 📚
Fibonacci circles represent an application of Fibonacci principles within technical analysis, extending beyond typical horizontal price levels by incorporating the dimension of time. These geometric constructions traditionally use numerical proportions, often derived from the Fibonacci sequence, to project potential zones of price-time interaction, such as support or resistance. A theoretical understanding of such geometric tools involves considering several core components: the significance of the chosen geometric origin or center point , the mathematical principles governing the proportional scaling of successive radii, and the fundamental calculation considerations (like chart scale adjustments and base radius definitions) that influence the resulting geometry and ensure its accurate representation.
⨀ Circle Center ⨀
The traditional construction methodology for Fibonacci circles begins with the selection of two significant anchor points on the chart, usually representing a key price swing, such as a swing low (Point A) and a subsequent swing high (Point B), or vice versa. This defined segment establishes the primary vector—representing both the price range and the time duration of that specific market move. From these two points, a base distance or radius is derived (this calculation can vary, sometimes using the vertical price distance, the time duration, or the diagonal distance). A center point for the circles is then typically established, often at the midpoint (time and price) between points A and B, or sometimes anchored directly at point B.
Concentric circles are then projected outwards from this center point. The radii of these successive circles are calculated by multiplying the base distance by key Fibonacci ratios and other standard proportions. The underlying concept posits that markets may exhibit harmonic relationships or cyclical behavior that adheres to these proportions, suggesting these expanding geometric zones could highlight areas where future price movements might decelerate, reverse, or find equilibrium, reflecting a potential proportional resonance with the initial defining swing in both price and time.
The Fibonacci Circle Zones indicator enhances traditional Fibonacci circle construction by offering greater analytical depth and flexibility: it addresses the origin point of the circles: instead of being limited to common definitions like the midpoint or endpoint B, this indicator provides a selection of distinct center point calculations relative to the initial A-B swing. The underlying idea is that the geometric source from which harmonic projections emanate might vary depending on the market structure being analyzed. This flexibility allows for experimentation with different center points (derived algorithmically from the A, B, and midpoint coordinates), facilitating exploration of how price interacts with circular zones anchored from various perspectives within the defining swing.
Potential Center Points Setup : This view shows the anchor points A and B , defined by the user, which form the basis of the calculations. The indicator dynamically calculates various potential Center points ( C through N , and X ) based on the A-B structure, representing different geometric origins available for selection in the settings.
Point X holds particular significance as it represents the calculated midpoint (in both time and price) between A and B. This 'X' point corresponds to the default 'Auto' center setting upon initial application of the indicator and aligns with the centering logic used in TradingView's standard Fibonacci Circle tool, offering a familiar starting point.
The other potential center points allow for exploring circles originating from different geometric anchors relative to the A-B structure. While detailing the precise calculation for each is beyond the scope of this overview, they can be broadly categorized: points C through H are derived from relationships primarily within the A-B time/price range, whereas points I through N represent centers projected beyond point B, extrapolating the A-B geometry. Point J, for example, is calculated as a reflection of the A-X midpoint projected beyond B. This variety provides a rich set of options for analyzing circle patterns originating from historical, midpoint, and extrapolated future anchor perspectives.
Default Settings (Center X, FibCircle) : Using the default Center X (calculated midpoint) with the default FibCircle . Although circles begin plotting only after Point B is established, their curvature shows they are geometrically centered on X. This configuration matches the standard TradingView Fib Circle tool, providing a baseline.
Centering on Endpoint B : Using Point B, the user-defined end of the swing, as the Center . This anchors the circular projections directly to the swing's termination point. Unlike centering on the midpoint (X) or start point (A), this focuses the analysis on geometric expansion originating precisely from the conclusion of the measured A-B move.
Projected Center J : Using the projected Point J as the Center . Its position is calculated based on the A-B swing (conceptually, it represents a forward projection related to the A-X midpoint relationship) and is located chronologically beyond Point B. This type of forward projection often allows complete circles to be visualized as price develops into the corresponding time zone.
Time Symmetry Projection (Center L) : Uses the projected Point L as the Center . It is located at the price level of the start point (A), projected forward in time from B by the full duration of the A-B swing . This perspective focuses analysis on temporal symmetry , exploring geometric expansions from a point representing a full time cycle completion anchored back at the swing's origin price level.
⭕ Circle Formula
Beyond the center point , the expansion of the projected circles is determined by the selected Circle Formula . This setting provides different mathematical methods, or scaling options , for scaling the circle radii. Each option applies a distinct mathematical constant or relationship to the base radius derived from the A-B swing, allowing for exploration of various geometric proportions.
eScaled
Mathematical Basis: Scales the radius by Euler's number ( e ≈ 2.718), the base of natural logarithms. This constant appears frequently in processes involving continuous growth or decay.
Enables investigation of market geometry scaled by e , exploring relationships potentially based on natural exponential growth applied to time-price circles, potentially relevant for analyzing phases of accelerating momentum or volatility expansion.
FibCircle
Mathematical Basis: Scales the radius to align with TradingView’s built-in Fibonacci Circle Tool.
Provides a baseline circle size, potentially emulating scaling used in standard drawing tools, serving as a reference point for comparison with other options.
GoldenFib
Mathematical Basis: Scales the radius by the Golden Ratio (φ ≈ 1.618).
Explores the fundamental Golden Ratio proportion, central to Fibonacci analysis, applied directly to circular time-price geometry, potentially highlighting zones reflecting harmonic expansion or retracement patterns often associated with φ.
GoldenContour
Mathematical Basis: Scales the radius by a factor derived from Golden Ratio geometry (√(1 + φ²) / 2 ≈ 0.951). It represents a specific geometric relationship derived from φ.
Allows analysis using proportions linked to the geometry of the Golden Rectangle, scaled to produce circles very close to the initial base radius. This explores structural relationships often associated with natural balance or proportionality observed in Golden Ratio constructions.
SilverRatio
Mathematical Basis: Scales the radius by the Silver Ratio (1 + √2 ≈ 2.414). The Silver Ratio governs relationships in specific regular polygons and recursive sequences.
Allows exploration using the proportions of the Silver Ratio, offering a significant expansion factor based on another fundamental metallic mean for comparison with φ-based methods.
PhiDecay
Mathematical Basis: Scales the radius by φ raised to the power of -φ (φ⁻ᵠ ≈ 0.53). This unique exponentiation explores a less common, non-linear transformation involving φ.
Explores market geometry scaled by this specific phi-derived factor which is significantly less than 1.0, offering a distinct contractile proportion for analysis, potentially relevant for identifying zones related to consolidation phases or decaying momentum.
PhiSquared
Mathematical Basis: Scales the radius by φ squared, normalized by dividing by 3 (φ² / 3 ≈ 0.873).
Enables investigation of patterns related to the φ² relationship (a key Fibonacci extension concept), visualized at a scale just below 1.0 due to normalization. This scaling explores projections commonly associated with significant trend extension targets in linear Fibonacci analysis, adapted here for circular geometry.
PiScaled
Mathematical Basis: Scales the radius by Pi (π ≈ 3.141).
Explores direct scaling by the fundamental circle constant (π), investigating proportions inherent to circular geometry within the market's time-price structure, potentially highlighting areas related to natural market cycles, rotational symmetry, or full-cycle completions.
PlasticNumber
Mathematical Basis: Scales the radius by the Plastic Number (approx 1.3247), the third metallic mean. Like φ and the Silver Ratio, it is the solution to a specific cubic equation and relates to certain geometric forms.
Introduces another distinct fundamental mathematical constant for geometric exploration, comparing market proportions to those potentially governed by the Plastic Number.
SilverFib
Mathematical Basis: Scales the radius by the reciprocal Golden Ratio (1/φ ≈ 0.618).
Explores proportions directly related to the core 0.618 Fibonacci ratio, fundamental within Fibonacci-based geometric analysis, often significant for identifying primary retracement levels or corrective wave structures within a trend.
Unscaled
Mathematical Basis: No scaling applied.
Provides the base circle defined by points A/B and the Center setting without any additional mathematical scaling, serving as a pure geometric reference based on the A-B structure.
🧪 Advanced Calculation Settings
Two advanced settings allow further refinement of the circle calculations: matching the chart's scale and defining how the base radius is calculated from the A-B swing.
The Chart Scale setting ensures geometric accuracy by aligning circle calculations with the chart's vertical axis display. Price charts can use either a standard (linear) or logarithmic scale, where vertical distances represent price changes differently. The setting offers two options:
Standard : Select this option when the price chart's vertical axis is set to a standard linear scale.
Logarithmic : It is necessary to select this option if the price chart's vertical axis is set to a logarithmic scale. Doing so ensures the indicator adjusts its calculations to maintain correct geometric proportions relative to the visual price action on the log-scaled chart.
The Radius Calc setting determines how the fundamental base radius is derived from the A-B swing, offering two primary options:
Auto : This is the default setting and represents the traditional method for radius calculation. This method bases the radius calculation on the vertical price range of the A-B swing, focusing the geometry on the price amplitude.
Geometric : This setting provides an alternative calculation method, determining the base radius from the diagonal distance between Point A and Point B. It considers both the price change and the time duration relative to the chart's aspect ratio, defining the radius based on the overall magnitude of the A-B price-time vector.
This choice allows the resulting circle geometry to be based either purely on the swing's vertical price range ( Auto ) or on its combined price-time movement ( Geometric ).
🖼️ CHART EXAMPLES 🖼️
Default Behavior (X Center, FibCircle Formula) : This configuration uses the midpoint ( Center X) and the FibCircle scaling Formula , representing the indicator's effective default setup when 'Auto' is selected for both options initially. This is designed to match the output of the standard TradingView Fibonacci Circle drawing tool.
Center B with Unscaled Formula : This example shows the indicator applied to an uptrend with the Center set to Point B and the Circle Formula set to Unscaled . This configuration projects the defined levels (0.236, 0.382, etc.) as arcs originating directly from the swing's termination point (B) without applying any additional mathematical scaling from the formulas.
Visualization with Projected Center J : Here, circles are centered on the projected point J, calculated from the A-B structure but located forward in time from point B. Notice how using this forward-projected origin allows complete inner circles to be drawn once price action develops into that zone, providing a distinct visual representation of the expanding geometric field compared to using earlier anchor points. ( Unscaled formula used in this example).
PhiSquared Scaling from Endpoint B : The PhiSquared scaling Formula applied from the user-defined swing endpoint (Point B). Radii expand based on a normalized relationship with φ² (the square of the Golden Ratio), creating a unique geometric structure and spacing between the circle levels compared to other formulas like Unscaled or GoldenFib .
Centering on Swing Origin (Point A) : Illustrates using Point A, the user-defined start of the swing, as the circle Center . Note the significantly larger scale and wider spacing of the resulting circles. This difference occurs because centering on the swing's origin (A) typically leads to a larger base radius calculation compared to using the midpoint (X) or endpoint (B). ( Unscaled formula used).
Center Point D : Point D, dynamically calculated from the A-B swing, is used as the origin ( Center =D). It is specifically located at the price level of the swing's start point (A) occurring precisely at the time coordinate of the swing's end point (B). This offers a unique perspective, anchoring the geometric expansion to the initial price level at the exact moment the defining swing concludes. ( Unscaled formula shown).
Center Point G : Point G, also dynamically calculated from the A-B swing, is used as the origin ( Center =G). It is located at the price level of the swing's endpoint (B) occurring at the time coordinate of the start point (A). This provides the complementary perspective to Point D, anchoring the geometric expansion to the final price level achieved but originating from the moment the swing began . As observed in the example, using Point G typically results in very wide circle projections due to its position relative to the core A-B action. ( Unscaled formula shown).
Center Point I: Half-Duration Projection : Using the dynamically calculated Point I as the Center . Located at Point B's price level but projected forward in time by half the A-B swing duration , Point I's calculated time coordinate often falls outside the initially visible chart area. As the chart progresses, this origin point will appear, revealing large, sweeping arcs representing geometric expansions based on a half-cycle temporal projection from the swing's endpoint price. ( Unscaled formula shown).
Center Point M : Point M, also dynamically calculated from the A-B swing, serves as the origin ( Center =M). It combines the midpoint price level (derived from X) with a time coordinate projected forward from Point B by the full duration of the A-B swing . This perspective anchors the geometric expansion to the swing's balance price level but originates from the completion point of a full temporal cycle relative to the A-B move. Like other projected centers, using M allows for complete circles to be visualized as price progresses into its time zone. ( SilverFib formula shown).
Geometric Validation & Functionality : Comparing the indicator (red lines), using its default settings ( Center X, FibCircle Formula ), against TradingView's standard Fib Circle tool (green lines/white background). The precise alignment, particularly visible at the 1.50 and 2.00 levels shown, validates the core geometry calculation.
🛠️ CONFIGURATION AND SETTINGS 🛠️
The Fibonacci Circle Zones indicator offers a range of configurable settings to tailor its functionality and visual representation. These options allow customization of the circle origin, scaling method, level visibility, visual appearance, and input points.
Center and Formula
Settings for selecting the circle origin and scaling method.
Center : Dropdown menu to select the origin point for the circles.
Auto : Automatically uses point X (the calculated midpoint between A and B).
Selectable points including start/end (A, B), midpoint (X), plus various points derived from or projected beyond the A-B swing (C-N).
Circle Formula : Dropdown menu to select the mathematical method for scaling circle radii.
Auto : Automatically selects a default formula ('FibCircle' if Center is 'X', 'Unscaled' otherwise).
Includes standard Fibonacci scaling ( FibCircle, GoldenFib ), other mathematical constants ( PiScaled, eScaled ), metallic means ( SilverRatio ), phi transformations ( PhiDecay, PhiSquared ), and others.
Fib Levels
Configuration options for the 12 individual Fibonacci levels.
Advanced Settings
Settings related to core calculation methods.
Radius Calc : Defines how the base radius is calculated (e.g., 'Auto' for vertical price range, 'Geometric' for diagonal price-time distance).
Chart Scale : Aligns circle calculations with the chart's vertical axis setting ('Standard' or 'Logarithmic') for accurate visual proportions.
Visual Settings
Settings controlling the visual display of the indicator elements.
Plots : Dropdown controlling which parts of the calculated circles are displayed ( Upper , All , or Lower ).
Labels : Dropdown controlling the display of the numerical level value labels ( All , Left , Right , or None ).
Setup : Dropdown controlling the visibility of the initial setup graphics ( Show or Hide ).
Info : Dropdown controlling the visibility of the small information table ( Show or Hide ).
Text Size : Adjusts the font size for all text elements displayed by the indicator (Value ranges from 0 to 36).
Line Width : Adjusts the width of the circle plots (1-10).
Time/Price
Inputs for the anchor points defining the base swing.
These settings define the start (Point A) and end (Point B) of the price swing used for all calculations.
Point A (Time, Price) : Input fields for the exact time coordinate and price level of the swing's starting point (A).
Point B (Time, Price) : Input fields for the exact time coordinate and price level of the swing's ending point (B).
Interactive Adjustment : Points A and B can typically be adjusted directly by clicking and dragging their markers on the chart (if 'Setup' is set to 'Show'). Changes update settings automatically.
📝 NOTES 📝
Fibonacci circles begin plotting only once the time corresponding to Point B has passed and is confirmed on the chart. While potential center locations might be visible earlier (as shown in the setup graphic), the final circle calculations require the complete geometry of the A-B swing. This approach ensures that as new price bars form, the circles are accurately rendered based on the finalized A-B relationship and the chosen center and scaling.
The indicator's calculations are anchored to user-defined start (A) and end (B) points on the chart. When switching between charts with significantly different price scales (e.g., from an index at 5,000 to a crypto asset at $0.50), it is typically necessary to adjust these anchor points to ensure the circle elements are correctly positioned and scaled.
⚠️ DISCLAIMER ⚠️
The Fibonacci Circle Zones indicator is a visual analysis tool designed to illustrate Fibonacci relationships through geometric constructions incorporating curved lines, providing a structured framework for identifying potential areas of price interaction. Like all technical and visual indicators, these visual representations may visually align with key price zones in hindsight, reflecting observed price dynamics. It is not intended as a predictive or standalone trading signal indicator.
The indicator calculates levels and projections using user-defined anchor points and Fibonacci ratios. While it aims to align with TradingView’s standard Fibonacci circle tool by employing mathematical and geometric formulas, no guarantee is made that its calculations are identical to TradingView's proprietary methods.
🧠 BEYOND THE CODE 🧠
The Fibonacci Circle Zones indicator, like other xxattaxx indicators , is designed with education and community collaboration in mind. Its open-source nature encourages exploration, experimentation, and the development of new Fibonacci and grid calculation indicators and tools. We hope this indicator serves as a framework and a starting point for future Innovation and discussions.

[MAD] Harmonic Wave Fourier AnalysisThis script uses Fourier Analysis with additional postcalculations to draw a plot which displays the Amplitude-Change of the Fouriers
Parameter Settings:
You can set the number of data points to analyze
the period to check for extremes.
Fourier Transform: The script breaks down the time series data into its frequency components using cosine and sine calculations.
Harmonic Analysis: It calculates the strength and phase of each frequency component, producing harmonic waves.
Amplitude Change: It determines the change in amplitude between peaks and troughs for each harmonic.
Latest Value Extraction: The script selects the middle amplitude change as the latest data point.
High/Low Points: Finds the maximum and minimum amplitude changes over a specified period.
Visualization: It plots the latest amplitude change with a color that indicates its value relative to the identified extremes.
splitted by 3 Blue plots (1/3 1/2 2/3 from min to max)
How to trade?
May go for retests to the blue lines after big moves.
See this script as braindump of an idea, so its just a concept :-)

HSupertrendLibrary "HSupertrend"
Supertrend implementation based on harmonic patterns
hsupertrend(zProperties, pProperties, errorPercent, showPatterns, patternColor)
derives supertrend based on harmonic patterns
Parameters:
zProperties : ZigzagProperties containing Zigzag length and source array
pProperties : PatternProperties used for calculation
errorPercent : Error threshold for scanning patterns
showPatterns : Draw identified patterns structure on chart
patternColor : Color of the pattern lines to be drawn
Returns:
ZigzagProperties
ZigzagProperties contains values required for zigzag calculation
Fields:
length : Zigzag length
source : Array containing custom OHLC. If not set, array.from(high, low) is used
PatternProperties
PatternProperties are essential pattern parameters used for calculation of bullish and bearish zones
Fields:
base : Base for calculating entry and stop of pattern. Can be CD, minmax or correction. Default is CD
entryPercent : Distance from D in terms of percent of Base in the direction of pattern
stopPercent : Distance from D in terms of percent of Base in the opposite direction of pattern
useClosePrices : When set uses close price for calculation of supertrend breakout

Adaptive Square Levels (Prev + Curr Month, Configurable)
The Adaptive Square Levels (Configurable Edition) indicator dynamically plots price levels based on perfect squares — a concept derived from harmonic market behavior and geometric scaling.
Each month, the script automatically detects the new monthly open and generates square levels both above and below the opening price.
This version introduces full configurability, allowing traders to adjust how many square levels they want to visualize on either side of the base level. The indicator also visually separates previous and current month levels for easy reference.
⚙️ Features
🔢 User-Configurable Range: Choose how many levels to plot above and below the base level.
🧮 Mathematically Derived Levels: Based on perfect squares up to a user-defined max price.
📅 Monthly Auto-Reset: Automatically refreshes at the start of each new month.
🎨 Color-Coded Levels:
Orange → Major levels (square roots divisible by 3)
Yellow → Regular levels
Star (★) → Base level (nearest to monthly open)
🕰️ Dual Month Display: Shows both current and previous month levels for trend comparison.
💡 How to Use
Add the indicator to any symbol and timeframe (preferably daily or higher).
Adjust:
Max Price Level → The upper bound of your price universe.
Number of Levels Each Side → Controls the density of levels.
Observe how price reacts around these mathematically significant zones.
Use in confluence with your own price action, volume, or support/resistance analysis.
📊 Ideal For
Swing traders analyzing monthly trend reversals
Price structure and geometry enthusiasts
Traders exploring market harmonics or square-of-nine–based frameworks
🧠 Note
The script doesn’t provide buy/sell signals — it offers a structural map of key levels derived from square relationships.
Use it as a visual guide to align entries and exits with natural market geometry.
