YinYang Bar ForecastOverview:
YinYang Bar Forecast is a prediction indicator. It predicts the movement for High, Low, Open and Close for up to 13 bars into the future. We created this Indicator as we felt the TradingView community could benefit from a bar forecast as there wasn’t any currently available.
Our YinYang Bar Forecast is something we plan on continuously working on to better improve it, but at its current state it is still very useful and decently accurate. It features many calculations to derive what it thinks the future bars will hold. Let’s discuss some of the logic behind it:
Each bar has its High, Low, Open and Close calculated individually for highest accuracy. Within these calculations we first check which bar it is we are calculating and base our span back length that we are getting our data from based on the bar index we are generating. This helps us get a Moving Average for this bar index.
We take this MA and we apply our Custom Volume Filter calculation on it, which is essentially us dividing the current bars volume over the average volume in the last ‘Filtered Length’ (Setting) length. We take this decimal and multiply it on our MA and smooth it out with a VWMA.
We take the new Volume Filtered MA and apply a RSI Filter calculation on it. RSI Filter is where we take the difference between the high and low of this bar and we multiply it with an RSI calculation using our Volume Filtered MA. We take the result of that multiplication and either add or subtract it from the Volume Filtered MA based on if close > open. This makes our RSI Filtered MA.
Next, we do an EMA Strength Calculation which is where we check if close > ema(close, ‘EMA Averaged Length’) (Setting). Based on this condition we assign a multiplier that is applied to our RSI Filtered MA. We divide by how many bars we are predicting and add a bit to each predictive bar so that the further we go into the future the stronger the strength is.
Next we check RSI and RSI MA levels and apply multiplications based on its RSI levels and if it is greater than or less than the MA. Also it is affected by if the RSI is <= 30 and >= 70.
Finally we check the MFI and MFI MA levels and like RSI we apply multiplications based on its MFI levels and if it is greater than or less than the MA. It is also affected by if the MFI is <= 30 and >= 70.
Please note the way we calculate this may change in the future, this is just currently what we deemed works best for forecasting the future bars. Also note this script uses MA calculations out of scope for efficiency but there is potential for inconsistencies.
Innately it’s main use is the projection it provides. It only draws the bars for realtime bars and not historical ones, so the best way to backtest it is with TradingView’s Replay Tool.
Well, enough of the logic behind it, let's get to understanding how to use it:
Tutorial:
So unfortunately we aren’t able to plot legit bars/candles into the future so we’ve had to do a bit of a work around using lines and fills. As you can see here we have 4 Lines and 3 Zones:
Lines:
Green: Represents the High
Orange: Represents the Open
Teal: Represents the Close
Red: Represents the Low
Zones:
High Zone: This zone is from either Open or Close to the High and is ALWAYS filled with Green.
Open/Close Zone: This zone is from the Open to the Close and is filled with either Green or Red based on if it's greater than the previous bar (real or forecasted).
Low Zone: This zone is from either Open or Close to the Low and is ALWAYS filled with Red.
As you can see generally the Forecasted bars are generally within strong pivot locations and are a good estimation of what will likely go on. Please note, the WHOLE structure of the prediction can change based on the current bars movements and the way it affects the calculations.
Let's look 1 bar back from the current bar just so we can see what it used to Forecast:
As you can see it has changed quite a bit from the previous bar, but if you look close, we drew horizontal lines around where its projecting the next bar to be (our current realtime bar), if we go back to the live chart:
Its projections were pretty close for the high and low. Generally, right now at least, it does a much better job at predicting the high and low than it does the open and close, however we will do our best to fine tune that in future updates.
Remember, this indicator is not meant to base your trades on, but rather give you a Forecast towards the general direction of the next few bars. Somewhat like weather, the farther the bar (or day for weather), the harder it is to predict. For this reason we recommend you focusing on the first few bars as they are more accurate, but review the further ones as they may help show the trend and the way that pair will move.
We will conclude this tutorial here, hopefully this Predictive Indicator can be of some help and use to you. If you have any questions, comments, ideas or concerns please let us know.
Settings:
Forecast Length: How many bars should we predict into the Future? Max 13
Each Bar Length Multiplier: For each new Forecast bar, how many more bars are averaged? Min 2
VWMA Averaged Length: All Forecast bars are put into a VWMA, what length should we use?
EMA Averaged Length: All Forecast bars are put into a EMA, what length should we use?
Filtered Length: What length should we use for Filtered Volume and RSI?
EMA Strength Length: What length should we use for the EMA Strength
HAPPY TRADING!
Search in scripts for "high low"

HILOCLOP AnalysisThe "HILOCLOP Analysis" indicator is designed to analyze price data based on different conditions and provide insights into market trends and patterns. Let's break down its features and understand its potential usefulness in trading:
Sample Length: The indicator allows the user to specify the sample length, which determines the number of bars or periods considered for the analysis. This parameter can be adjusted to capture short-term or long-term trends and patterns in the market.
Raw Up/Down Analysis: The indicator calculates the number of occurrences where the current price values (high, low, open, close) are higher or lower than their previous values. It provides separate counts for each price component. By visualizing these counts on the chart, traders can identify periods of upward or downward movement in the price data.
HICLOP Analysis: The indicator offers a color scheme option called "HICLOP," which determines the color of the plotted results. If the HICLOP analysis is enabled, the plots representing raw up/down counts will have different colors based on whether the current count is higher or lower than the previous count. This color coding helps traders quickly identify changes in price trends.
Unchecking this Box will Show the general trend.
Raw HICLOP Color Scheme
Trend Color Scheme
Analysis Up vs. Down: The indicator provides an option to analyze instances where all four price components (high, low, open, close) are higher or lower than their respective previous values. This analysis helps traders identify periods of strong upward or downward movement in the market.
Analysis High vs. Low: The indicator compares the number of occurrences where the current high is higher than the previous high and the current low is higher than the previous low. It provides insights into whether the market is experiencing higher highs or higher lows, which can help traders determine the strength of an upward or downward trend.
Analysis Open vs. Close: The indicator compares the number of occurrences where the current close is higher than the previous close and the current open is higher than the previous open. This analysis helps traders assess the relationship between opening and closing prices, providing insights into the strength of buying or selling pressure in the market.
The usefulness of the "HILOCLOP Analysis" indicator in trading depends on the specific trading strategy and the trader's preferences. Here are a few potential use cases:
Trend Identification: By analyzing the raw up/down counts and the HICLOP color scheme, traders can identify trends and changes in price momentum. Increasing raw up counts and corresponding color changes to positive values may indicate an upward trend, while increasing raw down counts and negative color changes may suggest a downward trend.
Confirmation of Breakouts: Traders often look for confirmation of breakouts from key levels or chart patterns. The "Analysis Up V Dn" feature can help identify instances where all four price components simultaneously confirm a breakout, indicating a potentially significant move in the market.
Trend Reversals: The "Analysis High V Low" and "Analysis Open V Close" features can provide insights into potential trend reversals. For example, if there are more higher highs than higher lows, it may indicate a weakening trend, potentially signaling a reversal or a correction.

Volume-based Support & Resistance Zones-V1 By Trade Mastership™ The all-new Support & Resistance Zones indicator, which has been upgraded to offer traders more powerful features and functionality. This innovative indicator identifies high-volume fractal lows or highs to create zones based on the size of the wick for that timeframe's candle. This makes it easy for traders to visualize which price levels are the most significant for either a trend continuation or a reversal when zones are broken and retested.
The original script for this indicator was created by Trade Mastership, with additional modifications by L N Behera. Credit goes to both of them for the majority of the logic behind this script. Since then, the script has been improved with several changes, including:
Changing the default S/R lines from plots to lines, and giving users the option to change between solid, dashed, or dotted lines for both S/R lines
Adding additional timeframes and more options for TF1, beyond the current TF. Now, users have four timeframes to plot S/R zones from
Giving users the option to easily change the line thickness for all S/R lines
Making it easier to change the colors of S/R lines and zones by consolidating the options under settings (rather than under style)
Adding extensions to active SR Zones to extend all the way right
Adding the option to extend or not extend the previous S/R zones up to the next S/R zone
Adding optional timeframe labels to active S/R zones, with left and right options, as well as the option to adjust how far to the right the label is set
Fixing an issue where the higher timeframe S/R zone was not properly starting from the high/low of fractal. Now, any higher timeframe S/R will begin exactly at the High/Low points. Note that this may not work perfectly on stocks, and if a fractal high/low is too many bars in the past, it will revert to a default max bars back to avoid script errors.
Adding a function to prevent S/R zones from lower timeframes displaying while on a higher timeframe. This helps clean up the chart quite a bit.
Creating arrays for each timeframe's boxes and lines so that the number of S/R zones can be controlled for each timeframe and limit memory consumption.
Adding new alert options and customized alert messages
Here's how this indicator works: it looks for fractal highs or fractal lows with volume that pierces above the volume's Moving Average. This moving average value can be modified in the settings for each timeframe. The fractal highs will be confirmed with three successive higher highs followed by two successive lower highs and vice versa for the fractal lows. The zone is created from the fractal high/low and the close of the candle for whatever timeframe you selected. The bigger the zone, the more significant that zone is.
Traders can disable any zone, change the zones to show lines only, and modify all the colors, transparencies, and thickness of lines for all the zones. To create alerts, traders can enable the types of alerts they want for each timeframe in the indicator's settings. After applying changes, right-click on one of the zones on the chart, and click "Add Alert on Vol S/R Zones." You do not need to add a title, as the correct alert messages are already built-in.
The latest update has migrated the script to Pine Script Version 5 and added a higher number of total boxes/lines to show on the chart. It has also increased the max bars count to the maximum Pine Script allows, enabling traders to utilize as many bars as possible when drawing the left side of SR zones that are very far back on the chart. Additionally, the update fixed issues where the indicator would not load on 1 minute and 3-minute charts unless higher timeframe SR zones

Candle Trend Counter [theEccentricTrader]█ OVERVIEW
This indicator counts the number of confirmed candle trend scenarios on any given candlestick chart and displays the statistics in a table, which can be repositioned and resized at the user's discretion.
█ CONCEPTS
Green and Red Candles
• A green candle is one that closes with a high price equal to or above the price it opened.
• A red candle is one that closes with a low price that is lower than the price it opened.
Swing Highs and Swing Lows
• A swing high is a green candle or series of consecutive green candles followed by a single red candle to complete the swing and form the peak.
• A swing low is a red candle or series of consecutive red candles followed by a single green candle to complete the swing and form the trough.
Muti-Part Green and Red Candle Trends
• A multi-part green candle trend begins upon the completion of a swing low and continues until a red candle completes the swing high, with each green candle counted as a part of the trend.
• A multi-part red candle trend begins upon the completion of a swing high and continues until a green candle completes the swing low, with each red candle counted as a part of the trend.
█ FEATURES
Inputs
Start Date
End Date
Position
Text Size
Show Sample Period
Show Plots
Table
The table is colour coded, consists of seven columns and, as many as, thirty-one rows. Blue cells denote the multi-part candle trend scenarios, green cells denote the corresponding green candle trend scenarios and red cells denote the corresponding red candle trend scenarios.
The candle trend scenarios are listed in the first column with their corresponding total counts to the right, in the second column. The last row in column one, displays the sample period which can be adjusted or hidden via indicator settings.
The third column displays the total candle trend scenarios as percentages of total 1-candle trends, or complete swing highs and swing lows. And column four displays the total candle trend scenarios as percentages of the, last, or preceding candle trend part. For example 4-candle trends as a percentage of 3-candle trends. This offers more insight into what might happen next at any given point in time.
Plots
I have added plots as a visual aid to the various candle trend scenarios listed in the table. Green up-arrows, with the number of the trend part, denote green candle trends. Red down-arrows, with the number of the trend part, denote red candle trends.
█ HOW TO USE
This indicator is intended for research purposes, strategy development and strategy optimisation. I hope it will be useful in helping to gain a better understanding of the underlying dynamics at play on any given market and timeframe.
It can, for example, give you an idea of whether the next candle will close higher or lower than it opened, based on the current scenario and what has happened in the past under similar circumstances. Such information can be very useful when conducting top down analysis across multiple timeframes and making strategic decisions.
What you do with these statistics and how far you decide to take your research is entirely up to you, the possibilities are endless.
█ LIMITATIONS
Some higher timeframe candles on tickers with larger lookbacks such as the DXY , do not actually contain all the open, high, low and close (OHLC) data at the beginning of the chart. Instead, they use the close price for open, high and low prices. So, while we can determine whether the close price is higher or lower than the preceding close price, there is no way of knowing what actually happened intra-bar for these candles. And by default candles that close at the same price as the open price, will be counted as green. You can avoid this problem by utilising the sample period filter.
The green and red candle calculations are based solely on differences between open and close prices, as such I have made no attempt to account for green candles that gap lower and close below the close price of the preceding candle, or red candles that gap higher and close above the close price of the preceding candle. I can only recommend using 24-hour markets, if and where possible, as there are far fewer gaps and, generally, more data to work with. Alternatively, you can replace the scenarios with your own logic to account for the gap anomalies, if you are feeling up to the challenge.
It is also worth noting that the sample size will be limited to your Trading View subscription plan. Premium users get 20,000 candles worth of data, pro+ and pro users get 10,000, and basic users get 5,000. If upgrading is currently not an option, you can always keep a rolling tally of the statistics in an excel spreadsheet or something of the like.

Pullback IndicatorThe Pullback Indicator is a technical analysis tool designed to identify pullbacks in the price action of a financial instrument. It is based on the concept that price tends to retrace to a previous level of support or resistance before continuing in the direction of the trend.
The indicator is plotted as a series of triangles above or below the price bars, depending on the type of pullback detected. A green triangle is displayed when a bullish pullback is detected, while a red triangle is displayed for a bearish pullback.
The Pullback Indicator uses Inside Bar Range, this number is a user-defined input that specifies the number of bars to look back for the highest high and lowest low.
The indicator classifies four types of pullbacks:
Swing Low - When the price forms a lower low and a higher low than the previous bar.
Swing High - When the price forms a higher high and a lower high than the previous bar.
High Low Sweep and close below - When the price forms a lower low and a higher low than the previous bar, but the close is below the previous high.
High Low Sweep and close above - When the price forms a higher high and a lower high than the previous bar, but the close is above the previous low.
The Pullback Indicator is best used in conjunction with other technical analysis tools to confirm the direction of the trend and to identify potential entry and exit points.

Inter-Exchanges Crypto Price Spread Clouds (Tartigradia)Display variations in min-max and median values of high, low and close across exchanges. It's a kind of realized volatility indicator, as the idea is that in times of high volatility (high emotions, fear, uncertainty), it's more likely that market inefficiencies will appear for the same asset between different market makers, ie, the price can temporarily differ a lot. This indicator will catch these instants of high differences between exchanges, even if they lasted only an instant (because we use high and low values).
Compared with my other "Inter-Exchanges Crypto Price Spread Deviation" indicator, this one overlays directly on the chart, and offers a different take based on the same premisses. Instead of summarizing volatility via standard deviation, here we display clouds of the range of values that were observed.
A big advantage of this approach is that it can also be used to determine safe stop loss levels, especially the values of percentile rank (i.e., what are the high values that were observed in at least 50% of exchanges?).
Indeed, all price levels are displayed in the indicator's status bar:
green for high values,
red for low values,
aqua for median,
purple for average,
The first two values are max and min values of high across exchanges (in green).
The next two values are max and min of low across exchanges (in red).
The next two values are median (aqua) and average (purple).
The last two values are percentile rank values for high (green) and low (red) respectively.
Another advantage is that the high (green) vs low (red) clouds can be seen as representing the buying or selling pressure respectively across exchanges, and this may in itself provide a signal to know whether one side is winning.
Link to my other complementary indicator:
Compared to other inter-exchanges spread indicators, this one offers two major features:
The symbol automatically adapts to the symbol currently selected in user's chart. Hence, switching between tickers does not require the user to modify any option, everything is dynamically updated behind the scenes.
It's easy to add more exchanges (requires some code editing because PineScript v5 does not allow dynamical request.security() calls).
Limitations/things to know:
History is limited to what the ticker itself display. Ie, even if the exchanges specified in this indicator have more data than the ticker currently displayed in the user's chart, the indicator will show only a timeperiod as long as the chart.
The indicator can manage multiple exchanges of different historical length (ie, some exchanges having more data going way earlier in the past than others), in which case they will simply be ignored from calculations when far back in the past. Hence, you should be aware that the further you go in the past, the less exchanges will have such data, and hence the less accurate the measures will be (because the deviation will be calculated from less sources than more recent bars). This is thanks to how the array.* math functions behave in case of na values, they simply skip them from calculations, contrary to math.* functions.

Band-Zigzag - TrendFollower Strategy [Trendoscope]Strategy Time!!!
Have built this on my earlier published indicator Band-Zigzag-Trend-Follower . This is just one possible implementation of strategy on Band-Based-Zigzag .
🎲 Notes
Experimental prototype. Not financial advise and strategy not guaranteed to make money despite backtest results
Not created or tested for any specific instrument or timeframe
Test and adopt with own risk
🎲 Strategy
This is trend following strategy built based on Bands and Zigzag. Traits of trend following strategies are
Lower win rate (Yes, thats right)
High risk reward (Compensates low win rate)
Higher drawdown
If market is choppy, trend following methods suffer.
The script implements few points to overcome the negatives such as lower win rate and higher drawdown by actively assessing pivots on the direction of trend along. This helps us take regular profits and exit on time during the end of trend. Most of the other concepts are defined and explained in indicator - Band-Zigzag-Trend-Follower and Band-Based-Zigzag
Defining a trend following method is simple. Basic rule of trend following is Buy High and Sell Low (Yes, you heard it right). To explain further - methodology involve finding an established trend which is flying high and join the trend with proper risk and optimal stop. Once you get into the trade, you will not exit unless there is change in the trend. Or in other words, the parameters which you used to define trend has reversed and the trend is not valid anymore.
🎯 Using bands
When price breaks out of upper bands (example, Bollinger Band , Keltener Channel, or Donchian Channel), with a pre determined length and multiplier, we can consider the trend to be bullish and similarly when price breaks down the lower band, we can consider the trend to be bearish .
🎯 Using Pivots
Simple logic using zigzag or pivot points is that when price starts making higher highs and higher lows, we can consider this as uptrend. And when price starts making lower highs and lower lows, we can consider this as downtrend. There are few supertrend implementations I have published in the past based on zigzags and pivot points .
Drawbacks of both of these methods is that there will be too many fluctuations in both cases unless we increase the reference length. And if we increase the reference length, we will have higher drawdown.
🎯 Band Based Zigzag Method
Here we use bands to define our pivot high and pivot low - this makes sure that we are identifying trend only on breakouts as pivots are only formed on breakouts
Our method also includes pivot ratio to cross over 1.0 to be able to consider it as trend. This means, we are waiting for price also to make new high high or lower low before making the decision on trend. But, this helps us ignore smaller pivot movements due to the usage of bands.
I have also implemented few tricks such as sticky bands (Bands will not contract unless there is breakout) and Adaptive Bands (Band will not expand unless price is moving in the direction of band). This makes the trend following method very robust.
To avoid fakeouts, we also use percentB of high/low in comparison with price retracement to define breakout.
🎲 Settings
Settings are fairly simpler and are explained as below. You will find most of the required information in tooltips.

Band-Zigzag Based Trend FollowerWe defined new method to derive zigzag last month - which is called Channel-Based-Zigzag . This script is an example of one of the use case of this method.
🎲 Trend Following
Defining a trend following method is simple. Basic rule of trend following is Buy High and Sell Low (Yes, you heard it right). To explain further - methodology involve finding an established trend which is flying high and join the trend with proper risk and optimal stop. Once you get into the trade, you will not exit unless there is change in the trend. Or in other words, the parameters which you used to define trend has reversed and the trend is not valid anymore.
Few examples are:
🎯 Using bands
When price breaks out of upper bands (example, Bollinger Band, Keltener Channel, or Donchian Channel), with a pre determined length and multiplier, we can consider the trend to be bullish and similarly when price breaks down the lower band, we can consider the trend to be bearish.
Here are few examples where I have used bands for identifying trend
Band-Based-Supertrend
Donchian-Channel-Trend-Filter
🎯 Using Pivots
Simple logic using zigzag or pivot points is that when price starts making higher highs and higher lows, we can consider this as uptrend. And when price starts making lower highs and lower lows, we can consider this as downtrend. There are few supertrend implementations I have published in the past based on zigzags and pivot points.
Adoptive-Supertrend-Pivots
Zigzag-Supertrend
Drawbacks of both of these methods is that there will be too many fluctuations in both cases unless we increase the reference length. And if we increase the reference length, we will have higher drawdown.
🎲 Band Based Zigzag Method
Band Based Zigzag will help overcome these issues by combining both the methods.
Here we use bands to define our pivot high and pivot low - this makes sure that we are identifying trend only on breakouts as pivots are only formed on breakouts.
Our method also includes pivot ratio to cross over 1.0 to be able to consider it as trend. This means, we are waiting for price also to make new high high or lower low before making the decision on trend. But, this helps us ignore smaller pivot movements due to the usage of bands.
I have also implemented few tricks such as sticky bands (Bands will not contract unless there is breakout) and Adaptive Bands (Band will not expand unless price is moving in the direction of band). This makes the trend following method very robust.
To avoid fakeouts, we also use percentB of high/low in comparison with price retracement to define breakout.
🎲 The indicator
The output of indicator is simple and intuitive to understand.
🎯 Trend Criteria
Uptrend when last confirmed pivot is pivot high and has higher retracement ratio than PercentB of High. Else, considered as downtrend.
Downtrend when last confirmed pivot is pivot low and has higher retracement ratio than PercentB of High. Else, considered as uptrend.
🎯 Settings
Settings allow you to select the band type and parameters used for calculating zigzag and then trend. Also has few options to hide the display.

Micro ZigzagMicro zigzag is created based on similar concepts as that of zigzag but by using lower timeframe intra-bar data. The lines join candle's high/low points but also depict how the price movement within the candle happened. That is, if the high of the candle is reached first, pivot from previous candle join the high first and then low and vice versa.
The output can also be viewed as advanced line chart.
🎲 Process
🎯 For every bar identify whether high came first or low by using lower timeframe data.
🎯 If high came before low, add high as high pivot first and then low as low pivot. If otherwise, add low as lower pivot first and then high as higher pivot.
🎯 When adding pivot, check if the last pivot is in the same direction as the new one. If yes, replace existing pivot if the new one goes beyond it. Ignore otherwise.
🎯 If the last pivot is of different direction as that one new one, then simple add the new pivot.

Fair Value Gap [LuxAlgo]Fair value gaps (FVG) highlight imbalances areas between market participants and have become popular amongst technical analysts. The following script aims to display fair value gaps alongside the percentage of filled gaps and the average duration (in bars) before gaps are filled.
Users can be alerted when an FVG is filled using the alerts built into this script.
🔶 USAGE
In practice, FVG's highlight areas of support (bullish FVG) and resistances (bearish FVG). Once a gap is filled, suggesting the end of the imbalance, we can expect the price to reverse.
This approach is more contrarian in nature, users wishing to use a more trend-following approach can use the identification of FVG as direct signals, going long with the identification of a bullish FVG, and short with a bearish FVG.
🔹 Mitigation
By default, the script highlights the areas of only unmitigated FVG's. Users can however highlight the mitigation level of mitigated FVG's, that is the lower extremity of bullish FVG's and the upper extremity of bearish FVG's.
The user can track the evolution of a mitigated FVG's using the "Dynamic" setting.
🔹 Threshold
The gap height can be used to determine the degree of imbalance between buying and selling market participants. Users can filter fair value gaps based on the gap height using the "Threshold %" setting. Using the "Auto" will make use of an automatic threshold, only keeping more volatile FVG's.
🔶 DETAILS
We use the following rules for detecting FVG's in this script:
Bullish FVG
low > high(t-2)
close(t-1) > high(t-2)
(low - high(t-2)) / high(t-2) > threshold
Upper Bullish FVG = low
Lower Bullish FVG = high(t-2)
Bearish FVG
high < low(t-2)
close(t-1) < low(t-2)
(low(t-2) - high) / high < -threshold
Upper Bearish FVG = low(t-2)
Lower Bearish FVG = high
🔶 SETTINGS
Threshold %: Threshold percentage used to filter our FVG's based on their height.
Auto Threshold: Use the cumulative mean of relative FVG heights as threshold.
Unmitigatted Levels: Extent the mitigation level of the number of unmitigated FVG's set by the user.
Mitigation Levels: Show the mitigation levels of mitigated FVG's.
Timeframe : Timeframe of the price data used to detect FVG's.

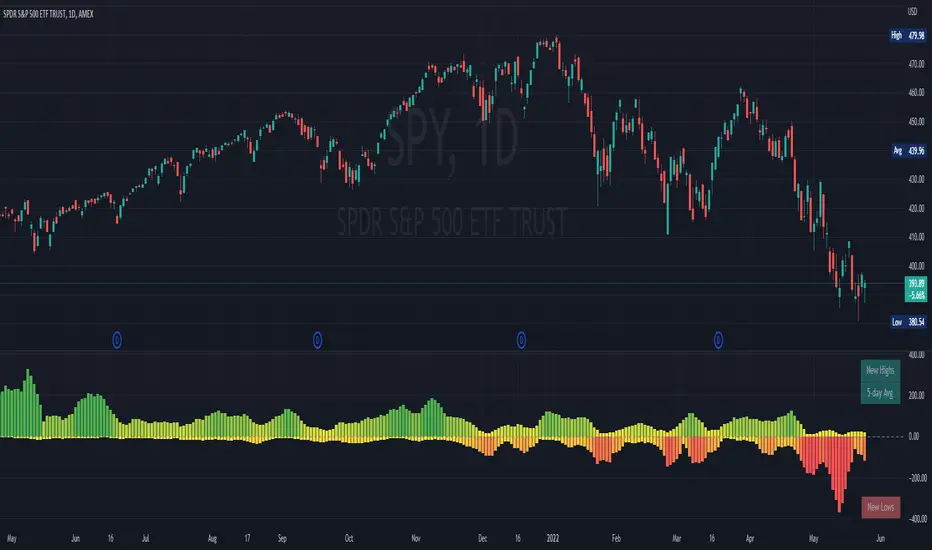
NYSE New Highs vs New LowsNYSE New Highs vs New Lows is a simple market breadth indicator that compares HIGN, the number of new highs during that day, and LOWN, the number of new lows. The new highs are on top and lows are appropriately on bottom. Without averaging, it's a little chaotic so you can smooth them out as much as you want, and the top-right label shows how much you're smoothing.
Interpretation:
Essentially, we use $SPY or $QQQ as a proxy for what's going on in the market, but because the FAANG stocks are so heavily weighted, it's not always representative. If SPY is flat/down, but there are 200 new highs today, then one of the big boys is weighing down an otherwise very bullish market. It's like looking at one of those heatmap charts, but in a single number.
Bullish Trend
- Lots of new highs
- Very few new lows
Bearish Trend
- Lots of new lows
- Very few new highs
Potential Reversal
- Too high, 250+
- Too low, 150+
Volume-based Support & Resistance ZonesThe new and improved Support & Resistance Zones indicator is here. This indicator is based on high volume at fractal lows or fractal highs with the zones based on the size of the wick for that timeframe’s candle.
This helps traders visualize which price levels are of the most significance for either reversals or continuation of the trend when zones are broken and then re-tested.
Original script is thanks to synapticex and additional modifications is thanks to Lij_MC. Credit to both of them for most of the logic behind this script.
Since then I have made many changes to this script as noted below:
Changed default S/R lines from plots to lines, and gave option to user to change between solid line, dashed line, or dotted line for both S/R lines.
Added additional time frame and gave more TF options for TF1 other than current TF. Now you will have 4 time frames to plot S/R zones from.
Gave user option to easily change line thickness for all S/R lines.
Made it easier to change colors of S/R lines and zones by consolidating the options under settings (rather than under style).
Added extensions to active SR Zones to extend all the way right.
Added option to extend or not extend the previous S/R zones up to next S/R zone.
Added optional time frame labels to active S/R zones, with left and right options as well as option to adjust how far to the right label is set.
Fixed issue where the higher time frame S/R zone was not properly starting from the high/low of fractal. Now any higher time frame S/R will begin exactly at the High/Low points. Note that this may not work perfectly on stocks and if a fractal high/low is too many bars in the past, it will revert to a default max bars back to avoid script errors.
Added to script a function that will prevent S/R zones from lower time frames displaying while on a higher time frame. This helps clean up the chart quite a bit.
Created arrays for each time frame's boxes and lines so that the number of S/R zones can be controlled for each time frame and limit memory consumption.
New alert options added and customized alert messages.
- The way this indicator works is it looks for fractal highs or fractal lows with volume that pierces above the volume's Moving Average. This moving average value can be modified in the settings for each time frame.
- The fractal highs will be confirmed with 3 successive higher highs followed by 2 successive lower highs and vice versa for the fractal lows.
- The zone is created from the fractal high/low and the close of the candle for whatever time frame you selected. The bigger the zone, the more significant that zone is.
- You can disable any zone, change the zones to show lines only, and modify all the colors, transparencies, and thickness of lines for all the zones.
- To create alerts, you first want to enable the types of alerts you want for each time frame in the indicator's settings. Then after you apply changes, right click on one of the zones on the chart, and click "Add Alert on Vol S/R Zones". You do not need to add a title as the correct alert messages are already built-in.
- More changes will be coming in the future!
I hope you find this indicator useful, if so please give it a thumbs up!
If you have any suggestions or features you would like to see, just let me know in the comment section. Thanks and enjoy!

Strat Assistant FTC OnlyStrat Assistant FTC Only
----------------------------
█ OVERVIEW
This script is intended to provide full time frame continuity information for almost all time frames (3, 5, 15, 30, 60, 4H, Day, Week, Month, Quarter)
When added, the script provides a visual indicator to the right at the current price level with indicators for the various time frames in terms of price action and candle type.
█ DETAIL
----------
Output
Time Frames: 3min, 5min, 15min, 30min, 60min, 4 Hour, Day, Week, Month Quarter
Time Frame Labels: 3, 5, 15, 30, 60, H, 4H, D, W, M, Q
Current Candle Time Frame Price Action: displayed below time frame labels. RED + Arrow Down (open > close) or GREEN + Arrow Up (open =< close)
Time Frame Compare: displayed above time frame labels. Current high/low vs prior high/low are compared. IN = Inside/Yellow (current high/low inside prior), O = Outside/Fuchsia (current high/low both greater and less than prior high/low), 2U = Up/Green (current high higher than prior, and low not lower), 2D = Down/Red (current lows lower than prior lows, and high not higher)
Will not show time frames lower than the one currently selected
Best Practices
----------
Had to decouple this from the other scripts because Trading View limits how much you can plot/show
May be a little slow at times, analyzing a lot of time periods/data be patient.

MA DerivativesMA Derivatives basicly using Ichimoku Cloud and some additional moving averages for traders.
A. ICHIMOKU
Tenkan-sen (Conversion Line): (9-period high + 9-period low)/2
On a daily chart , this line is the midpoint of the 9-day high-low range, which is almost two weeks.
Kijun-sen (Base Line): (26-period high + 26-period low)/2
On a daily chart , this line is the midpoint of the 26-day high-low range, which is almost one month.
Senkou Span A (Leading Span A): (Conversion Line + Base Line)/2
This is the midpoint between the Conversion Line and the Base Line. The Leading Span A forms one of the two Cloud boundaries. It is referred to as “Leading” because it is plotted 26 periods in the future and forms the faster Cloud boundary.
Senkou Span B (Leading Span B): (52-period high + 52-period low)/2
On the daily chart , this line is the midpoint of the 52-day high-low range, which is a little less than 3 months. The default calculation setting is 52 periods, but it can be adjusted. This value is plotted 26 periods in the future and forms the slower Cloud boundary.
Chikou Span: Represents the closing price and is plotted 26 days back.
Kumo Cloud: Kumo cloud between Senkuo Span A and Senkou Span B lines. It can be green or red. Color can be change with the trend.
You can use Ichimoku for buy&sell strategy
For Buying Strategy
- Tenkansen (Conversion Line) should crossover Kijunsen (Base line) above the highest line of cloud
- Price should be above the highest line of cloud
- Chikouspan should be above the cloud
For Selling Strategy
- Kijunsen (Base Line) should crossover Tenkansen (Conversion Line) below the lowest line of cloud
- Price should be below the lowest line of cloud
- Chikouspan should be below the cloud
B. SIMPLE MOVING AVERAGES
The indicator has some of Simple Moving Averages
It includes:
-Simple Moving Average 50
-Simple Moving Average 100
-Simple Moving Average 200
C. EXPONENTIAL MOVING AVERAGES
The indicator has some of Simple Moving Averages
It includes:
-Exponential Moving Average 9
-Exponential Moving Average 21
-Exponential Moving Average 50
D. BOLLINGER BAND
Bollinger Bands are a type of price envelope developed by John BollingerOpens in a new window. (Price envelopes define upper and lower price range levels.) Bollinger Bands are envelopes plotted at a standard deviation level above and below a simple moving average of the price. Because the distance of the bands is based on standard deviation, they adjust to volatility swings in the underlying price.
Bollinger Bands use 2 parameters, Period and Standard Deviations, StdDev. The default values are 20 for period, and 2 for standard deviations, although you may customize the combinations.
Bollinger bands help determine whether prices are high or low on a relative basis. They are used in pairs, both upper and lower bands and in conjunction with a moving average. Further, the pair of bands is not intended to be used on its own. Use the pair to confirm signals given with other indicators.
How this indicator works
When the bands tighten during a period of low volatility, it raises the likelihood of a sharp price move in either direction. This may begin a trending move. Watch out for a false move in opposite direction which reverses before the proper trend begins.
When the bands separate by an unusual large amount, volatility increases and any existing trend may be ending.
Prices have a tendency to bounce within the bands' envelope, touching one band then moving to the other band. You can use these swings to help identify potential profit targets. For example, if a price bounces off the lower band and then crosses above the moving average, the upper band then becomes the profit target.
Price can exceed or hug a band envelope for prolonged periods during strong trends. On divergence with a momentum oscillator, you may want to do additional research to determine if taking additional profits is appropriate for you.
A strong trend continuation can be expected when the price moves out of the bands. However, if prices move immediately back inside the band, then the suggested strength is negated.
Calculation
First, calculate a simple moving average. Next, calculate the standard deviation over the same number of periods as the simple moving average. For the upper band, add the standard deviation to the moving average. For the lower band, subtract the standard deviation from the moving average.
Typical values used:
Short term: 10 day moving average, bands at 1.5 standard deviations. (1.5 times the standard dev. +/- the SMA)
Medium term: 20 day moving average, bands at 2 standard deviations.
Long term: 50 day moving average, bands at 2.5 standard deviations.
E. ADJUSTABLE MOVING AVERAGES
And this script has also 2 adjustable moving average
- 1 Adjustable Simple Moving Average
- 1 Adjustable Exponential Moving Average
You can just change the length for using this tool.

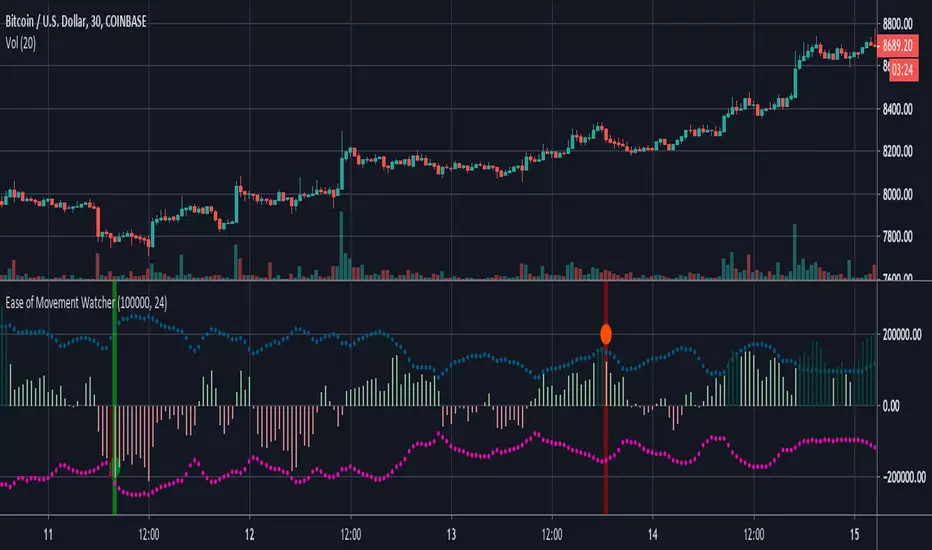
Ease of Movement WatcherHere’s a handy Ease of Movement(EMV) Indicator. I tried to include detailed comments so that anyone that’s learning pine can follow along.
The Ease of Movement Indicator is a volume based oscillator that is designed to measure the ease (or movability) of price movement for a security. The EMV is a centered oscillator, meaning that values can fluctuate above and below zero.
To understand how to use and interpret the EMV Indicator, its crucial to first understand its two main calculations :
Distance Moved = ((high + low) / 2) - ((high + low ) / 2)
-This is the difference between the current period’s midpoint and the previous period’s
midpoint.
Box Ratio = (volume / 100,000) / (high - low)
-When calculating the Box Ratio, it is common to divide the volume by 100,000 for a clearer visualization of the data. However, users can choose
to modify this value with the ‘volumeDiv’ input.
The Ease of Movement Value is then pretty simple to calculate:
EMV = (Distance Moved / Box Ratio)
The indicator then plots a SMA of the previous 24 EMV Values.
Looking at the formula, we know that combining low volume with a large {high, low} range will result in a relatively small box ratio value. Thus, we know that the EMV value for that period will be higher since EMV is found by dividing the Distance Moved by the Box Ratio.
Here’s a simple guide to interpreting the EMV:
- If (EMV > 0)
then price is increasing with relative ease.
-If (EMV < 0)
then price is decreasing with relative ease.
- If high-low range is large and volume is low
then ease of movement is high.
-If high-low range is small and volume is high
then ease of movement is low.
The Chart:
-The histogram represents the Simple Moving Average of EMV Values. The default length is 24, but users can adjust this value at the inputs menu(I've
found 24 works best).
-The teal and pink dotted lines represent the standard deviation of the SMA of EMV values multiplied by 2.5.
-The histogram turns dark green when the EMV SMA is greater than the top teal dotted standard deviations line.
-The histogram turns maroon when the EMV SMA falls below the bottom pink standard deviation line.
How To Use:
Enter a long position when the most recent EMV SMA value was below the lower pink stand. dev. line and the current EMV SMA value rises above that
same pink line. That means the previous bar was maroon and the current bar is not.
If the user enables the option to show entry points, a green dot will be plotted when it is time to enter a long position.
Exit the long position when the most recent EMV SMA value was above the upper green standard deviation line and the current EMV SMA value falls
below that same line. If this is true, then the previous bar will be dark green, and the current will be light green.
If the ‘showExits’ option is enabled, then a red dot will be plotted when it is time to exit the long position.
Input Options:
- 'volumeDiv' : Integer. Used in the calculation of Box Ratio.
- 'lenSMA' : Integer. The length of the Simple Moving Average of Ease of Movement Values.
- 'showStDev' : Bool. If true, dotted green and red lines will be shown at values equal to 2.5 * standard deviation of emvSMA and -2.5 * standard deviation of
emvSMA.
- 'showEntries' and 'showExits' : Bool. If true, a green circle will be plotted at long entry points and a red circle will be plotted at long exit points.
- 'changeBgColor': Bool. If true, the background color will change to green when it is time to enter a long position and red when it is time to exit.
Alerts:
- When it is time to enter a long position, an alert with the message "EMV Tracker - Enter Long" is sent.
- When it is time to exit a long position, an alert with the message "EMV Tracker - Exit Long" is sent.
NOTE:
- I usually use this indicator to confirm signals from other indicators rather than relying on it solely.
- Most accurate signals are generated on 30 minutes with the default input values I've set in the script.
Shoot me a message if you have any ideas for modifications or questions.
~ Happy Trading ~
DR/IDR Break .5 TPDR/IDR Extension Breakout with Custom Stop
This strategy is a systematic, counter-trend, and momentum-based system designed for intraday trading. It operates on the principle of an Opening Range Breakout (ORB), utilizing the initial market consolidation to project high-probability targets, while offering multiple methods for managing risk.
1. Market Identification (The Opening Range)
The strategy begins by defining the market's initial boundaries and volatility:
Session Window: The strategy calculates the Opening Range (OR) over a user-defined time period (default: 9:30 AM to 10:30 AM New York Time).
ORB Levels: Two key price levels are established and locked once the time window closes:
Wick High/Low: The absolute highest and lowest prices of the session. These serve as the entry trigger lines.
Body High/Low (Shaded Range): The highest and lowest open/close prices of the session. The height of this range is used to calculate the Take Profit and Stop Loss levels.
2. Entry Rule (The Breakout)
The strategy is passive until the range is violated, looking for a strong move out of the consolidation area.
Trigger Condition: A trade is signaled when a candle closes either:
Above the Wick High (for a Long entry).
Below the Wick Low (for a Short entry).
Execution: The entry is a Market Order executed on the candle that meets the trigger condition, subject to a user-defined Entry Delay (default 0 bars, meaning the entry is taken immediately upon the breakout candle's close).
Direction Control: The user can select to trade Long Only, Short Only, or Both.
3. Exit and Risk Management
All trades are placed with simultaneous Take Profit and Stop Loss orders (a bracket order) once the entry is filled.
A. Take Profit (TP)
The Take Profit is set at the 0.5 Extension of the Shaded Range (Body Range).
Calculation: The distance from the Body High/Low to the TP level is exactly 50% of the total height of the Shaded Range.
B. Stop Loss (SL)
The Stop Loss is dynamically calculated based on a user-selected method for risk control:
Range 0.5 (Body Range): The Stop Loss is placed an equal distance (0.5 times the Body Range height) outside the opposite side of the Body Range.
Example (Long): If entry is above the Wick High, the SL is set 0.5 times the Body Range height below the Body Low.
ATR Multiple: The Stop Loss distance is determined by the asset's recent volatility.
Calculation: The distance is calculated as a user-defined Multiplier (default 2.0) times the Average True Range (ATR).
Recent Swing Low/High: The Stop Loss is placed based on a structural level defined by recent price action.
Long Entry: SL is placed at the Lowest Swing Low within a user-defined lookback period.
Short Entry: SL is placed at the Highest Swing High within a user-defined lookback period.
Summary of Workflow
The market sets the Wick and Body boundaries (e.g., 9:30–10:30 AM).
Price breaks and closes beyond a Wick boundary, triggering a signal.
The trade enters after the specified delay.
A bracket order is placed: TP is fixed at the 0.5 Extension, and SL is set based on the user's chosen risk method.
The trade is closed upon reaching either the TP or the SL level.

TRZigZagLibLibrary "TRZigZagLib"
method directionName(this)
Gets pivot direction as string
Namespace types: Pivot
Parameters:
this (Pivot) : Pivot instance
Returns: "HIGH" or "LOW"
method isHigh(this)
Checks if pivot is a high
Namespace types: Pivot
Parameters:
this (Pivot) : Pivot instance
Returns: true if pivot is a high
method isLow(this)
Checks if pivot is a low
Namespace types: Pivot
Parameters:
this (Pivot) : Pivot instance
Returns: true if pivot is a low
method newSettings(minLength, minBarSize, maxBarSize)
Creates default ZigZag settings
Namespace types: series int, simple int, input int, const int
Parameters:
minLength (int) : Minimum pivot length (default: 10)
minBarSize (int) : Minimum bars between pivots (default: 5)
maxBarSize (int) : Maximum bars to lookback (default: 300)
Returns: New ZigZagSettings instance
method setLineStyle(this, lineColor, lineWidth, lineStyle)
Sets line appearance
Namespace types: ZigZagSettings
Parameters:
this (ZigZagSettings) : Settings instance
lineColor (color)
lineWidth (int)
lineStyle (string)
Returns: Modified settings instance
method newZigZag(settings, depth)
Creates a new ZigZag instance
Namespace types: ZigZagSettings
Parameters:
settings (ZigZagSettings) : ZigZag settings
depth (int) : Depth value for this ZigZag
Returns: New ZigZag instance
method calculate(this)
Calculates ZigZag using LuxAlgo-style pivot detection
Namespace types: ZigZag
Parameters:
this (ZigZag) : ZigZag instance
method getLastPivots(this, count)
Gets the last N pivots
Namespace types: ZigZag
Parameters:
this (ZigZag) : ZigZag instance
count (int) : Number of pivots to get (default: 5)
Returns: Array of pivots
method getPivot(this, index)
Gets pivot at index
Namespace types: ZigZag
Parameters:
this (ZigZag) : ZigZag instance
index (int) : Index (0 = most recent)
Returns: Pivot or na
method truncate(this, maxBars)
Truncates old pivots beyond lookback window
Namespace types: ZigZag
Parameters:
this (ZigZag) : ZigZag instance
maxBars (int) : Maximum bars to keep
method newMultiZigZag(settings, minDepth, maxDepth, count)
Creates a new MultiZigZag manager
Namespace types: ZigZagSettings
Parameters:
settings (ZigZagSettings) : Base settings for all ZigZags
minDepth (int) : Minimum depth value
maxDepth (int) : Maximum depth value
count (int) : Number of ZigZag instances (max 11)
Returns: New MultiZigZag instance
method calculateAll(this)
Updates all ZigZag instances
Namespace types: MultiZigZag
Parameters:
this (MultiZigZag) : MultiZigZag instance
method getZigZag(this, index)
Gets ZigZag at index
Namespace types: MultiZigZag
Parameters:
this (MultiZigZag) : MultiZigZag instance
index (int) : Index (0 to count-1)
Returns: ZigZag instance or na
method getDepth(this, index)
Gets depth value at index
Namespace types: MultiZigZag
Parameters:
this (MultiZigZag) : MultiZigZag instance
index (int) : Index (0 to count-1)
Returns: Depth value
method size(this)
Gets total number of ZigZag instances
Namespace types: MultiZigZag
Parameters:
this (MultiZigZag) : MultiZigZag instance
Returns: Count of ZigZag instances
method truncateAll(this, maxBars)
Truncates all ZigZag instances
Namespace types: MultiZigZag
Parameters:
this (MultiZigZag) : MultiZigZag instance
maxBars (int) : Maximum bars to keep
method distance(p1, p2)
Calculates distance between two pivots
Namespace types: Pivot
Parameters:
p1 (Pivot) : First pivot
p2 (Pivot) : Second pivot
Returns: Price distance (absolute)
method barSpan(p1, p2)
Calculates bar span between two pivots
Namespace types: Pivot
Parameters:
p1 (Pivot) : First pivot
p2 (Pivot) : Second pivot
Returns: Bar span (absolute)
method isAlternating(pivots)
Checks if pivots are alternating (high-low-high or low-high-low)
Namespace types: array
Parameters:
pivots (array) : Array of pivots
Returns: true if alternating pattern exists
Pivot
Pivot point in the chart
Fields:
d (series int) : Direction: 1=high, -1=low
x (series int) : Bar index
y (series float) : Price
confirmed (series bool) : Pivot confirmation flag
ZigZagSettings
ZigZag configuration settings
Fields:
minLength (series int) : Minimum pivot detection length
minBarSize (series int) : Minimum bars between pivots
maxBarSize (series int) : Maximum bars to lookback
lineColor (series color) : ZigZag line color
lineWidth (series int) : ZigZag line width
lineStyle (series string) : ZigZag line style
ZigZag
Single ZigZag instance
Fields:
settings (ZigZagSettings) : Configuration settings
pivots (array) : Array of pivot points (max 25 for patterns)
lastUpdateBar (series int) : Last bar index when updated
depth (series int) : Current depth value
MultiZigZag
Multi-depth ZigZag manager
Fields:
zigzags (array) : Array of ZigZag instances (max 11)
depthValues (array) : Array of depth values being used
currentBar (series int) : Current bar index being processed

Trend Following $ZEC - Multi-Timeframe Structure Filter + Revers# Trend Following CRYPTOCAP:ZEC - Strategy Guide
## 📊 Strategy Overview
Trend Following CRYPTOCAP:ZEC is an enhanced Turtle Trading system designed for cryptocurrency spot trading, combining Donchian Channel breakouts, multi-timeframe structure filtering, and ATR-based dynamic risk management for both long and short positions.
---
## 🎯 Core Features
1. Multi-Timeframe Structure Filtering
- Uses Swing High/Low to identify market structure
- Customizable structure timeframe (default: 1 minute)
- Only enters trades in the direction of the trend, avoiding counter-trend positions
2. Reverse Signal Exit
- No fixed stop-loss or fixed-period exits
- Exits only when a reverse entry signal triggers
- Maximizes trend profits, reduces premature exits
3. ATR Dynamic Pyramiding
- Adds positions when price moves 0.5 ATR in favorable direction
- Supports up to 2 units maximum (adjustable)
- Pyramid scaling to enhance profitability
4. Complete Risk Management
- Fixed position size (5000 USD per unit)
- Commission fee 0.06% (Binance spot rate)
- Initial capital 10,000 USD
---
## 📈 Trading Logic
Entry Conditions
✅ Long Entry:
- Close price breaks above 20-period high
- Structure trend is bullish (price breaks above Swing High)
✅ Short Entry:
- Close price breaks below 20-period low
- Structure trend is bearish (price breaks below Swing Low)
Add Position Conditions
- Long: Price rises ≥ 0.5 ATR
- Short: Price falls ≥ 0.5 ATR
- Maximum 2 units including initial entry
Exit Conditions
- Long Exit: When short entry signal triggers (price breaks 20-period low + structure turns bearish)
- Short Exit: When long entry signal triggers (price breaks 20-period high + structure turns bullish)
---
## ⚙️ Parameter Settings
Channel Settings
- Entry Channel Period: 20 (Donchian Channel breakout period)
- Exit Channel Period: 10 (reserved parameter, actually uses reverse signal exit)
ATR Settings
- ATR Period: 20
- Stop Loss ATR Multiplier: 2.0 (reserved parameter)
- Add Position ATR Multiplier: 0.5
Structure Filter
- Swing Length: 160 (Swing High/Low calculation period)
- Structure Timeframe: 1 minute (can change to 5/15/60, etc.)
Position Management
- Maximum Units: 2 (including initial entry)
- Capital Per Unit: 5000 USD
---
## 🎨 Visualization Features
Background Colors
- Light Green: Bullish structure
- Light Red: Bearish structure
- Dark Green: Long entry
- Dark Red: Short entry
Optional Display (Default: OFF)
- Entry/exit channel lines
- Structure high/low lines
- ATR stop-loss line
- Next add position indicator
- Entry/exit labels
---
## 📱 Alert Message Format
Strategy sends notifications on entry/exit with the following format:
- Entry: `1m Long EP:428.26`
- Add Position: `15m Add Long 2/2 EP:429.50`
- Exit: `1m Close Long Reverse Signal`
Where:
- `1m`/`15m` = Current chart timeframe
- `EP` = Entry Price
---
## 💰 Backtest Settings
Capital Allocation
- Initial Capital: 10,000 USD
- Per Entry: 5,000 USD (split into 2 entries)
- Leverage: 0x (spot trading)
Trading Costs
- Commission: 0.06% (Binance spot VIP0)
- Slippage: 0
---
## 🎯 Use Cases
✅ Best Scenarios
- Trending markets
- Moderate volatility assets
- 1-minute to 4-hour timeframes
⚠️ Not Suitable For
- Highly volatile choppy markets
- Low liquidity small-cap coins
- Extreme market conditions (black swan events)
---
## 📊 Usage Recommendations
Timeframe Suggestions
| Timeframe | Trading Style | Suggested Parameter Adjustment |
|-----------|--------------|-------------------------------|
| 1-5 min | Scalping | Swing Length 100-160 |
| 15-30 min | Short-term | Swing Length 50-100 |
| 1-4 hour | Swing Trading | Swing Length 20-50 |
Optimization Tips
1. Adjust swing length based on backtest results
2. Different coins may require different parameters
3. Recommend backtesting on 1-minute chart first before live trading
4. Enable labels to observe entry/exit points
---
## ⚠️ Risk Disclaimer
1. Past Performance Does Not Guarantee Future Results
- Backtest data is for reference only
- Live trading may be affected by slippage, delays, etc.
2. Market Condition Changes
- Strategy performs better in trending markets
- May experience frequent stops in ranging markets
3. Capital Management
- Do not invest more than you can afford to lose
- Recommend setting total capital stop-loss threshold
4. Commission Impact
- Frequent trading accumulates commission fees
- Recommend using exchange discounts (BNB fee reduction, etc.)
---
## 🔧 Troubleshooting
Q: No entry signals?
A: Check if structure filter is too strict, adjust swing length or timeframe
Q: Too many labels displayed?
A: Turn off "Show Labels" option in settings
Q: Poor backtest performance?
A:
1. Check if the coin is suitable for trend-following strategies
2. Adjust parameters (swing length, channel period)
3. Try different timeframes
Q: How to set alerts?
A:
1. Click "Alert" in top-right corner of chart
2. Condition: Select "Strategy - Trend Following CRYPTOCAP:ZEC "
3. Choose "Order filled"
4. Set notification method (Webhook/Email/App)
---
## 📞 Contact Information
Strategy Name: Trend Following CRYPTOCAP:ZEC
Version: v1.0
Pine Script Version: v6
Last Updated: December 2025
---
## 📄 Copyright Notice
This strategy is for educational and research purposes only.
All risks of using this strategy for live trading are borne by the user.
Commercial use without authorization is prohibited.
---
## 🎓 Learning Resources
To understand the strategy principles in depth, recommended reading:
- "The Complete TurtleTrader" - Curtis Faith
- "Trend Following" - Michael Covel
- TradingView Pine Script Official Documentation
---
Happy Trading! Remember to manage your risk 📈

Failed 2 + 3→1 & 1→3 & 1 bar Alerts Failed 2 + Enhanced Strength + 3→1 & 1→3 & Inside Bar Alerts (with Dashboard)
This indicator is a strict, rule-based market structure and reversal framework built on The Strat methodology. It detects Failed 2 reversals, compression/expansion sequences (3→1 and 1→3), and confirmed Inside Bars, then grades Failed 2 signals using a multi-factor strength scoring system. A real-time dashboard displays the most recent Failed 2 signal and its strength.
The script is designed for bar-close accuracy, objective signal qualification, and visual clarity, without directional bias baked into the dashboard.
1. Core Signal Types Detected
A. Strict Failed 2 Reversals
Only true, textbook Failed 2 structures are detected. No loose or interpretive logic is used.
Failed 2 Up (F2U)
A bearish reversal following an attempted break higher:
Current bar makes a higher high than the prior bar
Current bar does NOT make a lower low
Close is below the prior bar’s high
Candle closes red (close < open)
Failed 2 Down (F2D)
A bullish reversal following an attempted break lower:
Current bar makes a lower low than the prior bar
Current bar does NOT make a higher high
Close is above the prior bar’s low
Candle closes green (close > open)
These rules ensure the market attempted continuation and failed, which is the defining characteristic of a Failed 2.
B. Inside Bars (IB)
An Inside Bar is defined as:
High is lower than the prior bar’s high
Low is higher than the prior bar’s low
Inside Bars are only confirmed on bar close.
⚠️ Important filtering rule:
Inside Bar labels are NOT displayed if the bar is part of a 3→1 or 1→3 sequence, preventing duplicate or misleading labels.
C. 3→1 and 1→3 Sequences
3→1 Compression
Prior bar is a 3-bar (engulfs the previous bar)
Current bar is an Inside Bar
This represents volatility compression and potential energy build-up.
1→3 Expansion
Prior bar is an Inside Bar
Current bar is a 3-bar
This represents range expansion and initiative activity.
2. Failed 2 Strength Scoring System (0–5 Points)
Each Failed 2 signal is objectively graded using five independent criteria. Each criterion contributes 1 point.
Scoring Components
Rejection Strength
Measures how deeply price rejected back inside the prior bar’s range
Strong rejection = 1 point
Range vs ATR
Current bar range > 75% of ATR
Indicates expansion and participation
Relative Volume
Volume > 1.2× the moving average volume
Confirms real interest, not low-liquidity noise
Wick Dominance
Upper wick dominance for F2U
Lower wick dominance for F2D
Wick must exceed 50% of total candle range
Key Level Proximity
Close is within a configurable percentage of:
Prior High (for F2U)
Prior Low (for F2D)
Strength Tiers
0–2 points → Weak
3 points → Strong
4–5 points → Very Strong
Strength is displayed both visually on the chart and numerically in the dashboard.
3. Visual Labels
Failed 2 Labels
Displayed only when enabled:
F2U / F2D → Weak
F2U! / F2D! → Strong
F2U!! / F2D!! → Very Strong
Color intensity increases with strength:
Red tones for Failed 2 Up
Green tones for Failed 2 Down
Labels are positioned:
Above the bar for F2U
Below the bar for F2D
Sequence Labels
3→1: Green label below the bar
1→3: Orange label above the bar
Inside Bar Label
Label text: IB
Only shown on confirmed close
Only shown if not part of a sequence
Small, unobtrusive visual style
4. Alerts (Bar-Close Accurate)
The indicator provides four independent alert conditions:
Strict Failed 2
Triggers on bar close
Fires for either F2U or F2D
3→1 Sequence
Compression detected on bar close
1→3 Sequence
Expansion detected on bar close
Inside Bar
Confirmed Inside Bar on bar close
All alerts are non-repainting and designed for automation or discretionary execution.
5. Dashboard (Signal Memory System)
The dashboard provides context continuity beyond the signal bar itself.
What It Displays
Current Bar Signal
F2U, F2D, or “none”
Strength
Numeric score (e.g., 4/5)
Persists after the signal
Sequence
3→1, 1→3, or none
Persistence Logic
When a Failed 2 occurs:
Strength and direction are stored
They remain visible for a configurable number of minutes (default: 2)
This allows traders to:
Enter on pullbacks
Maintain context after the signal bar closes
Customization
Toggle dashboard on/off
Choose screen corner placement
Custom text color
⚠️ The dashboard is neutral:
It does not infer bias
It only reports factual, most-recent structure
6. Inputs Summary
Toggle labels for:
Failed 2
Sequences
Inside Bars
ATR length for strength normalization
Volume average length
Key level proximity threshold
Strength persistence duration (minutes)
Dashboard visibility and positioning

FVG Maxing - Fair Value Gaps, Equilibrium, and Candle Patterns
What this script does
This open-source indicator highlights 3-candle fair value gaps (FVGs) on the active chart timeframe, draws their midpoint ("equilibrium") line, tracks when each gap is mitigated, and optionally marks simple candle patterns (engulfing and doji) for confluence. It is intended as an educational tool to study how price interacts with imbalances.
3-candle bullish and bearish FVG zones drawn as forward-extending boxes.
Equilibrium line at 50% of each gap.
Different styling for mitigated vs unmitigated gaps.
Compact statistics panel showing how many gaps are currently active and filled.
Optional overlays for bullish/bearish engulfing patterns and doji candles.
1. FVG logic (3-candle gaps)
The script focuses on a strict 3-candle definition of a fair value gap:
Three consecutive candles with the same body direction.
The wick of candle 3 is separated from the wick of candle 1 (no overlap).
A bullish gap is created when price moves up fast enough to leave a gap between candle 1 and 3. A bearish gap is the mirror case to the downside.
In Pine, the core detection looks like this:
// Three candles with the same body direction
bull_seq = close > open and close > open and close > open
bear_seq = close < open and close < open and close < open
// Wick gap between candle 1 and candle 3
bull_gap = bull_seq and low > high
bear_gap = bear_seq and high < low
// Final FVG flags
is_bull_fvg = bull_gap
is_bear_fvg = bear_gap
For each detected FVG:
Bullish FVG range: from high up to low (gap below current price).
Bearish FVG range: from low down to high (gap above current price).
Each zone is stored in a custom FVGData structure so it can be updated when price later trades back inside it.
2. Equilibrium line (0.5 of the gap)
Every FVG box gets an optional equilibrium line plotted at the midpoint between its top and bottom:
eq_level = (top + bottom) / 2.0
right_index = extend_boxes ? bar_index + extend_length_bars : bar_index
bx = box.new(bar_index - 2, top, right_index, bottom)
eq_ln = line.new(bar_index - 2, eq_level, right_index, eq_level)
line.set_style(eq_ln, line.style_dashed)
line.set_color(eq_ln, eq_color)
You can use this line as a neutral “fair value” reference inside the zone, or as a simple way to think in terms of premium/discount within each gap.
3. Mitigation rules and styling
Each FVG stays active until price trades back into the gap:
Bullish FVG is considered mitigated when the low touches or moves below the top of the gap.
Bearish FVG is considered mitigated when the high touches or moves above the bottom of the gap.
When that happens, the script:
Marks the internal FVGData entry as mitigated.
Softens the box fill and border colors.
Optionally updates the label text from "BULL EQ / BEAR EQ" to "BULL FILLED / BEAR FILLED".
Can hide mitigated zones almost completely if you only want to see unfilled imbalances.
This allows you to distinguish between current areas of interest and zones that have already been traded through.
4. Candle pattern overlays (engulfing and doji)
For additional confluence, the script can mark simple candle patterns on top of the FVG view:
Bullish engulfing — current candle body fully wraps the previous bearish body and is larger in size.
Bearish engulfing — current candle body fully wraps the previous bullish body and is larger in size.
Doji — candles where the real body is small relative to the full range (high–low).
The detection is based on basic body and range geometry:
curr_body = math.abs(close - open)
prev_body = math.abs(close - open )
curr_range = high - low
body_ratio = curr_range > 0 ? curr_body / curr_range : 1.0
bull_engulfing = close > open and close < open and open <= close and close >= open and curr_body > prev_body
bear_engulfing = close < open and close > open and open >= close and close <= open and curr_body > prev_body
is_doji = curr_range > 0 and body_ratio <= doji_body_ratio
On the chart, they appear as:
Small triangle markers below bullish engulfing candles.
Small triangle markers above bearish engulfing candles.
Small circles above doji candles.
All three overlays are optional and can be turned on or off and recolored in the CANDLE PATTERNS group of inputs.
5. Inputs overview
The script organizes settings into clear groups:
DISPLAY SETTINGS : Show bullish/bearish FVGs, show/hide mitigated zones, box extension length, box border width, and maximum number of boxes.
EQUILIBRIUM : Toggle equilibrium lines, color, and line width.
LABELS : Enable labels, choose whether to label unmitigated and/or mitigated zones, and select label size.
BULLISH COLORS / BEARISH COLORS : Separate fill and border colors for bullish and bearish gaps.
MITIGATED STYLE : Opacity used when a gap is marked as mitigated.
STATISTICS : Toggle the on-chart FVG statistics panel.
CANDLE PATTERNS : Show engulfing patterns, show dojis, colors, and the body-to-range threshold that defines a doji.
6. Statistics panel
An optional table in the corner of the chart summarizes the current state of all tracked gaps:
Total number of FVGs still being tracked.
Number of bullish vs bearish FVGs.
Number of unfilled vs mitigated FVGs.
Simple fill rate: percentage of tracked FVGs that have been marked as mitigated.
This can help you study how a particular market tends to treat gaps over time.
7. How you might use it (examples)
These are usage ideas only, not recommendations:
Study how often your symbol mitigates gaps and where inside the zone price tends to react.
Use higher-timeframe context and then refine entries near the equilibrium line on your trading timeframe.
Combine FVG zones with basic candle patterns (engulfing/doji) as an extra visual anchor, if that fits your process.
Hope you enjoy, give your feedback in the comments!
- officialjackofalltrades

Session Candle Hunter 🎯🎯 Session Candle Hunter — Precision Session Mapping for Smart Traders
Session Candle Hunter 🎯 is a powerful tool designed to help traders identify and track the most important session candle of the trading day—commonly used for liquidity grabs, range mapping, volatility zones, and breakout anticipation.
Whether you trade NY session, London session, or custom time windows, this indicator automatically detects the candle at your chosen New York Time, extracts its high and low, and visually projects these levels into the current session.
🔍 What This Indicator Does
1️⃣ Detects the Key Session Candle
You select:
Hour of the candle (NY Time)
Candle timeframe (1H, 4H, 15m, etc.)
The script automatically:
Identifies the candle when it forms
Stores its High/Low
Prepares levels for visual projection
🎨 2️⃣ Highlights the Candle Zone
Optionally displays a colored zone (box) between the candle’s high and low:
Helps visualize the liquidity pocket
Useful for session traps, expansion moves, and fair value interpretation
You can choose:
Zone color
Whether to show it or not
Whether it should update only for the latest candle
📈 3️⃣ Draws High/Low Lines With Extensions
High and Low of the detected candle can be plotted as:
Standard lines
Or infinitely extended to the right
Great for identifying:
Breakouts
Retests
Range boundaries
Session expansion models
Optional labels display exact price levels.
🕐 4️⃣ Delayed Display Logic
The indicator only shows levels after a user-defined NY time.
For example:
Show lines only after 8:30 NY — perfect for traders who want pre-session levels hidden until relevant.
🔄 5️⃣ “Show Only Last” Mode
A clean, uncluttered mode that removes all historical drawings and only displays:
The latest zone
The latest high/low lines
Latest labels
Perfect for minimal-chart traders.
⚠️ 6️⃣ Alert System
Receive alerts the moment the targeted session candle forms:
“New Candle Detected”
🧾 7️⃣ Info Panel (Top-Left Corner)
Displays:
Target session hour
Display start time
Candle timeframe
Stored High/Low
Indicator name
Always visible and automatically updates.
⭐ Why Traders Love This Tool
✔ Helps visualize major liquidity zones
✔ Works on all markets & timeframes
✔ Perfect for ICT-style session concepts
✔ Helps anticipate session expansion
✔ Automates manual level drawing
✔ Clean visuals with optional minimal mode

BB Breakout-Momentum + Reversion Strategies# BB Breakout-Momentum + Reversion Strategies
## Overview
This indicator combines two complementary Bollinger Band trading strategies that automatically adapt to market conditions. Strategy 1 capitalizes on trending markets with breakout-pullback-momentum setups, while Strategy 2 exploits mean reversion in ranging markets. Advanced filtering using ADX and BB Width ensures each strategy only fires in its optimal market environment.
---
## Strategy 1: Breakout → Pullback → Renewed Momentum (Long B / Short B)
### Best Market Conditions
- **Trending Markets**: ADX ≥ 25
- **High Volatility**: BB Width ≥ 1.0× average
- Directional price action with sustained momentum
### Entry Logic
**Long B (Bullish Breakout):**
1. **Initial Breakout**: Price breaks above upper Bollinger Band with strong momentum
2. **Controlled Pullback**: Price pulls back 1-12 bars but holds above lower band (stays in trend)
3. **Defended Zone**: Pullback creates a support zone based on swing lows (validated by multiple touches)
4. **Renewed Momentum**: Price reclaims with green candle, volume confirmation, bullish MACD
5. **Position Check**: Entry must have cushion below upper band and room to reach targets
**Short B (Bearish Breakdown):**
- Mirror logic for downtrends: breakdown below lower band, pullback stays below upper band, renewed selling pressure
### Risk Management
- **Stop Loss**: Lower of (zone floor/previous low) OR (1.5 × ATR from entry)
- **Targets**:
- T1: Entry + 0.85R (0.85 × 1.5 ATR)
- T2: Entry + 1.40R (1.40 × 1.5 ATR)
- T3: Entry + 2.50R (2.50 × 1.5 ATR)
- T4: Entry + 4.50R (4.50 × 1.5 ATR)
- Risk is calculated using ATR (ATRX = 1.5 ATR), stop uses tighter of structural level (ATRL) or ATRX
---
## Strategy 2: Bollinger Band Mean Reversion (Long R / Short R)
### Best Market Conditions
- **Ranging Markets**: ADX ≤ 20
- **Low Volatility**: BB Width ≤ 0.8× average
- Price oscillating around the mean without sustained trend
### Entry Logic
**Long R (Long Reversion):**
1. **Overextension**: Price breaks below lower Bollinger Band (2 consecutive closes)
2. **Snap Back**: Price crosses back above lower band (re-enters the range)
3. **Entry Window**: Within 2 candles of re-entry, look for:
- **Green candle** (close > open) confirming bullish strength
- Close above previous candle (close > close )
4. **Trigger**: First qualifying candle within 2-bar window executes the trade
**Short R (Short Reversion):**
1. **Overextension**: Price breaks above upper Bollinger Band (2 consecutive closes)
2. **Snap Back**: Price crosses back below upper band (re-enters the range)
3. **Entry Window**: Within 2 candles of re-entry, look for:
- **Red candle** (close < open) confirming bearish pressure
- Close below previous candle (close < close )
4. **Trigger**: First qualifying candle within 2-bar window executes the trade
### Risk Management
- **Stop Loss**: Lower of (previous high/low) OR (1.5 × ATR from entry)
- **Targets**: Same as Strategy 1 (0.85R, 1.4R, 2.5R, 4.5R based on 1.5 ATR)
- Betting on return to Bollinger Band basis (mean)
---
## Advanced Filtering System
### ADX Filter (Average Directional Index)
- **Purpose**: Measures trend strength vs choppy/ranging conditions
- **Trending**: ADX ≥ 25 → Enables Strategy 1 (Breakout)
- **Ranging**: ADX ≤ 20 → Enables Strategy 2 (Reversion)
- **Neutral**: ADX 20-25 → No signals (indecisive market)
### BB Width Filter
- **Purpose**: Confirms volatility expansion/contraction
- **Wide Bands**: Current width ≥ 1.0× 50-bar average → Trending environment
- **Narrow Bands**: Current width ≤ 0.8× 50-bar average → Ranging environment
- **Logic**: Both ADX and BB Width must agree on market state before signaling
### Combined Logic
- **Strategy 1 fires**: When BOTH ADX shows trending AND bands are wide
- **Strategy 2 fires**: When BOTH ADX shows ranging AND bands are narrow
- **Visual Display**: Table at bottom-right shows ADX value, BB Width ratio, and current market state
---
## Visual Elements
### Bollinger Bands
- **Gray line**: 20-period SMA (basis/mean)
- **Green line**: Upper band (basis + 2 standard deviations)
- **Red line**: Lower band (basis - 2 standard deviations)
### Strategy 1 Markers
- **Long B**: Green triangle below bar with "Long B" text
- **Short B**: Orange triangle above bar with "Short B" text
- **Defended Zones**: Green/red boxes showing pullback support/resistance areas
- **Targets**: Green/orange crosses showing T1-T4 and stop loss levels
### Strategy 2 Markers
- **Long R**: Blue label below bar with "Long R" text
- **Short R**: Purple label above bar with "Short R" text
- **Trade Levels**: Horizontal lines extending 50 bars forward
- Blue solid = Entry price
- Red dashed = Stop loss
- Green/Orange dotted = Targets (T1-T4)
### Market State Table
- **ADX**: Current value with color coding (green=trending, orange=ranging, gray=neutral)
- **BB Width**: Ratio vs 50-bar average (e.g., "1.15x" = 15% wider than average)
- **State**: TREND / RANGE / NEUTRAL classification
---
## Settings & Customization
### Bollinger Bands
- **BB Length**: 20 (default) - period for moving average
- **BB Std Dev**: 2.0 (default) - standard deviation multiplier
### ATR & Risk
- **ATR Length**: 14 (default) - period for Average True Range calculation
- All stop losses and targets are derived from 1.5 × ATR
### Trend/Range Filters
- **ADX Length**: 14 (default)
- **ADX Trending Threshold**: 25 (higher = stronger trend required)
- **ADX Ranging Threshold**: 20 (lower = tighter ranging condition)
- **BB Width Average Length**: 50 (period for comparing current width)
- **BB Width Trend Multiplier**: 1.0 (width must be ≥ this × average)
- **BB Width Range Multiplier**: 0.8 (width must be ≤ this × average)
- **Use ADX Filter**: Toggle on/off
- **Use BB Width Filter**: Toggle on/off
### Strategy 1 (Breakout-Momentum)
- **Breakout Lookback**: 15 bars (how far back to search for initial breakout)
- **Min Pullback Bars**: 1 (minimum consolidation period)
- **Max Pullback Bars**: 12 (maximum consolidation period)
- **Show Defended Zone**: Display support/resistance boxes
- **Show Signals**: Display Long B / Short B markers
- **Show Targets**: Display stop loss and target levels
### Strategy 2 (Reversion)
- **Show Signals**: Display Long R / Short R markers
- **Show Trade Levels**: Display entry, stop, and target lines
---
## How to Use This Indicator
### Step 1: Identify Market State
- Check the table in bottom-right corner
- **TREND**: Look for Strategy 1 signals (Long B / Short B)
- **RANGE**: Look for Strategy 2 signals (Long R / Short R)
- **NEUTRAL**: Wait for clearer conditions
### Step 2: Wait for Signal
- Signals only fire when ALL conditions are met (structural + momentum + filters + room-to-target)
- Signals are relatively rare but high-probability
### Step 3: Execute Trade
- **Entry**: Close of signal candle
- **Stop Loss**: Shown as red cross (Strategy 1) or red dashed line (Strategy 2)
- **Targets**: Scale out at T1, T2, T3, T4 or hold for maximum R:R
### Step 4: Management
- Consider moving stop to breakeven after T1
- Trail stop using swing lows/highs in Strategy 1
- Exit full position at T2-T3 in Strategy 2 (mean reversion has limited upside)
---
## Key Principles
### Why This Works
1. **Market Adaptation**: Uses right strategy for right conditions (trend vs range)
2. **Confluence**: Multiple confirmations required (structure + momentum + volatility + room)
3. **Risk-Defined**: Every trade has pre-calculated stop and targets based on ATR
4. **Probability**: Filters reduce noise and increase win rate by waiting for ideal setups
### Common Pitfalls to Avoid
- ❌ Taking signals in NEUTRAL market state (indicators disagree)
- ❌ Overriding the stop loss (it's calculated for a reason)
- ❌ Expecting signals on every swing (quality over quantity)
- ❌ Using Strategy 1 in ranging markets or Strategy 2 in trending markets
- ❌ Ignoring the room-to-target check (signal won't fire if targets are blocked)
### Complementary Analysis
This indicator works best when combined with:
- Higher timeframe trend analysis
- Key support/resistance levels
- Volume analysis
- Market structure (swing highs/lows)
- Risk management rules (position sizing, max daily loss, etc.)
---
## Technical Details
### Indicators Used
- **Bollinger Bands**: 20-period SMA ± 2 standard deviations
- **ATR**: 14-period Average True Range for volatility measurement
- **ADX**: 14-period Average Directional Index for trend strength
- **EMA**: 10 and 20-period exponential moving averages (Strategy 1 filter)
- **MACD**: 12/26/9 settings (Strategy 1 momentum confirmation)
- **Volume**: Compared to 15-bar average (Strategy 1 confirmation)
### Calculation Methodology
- **ATRL** (Structural Risk): Previous swing high/low or defended zone boundary
- **ATRX** (ATR Risk): 1.5 × 14-period ATR from entry price
- **Stop Loss**: Minimum of ATRL and ATRX (tightest protection)
- **Targets**: Always calculated from ATRX (consistent R-multiples)
- **BB Width Ratio**: Current BB width ÷ 50-period SMA of BB width
---
## Performance Notes
### Strengths
- Adapts to changing market conditions automatically
- Clear, objective entry and exit criteria
- Pre-defined risk on every trade
- Filters reduce false signals significantly
- Works across multiple timeframes and instruments
### Limitations
- Signals are infrequent (by design - quality over quantity)
- Requires patience to wait for all conditions to align
- May miss explosive moves if pullback doesn't form properly (Strategy 1)
- Ranging markets can transition to trending (Strategy 2 risk)
- Filters may delay entry in fast-moving markets
### Best Timeframes
- **Strategy 1**: 1H, 4H, Daily (needs time for proper pullback structure)
- **Strategy 2**: 15M, 30M, 1H (mean reversion works best intraday)
- Both strategies can work on any timeframe if market conditions are right
### Best Instruments
- **Liquid markets**: Major stocks, indices, forex pairs, liquid crypto
- **Sufficient volatility**: ATR should be meaningful relative to price
- **Clear trend/range cycles**: Markets that respect technical levels
---
## IMPORTANT DISCLAIMER
### Risk Warning
**TRADING INVOLVES SUBSTANTIAL RISK OF LOSS AND IS NOT SUITABLE FOR ALL INVESTORS.**
This indicator is provided for **educational and informational purposes only**. It does not constitute financial advice, investment advice, trading advice, or any other sort of advice. You should not treat any of the indicator's content as such.
### No Guarantee of Profit
Past performance is not indicative of future results. No trading strategy, including this indicator, can guarantee profits or protect against losses. The market is inherently unpredictable and all trading involves risk.
### User Responsibility
- **Do Your Own Research**: Always conduct your own analysis before making trading decisions
- **Test First**: Backtest and paper trade this strategy before risking real capital
- **Risk Management**: Never risk more than you can afford to lose
- **Position Sizing**: Use appropriate position sizes relative to your account
- **Stop Losses**: Always use stop losses and respect them
- **Market Conditions**: Understand that market conditions change and past behavior may not repeat
### No Liability
The creator of this indicator accepts no liability for any financial losses incurred through the use of this tool. All trading decisions are made at your own risk. You are solely responsible for evaluating the merits and risks associated with the use of any trading systems, signals, or content provided.
### Not Financial Advice
This indicator does not take into account your personal financial situation, investment objectives, risk tolerance, or specific needs. You should consult with a licensed financial advisor before making any investment decisions.
### Technical Limitations
- Indicators can repaint or lag in real-time
- Past signals may look different than real-time signals
- Code bugs or errors may exist despite testing
- TradingView platform limitations may affect functionality
### Market Risks
- Markets can gap, causing stops to be executed at worse prices
- Slippage and commissions can significantly impact results
- High volatility can cause unexpected losses
- Counterparty risk exists in all leveraged products
---
## Version History
- **v1.0**: Initial release combining breakout-momentum and mean reversion strategies
- Includes ADX and BB Width filtering
- ATRL/ATRX risk calculation system
- 2-candle entry window for reversion trades
---
## Credits & License
This indicator combines concepts from classical technical analysis including Bollinger Bands (John Bollinger), ATR (Welles Wilder), and ADX (Welles Wilder). The specific implementation and combination of filters is original work.
**Use at your own risk. Trade responsibly.**
---
*For questions, suggestions, or to report bugs, please comment below or contact the author.*
**Remember: The best indicator is the one between your ears. Use this tool as part of a comprehensive trading plan, not as a standalone solution.**

BAY_PIVOT S/R(4 Full Lines + ALL Labels)//@version=5
indicator("BAY_PIVOT S/R(4 Full Lines + ALL Labels)", overlay=true, max_labels_count=500, max_lines_count=500)
// ────────────────────── TOGGLES ──────────────────────
showPivot = input.bool(true, "Show Pivot (Full Line + Label)")
showTarget = input.bool(true, "Show Target (Full Line + Label)")
showLast = input.bool(true, "Show Last Close (Full Line + Label)")
showPrevClose = input.bool(true, "Show Previous Close (Full Line + Label)")
useBarchartLast = input.bool(true, "Use Barchart 'Last' (Settlement Price)")
showR1R2R3 = input.bool(true, "Show R1 • R2 • R3")
showS1S2S3 = input.bool(true, "Show S1 • S2 • S3")
showStdDev = input.bool(true, "Show ±1σ ±2σ ±3σ")
showFib4W = input.bool(true, "Show 4-Week Fibs")
showFib13W = input.bool(true, "Show 13-Week Fibs")
showMonthHL = input.bool(true, "Show 1M High / Low")
showEntry1 = input.bool(false, "Show Manual Entry 1")
showEntry2 = input.bool(false, "Show Manual Entry 2")
entry1 = input.float(0.0, "Manual Entry 1", step=0.25)
entry2 = input.float(0.0, "Manual Entry 2", step=0.25)
stdLen = input.int(20, "StdDev Length", minval=1)
fib4wBars = input.int(20, "4W Fib Lookback")
fib13wBars = input.int(65, "13W Fib Lookback")
// ────────────────────── DAILY CALCULATIONS ──────────────────────
high_y = request.security(syminfo.tickerid, "D", high , lookahead=barmerge.lookahead_on)
low_y = request.security(syminfo.tickerid, "D", low , lookahead=barmerge.lookahead_on)
close_y = request.security(syminfo.tickerid, "D", close , lookahead=barmerge.lookahead_on)
pivot = (high_y + low_y + close_y) / 3
r1 = pivot + 0.382 * (high_y - low_y)
r2 = pivot + 0.618 * (high_y - low_y)
r3 = pivot + (high_y - low_y)
s1 = pivot - 0.382 * (high_y - low_y)
s2 = pivot - 0.618 * (high_y - low_y)
s3 = pivot - (high_y - low_y)
prevClose = close_y
last = useBarchartLast ? request.security(syminfo.tickerid, "D", close , lookahead=barmerge.lookahead_off) : close
target = pivot + (pivot - prevClose)
// StdDev + Fibs + Monthly (unchanged)
basis = ta.sma(close, stdLen)
dev = ta.stdev(close, stdLen)
stdRes1 = basis + dev
stdRes2 = basis + dev*2
stdRes3 = basis + dev*3
stdSup1 = basis - dev
stdSup2 = basis - dev*2
stdSup3 = basis - dev*3
high4w = ta.highest(high, fib4wBars)
low4w = ta.lowest(low, fib4wBars)
fib382_4w = high4w - (high4w - low4w) * 0.382
fib50_4w = high4w - (high4w - low4w) * 0.500
high13w = ta.highest(high, fib13wBars)
low13w = ta.lowest(low, fib13wBars)
fib382_13w_high = high13w - (high13w - low13w) * 0.382
fib50_13w = high13w - (high13w - low13w) * 0.500
fib382_13w_low = low13w + (high13w - low13w) * 0.382
monthHigh = ta.highest(high, 30)
monthLow = ta.lowest(low, 30)
// ────────────────────── COLORS ──────────────────────
colRed = color.rgb(255,0,0)
colLime = color.rgb(0,255,0)
colYellow = color.rgb(255,255,0)
colOrange = color.rgb(255,165,0)
colWhite = color.rgb(255,255,255)
colGray = color.rgb(128,128,128)
colMagenta = color.rgb(255,0,255)
colPink = color.rgb(233,30,99)
colCyan = color.rgb(0,188,212)
colBlue = color.rgb(0,122,255)
colPurple = color.rgb(128,0,128)
colRed50 = color.new(colRed,50)
colGreen50 = color.new(colLime,50)
// ────────────────────── 4 KEY FULL LINES ──────────────────────
plot(showPivot ? pivot : na, title="PIVOT", color=colYellow, linewidth=3, style=plot.style_linebr)
plot(showTarget ? target : na, title="TARGET", color=colOrange, linewidth=2, style=plot.style_linebr)
plot(showLast ? last : na, title="LAST", color=colWhite, linewidth=2, style=plot.style_linebr)
plot(showPrevClose ? prevClose : na, title="PREV CLOSE",color=colGray, linewidth=1, style=plot.style_linebr)
// ────────────────────── LABELS FOR ALL 4 KEY LEVELS (SAME STYLE AS OTHERS) ──────────────────────
f_label(price, txt, bgColor, txtColor) =>
if barstate.islast and not na(price)
label.new(bar_index, price, txt, style=label.style_label_left, color=bgColor, textcolor=txtColor, size=size.small)
if barstate.islast
showPivot ? f_label(pivot, "PIVOT\n" + str.tostring(pivot, "#.##"), colYellow, color.black) : na
showTarget ? f_label(target, "TARGET\n" + str.tostring(target, "#.##"), colOrange, color.white) : na
showLast ? f_label(last, "LAST\n" + str.tostring(last, "#.##"), colWhite, color.black) : na
showPrevClose ? f_label(prevClose, "PREV CLOSE\n"+ str.tostring(prevClose, "#.##"), colGray, color.white) : na
// ────────────────────── OTHER LEVELS – line stops at label ──────────────────────
f_level(p, txt, tc, lc, w=1) =>
if barstate.islast and not na(p)
lbl = label.new(bar_index, p, txt, style=label.style_label_left, color=lc, textcolor=tc, size=size.small)
line.new(bar_index-400, p, label.get_x(lbl), p, extend=extend.none, color=lc, width=w)
if barstate.islast
if showR1R2R3
f_level(r1, "R1\n" + str.tostring(r1, "#.##"), color.white, colRed)
f_level(r2, "R2\n" + str.tostring(r2, "#.##"), color.white, colRed)
f_level(r3, "R3\n" + str.tostring(r3, "#.##"), color.white, colRed, 2)
if showS1S2S3
f_level(s1, "S1\n" + str.tostring(s1, "#.##"), color.black, colLime)
f_level(s2, "S2\n" + str.tostring(s2, "#.##"), color.black, colLime)
f_level(s3, "S3\n" + str.tostring(s3, "#.##"), color.black, colLime, 2)
if showStdDev
f_level(stdRes1, "+1σ\n" + str.tostring(stdRes1, "#.##"), color.white, colPink)
f_level(stdRes2, "+2σ\n" + str.tostring(stdRes2, "#.##"), color.white, colPink)
f_level(stdRes3, "+3σ\n" + str.tostring(stdRes3, "#.##"), color.white, colPink, 2)
f_level(stdSup1, "-1σ\n" + str.tostring(stdSup1, "#.##"), color.white, colCyan)
f_level(stdSup2, "-2σ\n" + str.tostring(stdSup2, "#.##"), color.white, colCyan)
f_level(stdSup3, "-3σ\n" + str.tostring(stdSup3, "#.##"), color.white, colCyan, 2)
if showFib4W
f_level(fib382_4w, "38.2% 4W\n" + str.tostring(fib382_4w, "#.##"), color.white, colMagenta)
f_level(fib50_4w, "50% 4W\n" + str.tostring(fib50_4w, "#.##"), color.white, colMagenta)
if showFib13W
f_level(fib382_13w_high, "38.2% 13W High\n" + str.tostring(fib382_13w_high, "#.##"), color.white, colMagenta)
f_level(fib50_13w, "50% 13W\n" + str.tostring(fib50_13w, "#.##"), color.white, colMagenta)
f_level(fib382_13w_low, "38.2% 13W Low\n" + str.tostring(fib382_13w_low, "#.##"), color.white, colMagenta)
if showMonthHL
f_level(monthHigh, "1M HIGH\n" + str.tostring(monthHigh, "#.##"), color.white, colRed50, 2)
f_level(monthLow, "1M LOW\n" + str.tostring(monthLow, "#.##"), color.white, colGreen50, 2)
// Manual entries
plot(showEntry1 and entry1 > 0 ? entry1 : na, "Entry 1", color=colBlue, linewidth=2, style=plot.style_linebr)
plot(showEntry2 and entry2 > 0 ? entry2 : na, "Entry 2", color=colPurple, linewidth=2, style=plot.style_linebr)
// Background
bgcolor(close > pivot ? color.new(color.blue, 95) : color.new(color.red, 95))
