Auction Imbalance And Rebalance IndicatorThis indicator marks areas of Internal Range Liquidity along with Ecternal Range Liquidity
Search in scripts for "ict"

NY LONDON LUNCH AUTO**NY London Lunch Auto** is a precision session-anchor indicator designed for traders who focus on institutional timing and liquidity behavior.
This script automatically marks the **high and low of three key 15-minute New York session candles**:
• **3:00 AM NY** — London session expansion
• **8:00 AM NY** — New York open / kill zone
• **2:00 PM NY** — NY lunch / power hour transition
Each time one of these candles prints on the **15-minute chart**, the script captures its exact high and low and extends them forward as horizontal levels.
The levels remain **locked and unchanged** until the next key session candle appears, ensuring clean, non-repainting reference zones.
### Key Features
• Works **exclusively on the 15-minute timeframe**
• Automatically updates at **3AM, 8AM, and 2PM NY time**
• Levels stay fixed — no drifting or recalculation
• Clean, minimal design with customizable colors
• Ideal for liquidity sweeps, displacement, and ICT-style execution models
This indicator is built for traders who want **clarity, patience, and structure**, not clutter. It pairs seamlessly with liquidity sweep, displacement, and fair value gap strategies.

Displacement## Displacement Indicator (Institutional Momentum Filter)
This indicator highlights **true price displacement** — candles where price moves with **abnormal force relative to recent volatility**.
It is designed to help traders distinguish **real momentum** from normal market noise.
Displacement often precedes:
- Breaks of structure
- Fair Value Gaps (FVGs)
- Strong continuation or meaningful pullbacks
This tool focuses on **confirmation**, not prediction.
---
### 🔍 How Displacement Is Defined
A candle is marked as *displacement* only when **all conditions are met**:
• Candle body is larger than a multiple of ATR (volatility-adjusted)
• Candle body makes up a high percentage of the full candle (strong close)
• Directional conviction (bullish or bearish close)
This filters out:
- Small or average candles
- Wick-heavy indecision
- Low-quality breakouts
---
### 🎯 What This Indicator Is Best Used For
✔ Confirming impulsive moves
✔ Validating structure breaks
✔ Anchoring Fair Value Gaps
✔ Filtering low-probability setups
✔ Identifying institutional participation
Works best on **M5, M15, and H1**, especially during **London and NY sessions**.
---
### ⚠️ Important Notes
• This is **not** a buy/sell signal by itself
• Best used with trend, structure, or liquidity context
• Not designed for ranging or low-volatility markets
Think of this indicator as a **momentum truth filter** —
if displacement is missing, conviction is likely missing too.
---
### ⚙️ Inputs Explained
• ATR Length – defines normal volatility
• ATR Multiplier – how aggressive displacement must be
• Minimum Body % – ensures strong candle closes
All inputs are adjustable to fit different markets and styles.
---
### 🧠 Philosophy
Displacement reflects **commitment**, not anticipation.
This tool helps you wait for **proof**, not hope.
---
If you want, I can:
- Tighten this for **ICT-style language**
- Rewrite for **beginner clarity**
- Add a **“How I personally use it”** section
- Optimize it for **TradingView algorithm visibility**
**Tell me which you want changed.**

Liquidity Pools Smart Entry + Multi-TF Targets + VWAPOverview
This indicator is designed to help traders identify high-probability institutional-style entries using concepts from ICT (Inner Circle Trader) methodology. It combines liquidity pool detection, fair value gaps (FVG), swing levels, killzones, ATR-based targets, VWAP bias, and optional multi-timeframe analysis.
The script provides visual trade signals and a green-light confirmation system to streamline decision-making and reduce overtrading.
Key Features
Market Structure
Detects CHoCH (Change of Character) and BOS (Break of Structure).
Marks bullish and bearish breaks with labels on the chart.
Liquidity & Swings
Highlights Swing High/Low liquidity zones (SSL/BSL).
Shows horizontal swing lines for reference.
Fair Value Gap (FVG) Detection
Bullish and bearish gaps are plotted as shaded boxes.
Identifies potential institutional entry zones.
Killzones
Highlights London and New York sessions.
Helps align trades with high liquidity periods.
VWAP Filter
Plots the intraday VWAP.
Optional VWAP bias filter ensures trades follow intraday institutional flow.
Multi-Timeframe Confirmation
Supports 5-minute entry confirmation.
Shows SL/TP for both current TF and 5-min TF signals.
ATR-Based Stops & Targets
Entry signals automatically calculate SL (1.5 ATR) and TP (ATR x multiplier).
Customizable ATR multiplier.
Trade Light System
Visual green/red/gray indicators:
🟢 Green: All bullish conditions aligned → LONG allowed.
🔴 Red: All bearish conditions aligned → SHORT allowed.
⚪ Gray: Wait → conditions not aligned.
Inputs
Input Description
Show CHoCH/BOS Toggle structure labels on/off
Show Killzones Toggle session backgrounds on/off
Show Swing Liquidity Show SSL/BSL swing points
Show Horizontal Lines Extend swing lines horizontally
Show FVG Zones Show Fair Value Gaps
Show VWAP Display intraday VWAP
Swing Length Number of bars to calculate swing pivots
ATR Target Multiplier Multiplies ATR for TP calculation
Use HTF 200 EMA Filter Filter entries with higher timeframe trend
Use RSI Filter Filter entries using RSI 14
Use Volume Filter Filter entries with high volume confirmation
Use ATR Filter Filter entries based on ATR expansion
Use VWAP Filter Only allow trades in VWAP direction
How to Read the Chart
Structure Labels
BOS ↑ / BOS ↓: Breaks of structure showing trend direction.
Swing Liquidity
SSL (blue): Bullish swing low liquidity.
BSL (red): Bearish swing high liquidity.
FVG Zones
Green boxes: Potential bullish liquidity gaps.
Red boxes: Potential bearish liquidity gaps.
Killzones
Green background: London session.
Blue background: New York session.
VWAP
Purple line: Intraday volume-weighted average price.
Trade Lights
🟢 Green: All bullish conditions met — LONG ready.
🔴 Red: All bearish conditions met — SHORT ready.
⚪ Gray: Wait — conditions not aligned.
Entry Labels
Shows Entry price, SL, TP.
Separate labels for current TF and 5-min confirmation.
How to Use
Step 1: Identify Market Bias
Check HTF EMA: price above → bullish trend, below → bearish trend.
Check VWAP (if enabled): trade in direction of VWAP for institutional alignment.
Check Killzones: prefer entries during London or New York sessions.
Step 2: Confirm Entry Conditions
Wait for BOS / CHoCH to align with your trend.
Look for FVG zone and SSL/BSL liquidity.
Ensure RSI, ATR, Volume, VWAP filters (if enabled) all confirm.
Green/red Trade Light should be active.
Step 3: Place Trade
Use Entry Label price as reference.
SL: 1.5 ATR away.
TP: ATR x multiplier away.
Optional: check 5-min multi-TF confirmation label for additional confidence.
Step 4: Manage Trade
Follow ATR-based SL/TP.
Move stop to break-even after partial target if desired.
Only take trades when Trade Light is GREEN (LONG) or RED (SHORT).
Best Practices
Combine with volume profile or order block analysis for higher precision.
Avoid trading outside killzones.
Use multi-TF confirmation for safer entries.
Adjust ATR multiplier according to market volatility.

Ghost Scalp Protocol By [@Ash_TheTrader]
# 👻 GHOST SCALP PROTOCOL
### 💀 Stop Getting Trapped. Start Tracking the Banks.
Most retail traders lose because they enter exactly where institutions are exiting. They get caught in **"Stop Hunts"** and **"Fake-Outs."**
The **Ghost Scalp Protocol** is not just an indicator; it is a complete institutional trading system designed for **M1 & M5 Scalpers**. It combines **Smart Money Concepts (SMC)** with a **Physics-Based Momentum Engine ($p=mv$)** to detect high-probability reversals.
---
### ⚛️ THE LOGIC: 3-STAGE CONFIRMATION
This algorithm does not rely on lagging indicators. It uses a 3-step "Protocol" to validate every trade:
**1. THE GHOST TRAP (Liquidity Sweeps)**
* The script automatically draws "Ghost Lines" at key Swing Highs/Lows where retail Stop Losses are hiding.
* It waits for price to **sweep** these levels (Stop Hunt).
* **The Signal:** A Neon **Skull (☠️)** appears *only* if price aggressively rejects the level with high volume. This is the "Turtle Soup" pattern.
**2. THE PHYSICS ENGINE ($p = mv$)**
* Momentum is not just price speed; it is **Mass (Volume) x Velocity (Range)**.
* The dashboard calculates the "Force" of every candle.
* **The Signal:** An **Arrow (⬆/⬇)** appears when momentum surges **5x** above the average. This confirms the banks are pushing the move.
**3. BANK BIAS (Elasticity Filter)**
* Markets move like a rubber band.
* The script calculates a hidden "Fair Value" baseline.
* It creates a **Bias**: It only looks for Shorts in **PREMIUM (Shorting)** zones and Longs in **DISCOUNT (Accumulating)** zones.
---
### 📊 THE SMART DASHBOARD (HUD)
A futuristic, non-intrusive Heads-Up Display keeps you focused on the data that matters:
* **🏦 BANK BIAS:** Tells you if Institutions are likely **Accumulating** or **Shorting**.
* **📈 HTF TREND:** Automatically checks the **1-Hour Trend**. Don't fight the tide.
* **🚀 MOMENTUM:** Real-time Physics calculation.
* **Green Text:** Acceleration (Move is getting stronger).
* **Red Text:** Deceleration (Move is dying).
* **🌍 SESSION:** Shows active Bank Sessions (Tokyo, London, NY).
* **⚠️ OVERLAP ALERT:** Flashes GOLD when London & New York are open simultaneously (Peak Volatility).
---
### 🔥 STRATEGY: HOW TO TRADE
Use this checklist to execute high-probability scalps:
#### 📉 SHORT SETUP (SELL)
1. **Liquidity:** Wait for price to break above a **Red Ghost Line** (Sweep Highs).
2. **Signal:** Wait for the **Pink Skull ☠️** (Trap Detected).
3. **Confluence:**
* Dashboard Bias says: **"SHORTING"**
* HTF Trend says: **"BEARISH 📉"** (Optional but recommended).
4. **Entry:** On the Close of the Skull candle.
5. **Stop Loss:** Just above the wick swing high.
#### 📈 LONG SETUP (BUY)
1. **Liquidity:** Wait for price to break below a **Blue Ghost Line** (Sweep Lows).
2. **Signal:** Wait for the **Blue Skull ☠️** (Trap Detected).
3. **Confluence:**
* Dashboard Bias says: **"ACCUMULATING"**
* HTF Trend says: **"BULLISH 📈"** (Optional but recommended).
4. **Entry:** On the Close of the Skull candle.
5. **Stop Loss:** Just below the wick swing low.
---
### 🏆 RECOMMENDED PAIRS & TIMEFRAMES
* **⚡ Best Timeframes:**
* **1 Minute (M1):** For aggressive "Sniper" entries (High Frequency).
* **5 Minute (M5):** The "Gold Standard" for balanced Scalping.
* **15 Minute (M15):** Safer, higher win-rate Day Trading.
* **💎 Best Assets:**
* **Gold (XAUUSD):** Highly effective on liquidity sweeps.
* **Indices:** US100 (Nasdaq), US30 (Dow Jones).
* **Crypto:** BTCUSD, ETHUSD (High volatility).
* **Forex:** GBPUSD, EURUSD (London/NY Session).
---
### 🛠️ SETTINGS & CUSTOMIZATION
* **Surge Factor:** Default is **5.0x**. Lower this to 3.0 if you want more aggressive Momentum Arrows.
* **Smart Sessions:** Automatically converts to **New York Time** (EST) regardless of your location. No more time zone math.
* **Visuals:** Designed with "Ghost Glow" technology—97% transparent backgrounds that look classy and don't clutter your chart.
---
**"The Ghost Algo sees what you can't."**
*Trade Safe. Trade Smart.*
**~ Ash_TheTrader**

Universe Structure & Trend Zone [All-in-One]**Overview**
The "Universe Structure & Trend Zone" is a comprehensive all-in-one trading toolkit designed to combine Institutional Trend Following with Smart Money Concepts (SMC/ICT). It helps traders identify the dominant trend direction while providing precise entry points based on Market Structure Breaks (MSB) and Order Blocks.
This script aims to filter out market noise by allowing trades only when Price Action aligns with the long-term trend (SMA Zone).
**Key Features**
1. **Market Structure Breaks (MSB) & ZigZag:**
- Detects structural shifts in price (Bullish/Bearish MSB).
- Uses a default Signal Length of 10 to filter out minor swings and focus on significant structural changes.
- Visualizes high and low pivot points.
2. **Smart Trend Zone (SMA 200 Filter):**
- Incorporates a 200-period SMA Zone (Institutional Level) to determine the macro trend.
- **Trend Filter Logic:** The indicator intelligently filters signals. It displays Bullish Order Blocks only when the price is trending *above* the SMA Zone, and Bearish Order Blocks only *below* it. This drastically reduces false signals in choppy markets.
3. **Order Blocks (OB) & Breaker Blocks (BB):**
- Automatically identifies high-probability Order Blocks and Breaker Blocks.
- Includes optional filters for Volume and Premium/Discount zones to validate the blocks.
- Features an auto-cleanup mechanism to remove invalid or broken boxes, keeping the chart clean.
4. **Hull Moving Average (HMA):**
- A fast-reacting 55-period HMA is included to visualize short-term momentum shifts (Green for Bullish, Red for Bearish).
5. **Smart Range (Support/Resistance):**
- Plots the dynamic Highest High and Lowest Low of the selected timeframe (default 4H) to show the current trading range and Equilibrium (EQ) level.
**How to Use**
* **Step 1:** Check the **SMA Zone** (Gray/Green/Red Band). If Price > Zone, look for Longs. If Price < Zone, look for Shorts.
* **Step 2:** Wait for a **Market Structure Break (MSB)** label in the direction of the trend.
* **Step 3:** Look for an entry at the retest of an **Order Block (OB)** or **Breaker Block (BB)**.
* **Step 4:** Use the HMA color change as a confirmation trigger or trailing stop guide.
**Settings**
* **Signal Length:** Default is 10 (Optimized for standard swings).
* **Trend Filter:** Enabled by default (Recommended to stay with the trend).
* **Display:** You can toggle MSB lines, Boxes, and Labels on/off to suit your visual preference.
**Disclaimer**
This indicator is for educational purposes only and does not constitute financial advice. Always use proper risk management.

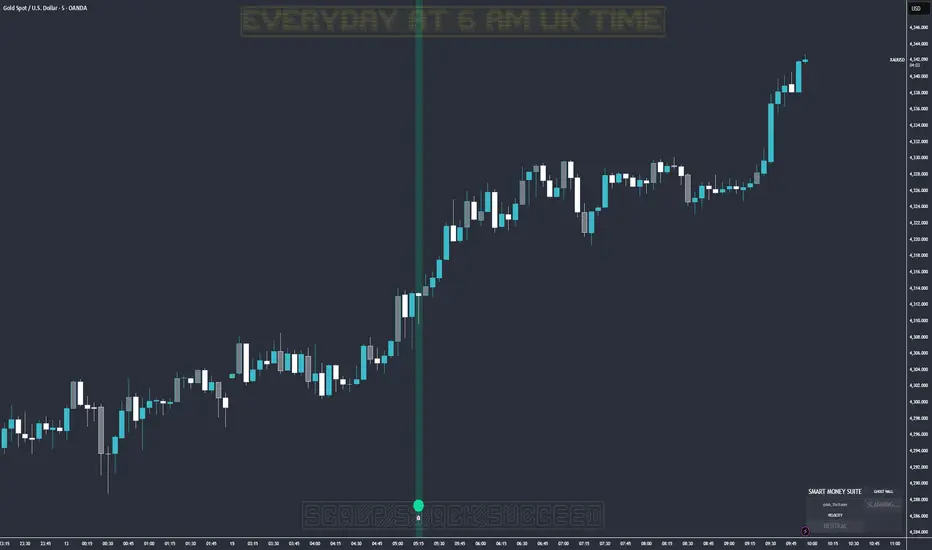
Ghost Protocol: Smart Money HUD [Ash_TheTrader]👻 GHOST PROTOCOL: The Institutional HUD
"Stop trading blind. Start seeing where the Smart Money is hiding."
Most indicators lag. They tell you what happened. Ghost Protocol tells you what is happening right now by combining two powerful concepts: Volume Absorption (Whale Defense) and Kinematic Physics (Price Velocity).
This is not just an indicator; it is a complete Heads-Up Display (HUD) for scalpers and day traders on NQ, ES, Gold, and Crypto.
🧠 The Concept: Why It Works
Retail traders lose money for two reasons:
Selling into a bottom (where Whales are absorbing orders).
Buying a fake breakout (where price lacks the energy to continue).
Ghost Protocol solves both by visualizing the invisible battle between aggressive orders (Retail) and passive limit orders (Institutions).
🛠️ The 3 Core Features
1. The "Ghost Walls" (Reversal Detector) 🛡️
What it is: Detects when massive volume hits the market but Price fails to progress. This is Absorption. A "Whale" is using a Limit Order Wall to absorb panic selling or FOMO buying.
The Visual:
🟢 Green Ghost Bubble + Beam: Buyers are absorbing sellers. (Bullish Wall).
🔴 Red Ghost Bubble + Beam: Sellers are absorbing buyers. (Bearish Wall).
Sticky Tech: The bubbles "stick" to the wicks perfectly, regardless of zoom level.
2. The "Velocity Terminal" (Breakout Validator) 🚀
What it is: A Physics Engine for price. It calculates Jerk (Change in Acceleration). Standard breakouts often fail, but a breakout with high "Jerk" (Surge) rarely comes back.
The Visual:
🟣 Plasma Purple Candle: Valid Breakout. Price is moving with high physical energy. Safe to follow.
⚪ Grey/Dull Candle: Fakeout. Price broke a level but lacks energy. The move is likely a trap.
3. The Smart Money Dashboard 💻
A sleek, "Classy" panel in the bottom right corner.
Monitors both engines simultaneously:
GHOST WALL: Scans for Reversals (Buy/Sell Walls).
VELOCITY: Scans for Momentum (Surge/Fakeout).
🎯 How to Trade This Script
Strategy A: The "Whale Reversal" (Scalping)
Step 1: Wait for price to push hard into a level.
Step 2 : A Ghost Wall (Ghost Icon 👻) appears.
Step 3 : A vertical Neon Beam lights up the background.
Action: Take the reversal immediately. Place stop loss just behind the bubble.
Strategy B: The "Physics Breakout" (Trend Following)
Step 1: Price breaks a key resistance or support level.
Step 2: Look at the candle color.
If it is Plasma Purple: ENTER. The physics engine confirms true momentum.
If it is Grey: WAIT. It is likely a fakeout designed to trap you.
⚙️ Settings & Customization
Bubble Distance: Adjust how close the Ghost bubbles sit to the candles.
Sensitivity: Tune the "Jerk Threshold" for the physics engine.
Visuals: Toggle the Background Beams, Dashboard size, and Neon colors to fit your dark/light mode setup.
Created by @Ash_TheTrader Trade with the Whales, not against them.
NY 8:00 8:15 Candle High & LowThis indicator plots the high and low of the New York 8:00–8:15 AM (EST) 15-minute candle and extends those levels horizontally for the rest of the trading day
The levels are **anchored to the 15-minute timeframe
Designed for **session-based trading, liquidity sweeps, ICT-style models, and NY Open strategies.
Lines automatically reset each trading day at the NY open window.
Clean, lightweight, and non-repainting.
This script is ideal for traders who want consistent, reliable session levels without recalculation or timeframe distortion.
Custom versions available
If you’d like:
- Different sessions (London, Asia, custom hours)
- Multiple session ranges
- Labels, alerts, or strategy logic
- A full strategy version with entries, SL/TP, and risk rules
Feel free to reach out — happy to build custom tools to fit your trading model.

Index Construction Tool🙏🏻 The most natural mathematical way to construct an index || portfolio, based on contraharmonic mean || contraharmonic weighting. If you currently traded assets do not satisfy you, why not make your own ones?
Contraharmonic mean is literally a weighted mean where each value is weighted by itself.
...
Now let me explain to you why contraharmonic weighting is really so fundamental in two ways: observation how the industry (prolly unknowably) converged to this method, and the real mathematical explanation why things are this way.
How it works in the industry.
In indexes like TVC:SPX or TVC:DJI the individual components (stocks) are weighted by market capitalization. This market cap is made of two components: number of shares outstanding and the actual price of the stock. While the number of shares holds the same over really long periods of time and changes rarely by corporate actions , the prices change all the time, so market cap is in fact almost purely based on prices itself. So when they weight index legs by market cap, it really means they weight it by stock prices. That’s the observation: even tho I never dem saying they do contraharmonic weighting, that’s what happens in reality.
Natural explanation
Now the main part: how the universe works. If you build a logical sequence of how information ‘gradually’ combines, you have this:
Suppose you have the one last datapoint of each of 4 different assets;
The next logical step is to combine these datapoints somehow in pairs. Pairs are created only as ratios , this reveals relationships between components, this is the only step where these fundamental operations are meaningful, they lose meaning with 3+ components. This way we will have 16 pairs: 4 of them would be 1s, 6 real ratios, and 6 more inverted ratios of these;
Then the next logical step is to combine all the pairs (not the initial single assets) all together. Naturally this is done via matrices, by constructing a 4x4 design matrix where each cell will be one of these 16 pairs. That matrix will have ones in the main diagonal (because these would be smth like ES/ES, NQ/NQ etc). Other cells will be actual ratios, like ES/NQ, RTY/YM etc;
Then the native way to compress and summarize all this structure is to do eigendecomposition . The only eigenvector that would be meaningful in this case is the principal eigenvector, and its loadings would be what we were hunting for. We can multiply each asset datapoint by corresponding loading, sum them up and have one single index value, what we were aiming for;
Now the main catch: turns out using these principal eigenvector loadings mathematically is Exactly the same as simply calculating contraharmonic weights of those 4 initial assets. We’re done here.
For the sceptics, no other way of constructing the design matrix other than with ratios would result in another type of a defined mean. Filling that design matrix with ratios Is the only way to obtain a meaningful defined mean, that would also work with negative numbers. I’m skipping a couple of details there tbh, but they don’t really matter (we don’t need log-space, and anyways the idea holds even then). But the core idea is this: only contraharmonic mean emerges there, no other mean ever does.
Finally, how to use the thing:
Good news we don't use contraharmonic mean itself because we need an internals of it: actual weights of components that make this contraharmonic mean, (so we can follow it with our position sizes). This actually allows us to also use these weights but not for addition, but for subtraction. So, the script has 2 modes (examples would follow):
Addition: the main one, allows you to make indexes, portfolios, baskets, groups, whatever you call it. The script will simply sum the weighted legs;
Subtraction: allows you to make spreads, residual spreads etc. Important: the script will subtract all the symbols From the first one. So if the first we have 3 symbols: YM, ES, RTY, the script will do YM - ES - RTY, weights would be applied to each.
At the top tight corner of the script you will see a lil table with symbols and corresponding weights you wanna trade: these are ‘already’ adjusted for point value of each leg, you don’t need to do anything, only scale them all together to meet your risk profile.
Symbols have to be added the way the default ones are added, one line : one symbol.
Pls explore the script’s Style setting:
You can pick a visualization method you like ! including overlays on the main chart pane !
Script also outputs inferred volume delta, inferred volume and inferred tick count calculated with the same method. You can use them in further calculations.
...
Examples of how you can use it
^^ Purple dotted line: overlay from ICT script, turned on in Style settings, the contraharmonic mean itself calculated from the same assets that are on the chart: CME_MINI:RTY1! , CME_MINI:ES1! , CME_MINI:NQ1! , CBOT_MINI:YM1!
^^ precious metals residual spread ( COMEX:GC1! COMEX:SI1! NYMEX:PL1! )
^^ CBOT:ZC1! vs CBOT:ZW1! grain spread
^^ BDI (Bid Dope Index), constructed from: NYSE:MO , NYSE:TPB , NYSE:DGX , NASDAQ:JAZZ , NYSE:IIPR , NASDAQ:CRON , OTC:CURLF , OTC:TCNNF
^^ NYMEX:CL1! & ICEEUR:BRN1! basket
^^ resulting index price, inferred volume delta, inferred volume and inferred tick count of CME_MINI:NQ1! vs CME_MINI:ES1! spread
...
Synthetic assets is the whole new Universe you can jump into and never look back, if this is your way
...
∞

FxNeel SessionAll types of ICT session you can draw here. Like Asia, London, NY, New Close, CBDR, Asia Kill zone and also Silverbullet Time zone.

UK100 London Judas & IFVG SetupUK100 London Judas & IFVG Setup
Overview This indicator is a specialized trading tool designed to automate the ICT Judas Swing strategy specifically for the UK100 (FTSE 100) index during the London Market Open. It combines institutional time-based logic with price action confirmation using Inversion Fair Value Gaps (IFVG) to identify high-probability reversal setups.
How It Works The strategy is based on the concept that the initial move after the London Open is often a "fake-out" (manipulation) designed to trap retail traders and engineer liquidity before the true trend of the day begins.
Session & Opening Price:
The script marks the London Open price (default 09:00 Warsaw / 08:00 London time) with a dashed line.
This serves as the "line in the sand." Prices moving away from this line initially are monitored for manipulation.
Judas Swing (Liquidity Sweep):
If price moves BELOW the open, it is hunting Sell-Side Liquidity (trapping sellers).
If price moves ABOVE the open, it is hunting Buy-Side Liquidity (trapping buyers).
The Entry Trigger: Inversion FVG (IFVG):
The indicator scans for Fair Value Gaps (FVG) created during the manipulation phase.
BUY Signal: The price manipulates lower, creates a Bearish FVG (Red Box), but then aggressively reverses and closes ABOVE that gap. The gap is now "Inverted" (turns Green), acting as support.
SELL Signal: The price manipulates higher, creates a Bullish FVG (Green Box), but then aggressively reverses and closes BELOW that gap. The gap is now "Inverted" (turns Orange), acting as resistance.
Key Features
Automated Pattern Recognition: No need to manually draw gaps. The script detects valid FVG inversions that align with the Judas Swing logic.
Built-in Risk Calculator: The signal labels display the exact Lot Size you should use based on your account balance and risk percentage (default 0.5%). It calculates this dynamically based on the Stop Loss distance.
Institutional Targets: The indicator fetches H1 Fractals (Liquidity) from the 1-hour timeframe and plots them on your 1-minute chart as blue lines. These are your primary Take Profit (TP) levels.
Stop Loss Visualization: Automatically suggests a Stop Loss placement behind the swing high/low of the reversal structure.
How to Use
Timeframe: Set your chart to 1 Minute (1m).
Asset: UK100 (FTSE 100).
Wait: Allow the London session to open. Watch for price to move away from the opening line.
Execute: When a BUY or SELL label appears:
Enter the trade using the Lot Size shown on the label.
Set your Stop Loss at the price shown on the label.
Target the blue H1 Liquidity lines for profit taking.
Settings
Timezone: Set this to your chart/exchange timezone (Default: Europe/Warsaw).
Account Balance: Input your current trading capital (e.g., 100,000) for accurate risk calculations.
Risk Per Trade %: The percentage of your account you are willing to lose if the Stop Loss is hit (Standard: 0.5% - 1.0%).
Contract Size: The value of 1 point movement (Check your broker's specifications. Usually 1 for CFDs).
Alerts You can set a single alert in TradingView to capture all signals. Select the indicator and choose "Any alert() function call". You will receive a notification with the direction (Buy/Sell), Entry Price, and Lot Size.

Quarterly Theory The Quarterly Theory indicator is a refined analytical tool that applies the ICT (Inner Circle Trader) framework and fractal time principles. It divides market time into structured quarterly cycles, anchored by the True Open of each period, to provide precise signals for trade entry and exit. This approach is consistently effective across all timeframes—from yearly and monthly charts down to 90-minute sessions.
The core model defines four distinct market phases within each cycle:
Q1 – Accumulation: A consolidation phase where the market builds a base for the next move.
Q2 – Manipulation (Judas Swing): Characterized by deceptive, rapid price action designed to trap traders before a true trend emerges.
Q3 – Distribution: A period of high volatility as positions are unwound and transferred.
Q4 – Continuation/Reversal: The cycle concludes with the established trend either extending or reversing.
By leveraging smart algorithms, the indicator analyzes these phases to detect critical market structures such as liquidity zones, stop-runs, and high-probability price patterns. This synthesis of Quarterly Theory, fractal timing, and liquidity analysis delivers a data-driven edge, empowering traders to decode complex market behavior and execute informed, strategic trades.

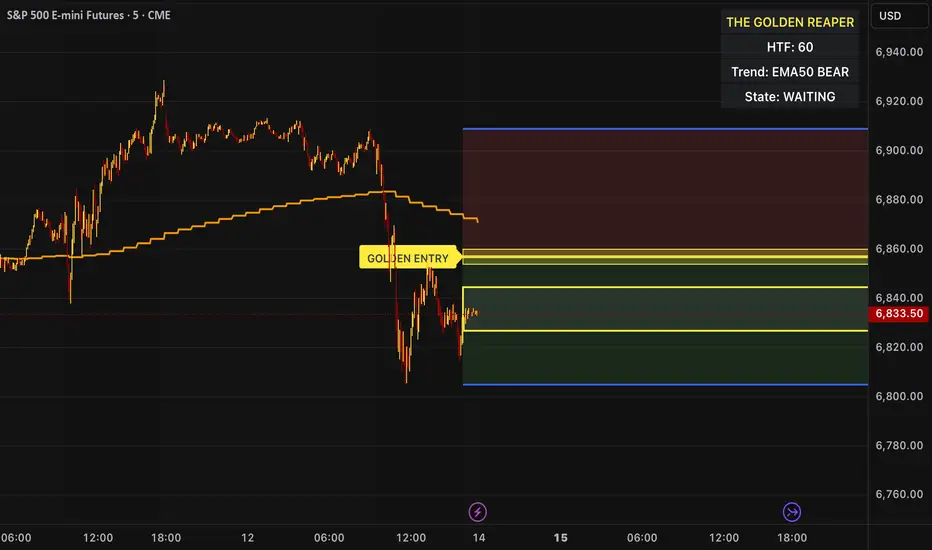
The Golden Reaper 🟡 THE GOLDEN REAPER
HTF OTE + EMA50 — Futures Scalping Framework
The Golden Reaper is a high-timeframe execution framework designed specifically for futures scalpers who trade with precision, patience, and structure.
This indicator focuses on HTF market structure, Optimal Trade Entry (OTE) zones, and equilibrium (50%) reclaim confirmation to identify high-probability execution areas for fast, controlled scalps.
It is not a signal spam tool.
It is a framework built for disciplined traders who wait for price to come to them.
⸻
🔑 Designed For
✔ Futures markets (ES, NQ, MNQ, MES, GC, MGC, CL, etc.)
✔ Scalpers & intraday traders
✔ 1H structure → 5m / 1m execution
✔ Traders who prefer few high-quality setups
⸻
🧠 Core Logic (How It Works)
1️⃣ High-Timeframe Structure (HTF)
The indicator identifies the most recent HTF swing high and low to define the active trading leg.
2️⃣ OTE Zone (Premium / Discount)
Price is expected to react within the OTE zone where liquidity is commonly targeted.
3️⃣ Golden Entry (EQ 50%)
The 50% equilibrium level is marked as the Golden Entry.
Price must reclaim this level for a setup to become valid.
4️⃣ Golden Execution Zone
After reclaim, a golden execution zone appears to define where entries are allowed.
5️⃣ EMA 50 Trend Filter
Trades are taken only in the direction of the HTF EMA 50 to avoid counter-trend scalps.
⸻
⚡ How Futures Scalpers Use It
Recommended Timeframes
• HTF Structure: 1 Hour
• Execution: 5 Minute / 1 Minute
Process
• Wait for price to reach the OTE zone
• Allow the setup to arm
• Enter only after price reclaims the Golden Entry
• Execute within the Golden Execution Zone
• Manage stops and targets manually
This approach helps scalpers:
✔ Avoid chasing price
✔ Reduce over-trading
✔ Improve entry precision
✔ Maintain consistency
⸻
🔔 Alerts Included
• OTE Touched – Setup is armed
• C-Reclaim Confirmed – Entry condition met
(Alerts are designed to assist — not replace — trader judgment.)
⸻
⚠️ Important Notes
• Designed for futures markets only
• Best used with price action confirmation
• No built-in stop loss or take profit (manual risk management required)
• Not financial advice
⸻
🧬 Who This Indicator Is For
✔ Futures scalpers
✔ ICT / Smart Money traders
✔ Structure-based traders
✔ Traders who value patience over frequency
❌ Not for:
• Signal chasers
• Indicator stacking
• Automated trading
• Beginners who want instant entries
⸻
🟡 Created By
ChartReaper / Tactiko
Instagram:
@officialchartreaper
@tactiko
Simple ICT Sweep + FVG (LuxAlgo Swings FIXED)something i created if anyone can improve it or change for better visual

ORB + Killzones - Universal AutoORB + Killzones • Universal Auto
A clean overlay indicator that automatically plots 15-minute Opening Range Breakout (ORB) levels for major global sessions with full DST handling and optional Killzone shading.
Key Features
Universal auto-detection: adapts session times and timezones perfectly for crypto (24/7) and traditional markets (cash hours only)
15-minute ORB high/low lines for Tokyo, Hong Kong, China, London, and New York sessions
Precise DST-aware London (Europe/London) and New York (America/New_York) sessions
Optional translucent Killzone background shading: London Open (0800–1100), NY Open (0930–1100), London Close (1530–1630) — with custom colors and transparency
Individual toggle switches for each session ORB and Killzone display
Clean neon color scheme matching popular retrowave setups (Tokyo teal, HK magenta, China red, London blue, NY gold)
Efficient drawing with persistent lines that extend until session end
No repainting, low resource usage (max 250 lines, 60 labels)
Ideal for ICT/SMC traders who want accurate multi-session ORBs and high-probability Killzone windows on any instrument or timeframe. Works on forex, indices, stocks, and crypto.
Recommend to uncheck timeframes over 1 hour in the Visibility tab of the Settings.

Session Levels + PDH/PDL (Adjustable, v6 fixed) 📊 Session Levels + PDH/PDL (Adjustable)
This indicator plots key intraday reference levels based on major market sessions and the previous day’s range. It is designed for traders who rely on session highs/lows, liquidity levels, and market structure rather than indicators like EMAs or oscillators.
🔹 What it shows
Asia Session High & Low
UK (London) Session High & Low
New York Session High & Low
Previous Day High (PDH) & Previous Day Low (PDL)
Each level is drawn as a horizontal line and can optionally include a label for quick identification.
⚙️ Fully adjustable
Session times for Asia, UK, and New York are fully editable
Custom colors for each session and PDH/PDL
Show / hide toggles for each session individually
Adjustable line width and right-side extension
Optional session background shading with adjustable transparency
Optional labels for all levels
🕒 Timezone handling
Uses a user-defined timezone (default: Europe/Dublin)
Works on any intraday timeframe
Session logic is replay-safe and does not repaint past levels
🎯 How traders typically use it
Identify liquidity pools at session highs/lows
Use PDH/PDL as targets, reactions, or bias levels
Combine with price action, market structure, ORBs, or ICT-style models
Mark London and NY expansions after Asia range is set
✅ Designed for
Futures traders (ES, NQ, YM, Gold)
Forex and indices
Intraday & session-based strategies
Traders who want clean charts with meaningful levels only

Session Killzone & Liquidity Sweep Engine [2025]A session-based market analysis tool designed to visualize key intraday trading sessions and monitor price interaction with session highs and lows.
The script draws configurable session ranges (Asia, London, New York AM, Lunch, and PM) using session-based boxes. For each session, the high and low levels are calculated in real time and projected forward as reference levels.
Each session high and low reacts dynamically to price behavior:
• If price wicks beyond a session level without a candle close beyond it, the level is marked as a liquidity sweep and stops extending.
• If price closes beyond a session level, the level is considered invalidated and removed.
Optional midpoint levels can be displayed for each session. Users can choose whether levels extend only until mitigation or continue beyond it, as well as whether only the most recent session or all past sessions are tracked.
Additional features include:
• Timezone support with proper session alignment
• Session drawing limits to manage chart clutter
• Timeframe filtering to restrict drawings to lower timeframes
• Optional alerts when session highs or lows are broken by a candle close
• Extensive customization for colors, line styles, labels, and visibility
This tool is intended for traders who analyze intraday price behavior around session highs and lows and want a structured way to observe wick-based interactions and level invalidations.

INSTITUTIONAL MOMENTUM [@Ash_TheTrader]⚡ The Impulse Engine: Institutional Velocity & Smart Structure System
Subtitle/Short Description: Stop looking at just Open and Close. Visualize the speed of price action, detect institutional footprints, and trade off dynamic "living" market structure that flips and burns automatically. Developed by @Ash_TheTrader.
The Hidden Dimension of Price Action
Most traders look at a standard candlestick and see four data points: Open, High, Low, and Close.
But this hides the most critical information: The struggle.
Did the buyers step in aggressively in the first 5 minutes, pushing price to highs instantly? (Institutional buying)
Or did it take 59 minutes of slow, grinding effort to reach that high? (Retail exhaustion/Trap)
Standard candles look identical in both scenarios. The Impulse Engine, developed by @Ash_TheTrader, solves this by visualizing the "Speed of Price" (Velocity) directly onto your chart, combined with a state-of-the-art, dynamic market structure system.
It’s not just an indicator; it’s a complete market X-ray.
1. The Velocity Painter: See the Speed ⚡
The core of this system is the Velocity Engine. It looks "inside" your current timeframe bar (using lower timeframe data) to calculate how fast price traveled to its extremes.
It paints the bars based on institutional urgency, allowing you to ignore the noise and focus on the momentum.
The Visual Code:
⚡ NEON CYAN (Bullish Impulse) : Aggressive buying. Price ripped from the open to the high very quickly. This is where the smart money is stepping on the gas.
⚡ NEON MAGENTA (Bearish Impulse): Aggressive selling. Price crashed from the open to the low immediately.
💤 FADED GREY (Exhaustion/Trap): The "grind." Price took a long time to reach its extremes. These are often low-momentum environments or potential traps waiting to reverse.
STANDARD GREEN/RED: Normal market flow with no significant velocity extremes.
"Trade the Neon, Ignore the Grey." — @Ash_TheTrader
2. Smart Structure: "Living" Levels 🏗️
Old-school pivot indicators clutter your chart with endless historical lines that are no longer relevant. The Impulse Engine uses a "Living Structure" algorithm that manages the lifecycle of every support and resistance level.
It only shows you the two most relevant Resistance levels (R1, R2) above price, and the two most relevant Support levels (S1, S2) below price.
Risk-Based Classification:
You choose the structure based on your trading style in the settings:
Scalp Mode: Detects short-term, 5-bar swings. (Thin dotted lines).
Trend Mode: Detects standard trend swings (21-bar). (Dashed lines).
Major Swing: Detects deep, major structural points (60-bar). (Thick solid lines).
The "Flip & Burn" Mechanic (Viral Feature) 🔥
This is where the system gets smart. It understands market mechanics:
The Flip (Role Reversal): If a Resistance level is broken by a candle close, it automatically turns Gold and becomes Support (Flip). The same applies to Support turning into Resistance. You no longer need to guess if an old level will hold from the other side.
The Burn (Auto-Cleaning): If a "Flipped" level is broken again, the system recognizes it has lost its structural integrity. The line is instantly "burned" (removed from the chart).
This ensures your chart only ever shows levels that are active and respected.
3. Whale Signs: The Footprint of Big Money 🐋
Sometimes, velocity isn't enough. You need to see raw power.
The Whale Sign feature detects massive expansions in volatility. It flags any candle whose range is significantly larger (default 2x) than the average of the previous two candles.
💚 Green Triangle + $ (Below Bar): A massive bullish expansion candle. A "Wake Up" call for longs.
❤️ Red Triangle + $ (Above Bar): A massive bearish expansion candle. A warning sign for shorts.
These often precede sustained velocity moves.
4. The Pro HUD (Heads-Up Display) 💻
In the bottom right corner, the dynamic HUD gives you a real-time health check of the current candle.
Status Header: Instantly tells you if the current candle is IMPULSE, EXHAUSTION, or NORMAL.
Live Velocity %: The exact speed score. The text color changes to Neon during impulses and fades to grey during exhaustion.
Mode Info: Reminds you which risk setting you are currently using (e.g., Mode: ).
Signature: The official @Ash_TheTrader stamp of quality.
How to Trade With The Impulse Engine
This system is designed for confluence. Never trade a signal in isolation.
📈 Strategy 1 : The "Velocity Bounce" (Trend Continuation)
Ensure the market is trending (e.g., making higher highs).
Wait for price to pull back to a Smart Support level (Cyan dashed line or Gold "Flip" line).
Trigger: Look for a Neon Cyan Impulse Candle to form right off that support level. This confirms institutions are defending the structure with speed.
📉 Strategy 2: The "Whale Breakout"
Identify a consolidation zone below a Smart Resistance level.
Trigger: A Whale Sign ($) appears on a candle that successfully closes above the Resistance level.
Confirmation: The very next candle should ideally be a Neon Impulse candle continuing the move.
Conclusion
The markets are moved by aggression and speed. By obscuring this data, standard charts put you at a disadvantage.
The Impulse Engine brings this hidden data to the forefront, combining institutional velocity detection with smart, automated market structure that reacts to price just like a professional trader would.
Trade faster, trade smarter.
Developed by @Ash_TheTrader.
(Disclaimer: This tool is for informational purposes only and does not constitute financial advice. Always manage your risk.)

IVX: Institutional Velocity X-Ray [Ash_TheTrader]The Intrabar Liquidity X-Ray: Seeing Institutional Speed Inside the Candle ⚡🐢
Stop getting trapped by standard candlesticks. It’s time to see how fast the money is actually moving.
A standard candlestick tells you four things: Open, High, Low, and Close. It’s the foundation of technical analysis.
But it hides the most important metric of all: Speed.
Two bullish 1-Hour candles can look identical on your chart. Both opened at $100 and closed at $105.
Candle A hit $105 in the first 5 minutes, then spent 55 minutes holding that level.
Candle B ground slowly upwards, finally hitting $105 in the 59th minute.
To a standard indicator, these candles are the same. To a professional trader, they are opposites. One shows aggressive, front-loaded institutional buying; the other shows weak, exhausted retail grinding.
As @Ash_TheTrader, I developed the Intrabar Liquidity X-Ray to solve this problem. It stops looking at the surface of the candle and looks inside it.
🧠 The Concept: Time-To-Form
This indicator uses advanced Pine Script technology to conduct an "X-Ray" scan of the bar you are looking at.
If you are on a 1-Hour chart, the script uses request.security_lower_tf to fetch the data of the 60 individual 1-minute bars hidden inside that single hour bar.
It then asks a critical question: How long did it take for this candle to achieve its ultimate High or Low?
In a Bullish candle, we measure the time it took to hit the specific minute of the bar's High.
In a Bearish candle, we measure the time it took to hit the specific minute of the bar's Low.
By measuring this "Time-To-Form," we can classify the intent behind the move.
⚡ The "Fast" Candle (Institutional Aggression)
When smart money wants to move an asset, they don't wait all day. They execute large block orders that move price rapidly to their desired level, and then they defend it.
The Signal: The indicator identifies a bar as "Fast" if it hits its High (for bulls) or Low (for bears) in the first 20% of the candle's duration.
The Visual: The bar turns Neon Cyan and is marked with a lightning bolt ⚡.
Interpretation by @Ash_TheTrader: This is urgent liquidity. Institutions are front-loading their orders. These levels are often strong zones of support or resistance on retests because the big players showed their hand early.
🐢 The "Slow" Candle (Retail Grind)
Conversely, when a move is driven by retail traders chasing price, or when a trend is exhausted, price struggles to make new extremes. It grinds slowly, taking the entire duration of the candle just to inch slightly higher or lower.
The Signal: The indicator identifies a bar as "Slow" if it takes more than 80% of the candle's duration to finally reach its High or Low.
The Visual: The bar turns Orange and is marked with a turtle 🐢 beneath it.
Interpretation by @Ash_TheTrader: This is "weak" movement. Even if the candle is green, if it took 58 minutes of a 60-minute bar just to make a new high, the buyers are exhausted. Be wary of reversals after seeing a cluster of 🐢 candles.
💻 Features and The Dashboard
To make this data actionable in real-time, I have engineered a clean Heads-Up Display (HUD) directly on the chart.
The On-Chart Dashboard: Located in the top right, the dashboard gives you the live stats of the current forming bar. It tells you exactly what percentage of the time has passed and whether the current structure is considered Institutional ⚡ or a Retail Grind 🐢.
Other Features:
Dual Polarity Logic: Works seamlessly for both bullish trends (tracking speed to Highs) and bearish trends (tracking speed to Lows).
Smart Volume Filtering: The indicator automatically ignores insignificant low-volume "noise" bars, only highlighting speed on candles with above-average volume.
Full Alert Capability: Set alerts for "Fast ⚡" detections to catch sudden institutional activity as it happens.
⚙️ Best Practices for Using This Tool
Because this tool looks inside a bar, it is designed to be used on Higher Timeframes.
Recommended Timeframes: 30-Minute, 1-Hour, 4-Hour, or Daily charts.
Do Not Use On: 1-Minute or 5-Minute charts. (You cannot effectively "X-Ray" a 1-minute bar using 1-minute data; the math doesn't work).
A Final Note from @Ash_TheTrader
Trading is about information asymmetry. The market hides the most valuable data beneath the surface of the Open and Close. Use the Intrabar Liquidity X-Ray to stop guessing the speed of the market and start seeing it.
Trade safe, trade smart.⚡

The Physics Engine [@Ash_TheTrader]🏛️ Welcome to the Physics of Finance
By @Ash_TheTrader
Traditional technical analysis often relies on "lagging" indicators. Tools like the RSI or moving averages tell you where price has been. While useful, they are like driving a car looking only in the rearview mirror.
The Kinematic Impulse Engine (KIE) is different. It is designed to be a leading indicator of momentum shifts.
It doesn't just look at price; it treats price action like a physical object moving through space to measure its Velocity (Speed), Acceleration (G-Force), and Mass (Volume). By understanding the physics behind a move, we can determine if a trend is a powerful impulse or an exhausted drift waiting to reverse.
⚛️ The Core Concept: Trading with G-Force
If you step on the gas pedal in a car, you feel pushed back into your seat. That is acceleration (positive G-Force). When you slam on the brakes, you are thrown forward. That is deceleration (negative G-Force).
The market works the same way.
Standard momentum indicators only measure speed. The KIE measures how fast that speed is changing.
The Problem with Standard Indicators: Price can be moving higher (high speed), but the rate at which it is moving higher is slowing down (deceleration). A standard indicator will still look bullish right up until the reversal happens.
The KIE Solution: The KIE detects that deceleration instantly, warning you that the "G-Force" pushing the price up has vanished, often before the price peaks.
🎨 Visual Decoder: Reading the Heatmap
We have eliminated the need to stare at complex oscillator lines below your chart. The KIE paints the candles directly based on their "Kinetic Energy."
1. Neon Cyan : The Impulse (High G-Force) 🚀
Physics State: High Velocity + Positive Acceleration.
Meaning: The market has "pedal to the metal." Buyers are aggressive, and the move is speeding up. This is where you want to be in a trade.
Signal: Look for the small triangles (🚀) marking the start of these impulse moves out of the noise.
2. Deep Purple : Exhaustion (Braking) 🛑
Physics State: High Velocity + Negative Acceleration (Deceleration).
Meaning: The car is still moving forward fast, but the driver has taken their foot off the gas or hit the brakes.
Signal: This is a massive warning sign. If you are long and candles turn purple, the trend is running on fumes. Expect consolidation or a reversal soon.
3. Dark Gray : Equilibrium (Chop) 💤
Physics State: Low Velocity.
Meaning: No significant energy present. The market is chopping sideways.
Signal: Stay out of the market or use range-bound strategies.
⚠️ Unique Feature: Gravity Divergence Detection
This is the most powerful feature of the Kinematic Impulse Engine. It detects when price action is defying the laws of physics.
Imagine throwing a ball into the air. As it reaches the very peak of its arc, it is still moving upward, but gravity is decelerating it rapidly just before it falls back down.
The KIE detects this exact moment in the market:
Gravity Sell Signal: Price makes a new high, but Acceleration (G-Force) crashes rapidly. The market is fighting gravity and will likely snap back.
If you see a "GRAVITY" label pop up on a Deep Purple candle at a high, take notice.
🧠 The Engine Room (Under the Hood)
For the technical traders, here is how @Ash_TheTrader designed the engine:
Relative Velocity: Price changes are normalized against Average True Range (ATR) volatility. A $10 move in Bitcoin is not the same as a $10 move in a penny stock; the KIE adjusts for this automatically.
Mass Integration (Volume Weighting): In physics, Force = Mass x Acceleration. The KIE optionally uses relative Volume as "Mass." A move backed by high volume has more "weight" and is harder to stop than a low-volume move.
The HUD: The on-screen dashboard gives you real-time readings of the current Velocity and raw G-Force metrics, along with an instant trend status summary.
🛡️ How to Use This in Your Trading
The Breakout Trader: Wait for gray candles (chop). Enter when the first Neon Cyan candle appears, ideally accompanied by an Impulse Triangle (🚀). Ride the cyan until it turns purple.
The Reversal Trader: Wait for an extended run of cyan candles. When the candles turn Deep Purple and you see a "GRAVITY" warning label, look for shorting opportunities as the momentum is exhausted.
Trade smart. Trade with physics.
Developed by @Ash_TheTrader

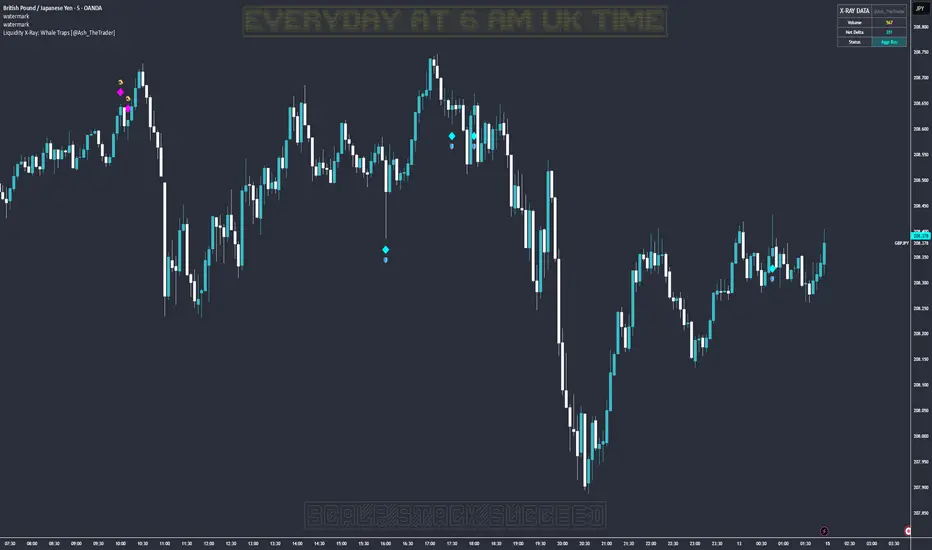
Liquidity X-Ray: Whale Traps [@Ash_TheTrader]👁️ Liquidity X-Ray: The Institutional Edge
Stop Trading Blind. See Inside the Candle.
Ninety percent of retail traders only see the outer shell of a candlestick—the Open, High, Low, and Close. They are trading blind to the actual battle that took place during that candle's formation.
Institutions, however, use expensive Order Flow software to see where aggressive buying or selling is happening in real-time.
The Liquidity X-Ray Strategy, developed by @Ash_TheTrader, levels the playing field. It uses advanced Intrabar Analysis to simulate institutional order flow footprints directly on your TradingView chart, automating powerful reversal signals based on "Absorption."
🧠 The Concept: Intrabar Analysis & Delta
How does it work?
Imagine a single 1-Hour candle. Inside that candle, there are sixty 1-Minute candles hidden from view.
This strategy performs an "X-Ray" scan. It tunnels into the lower timeframes (e.g., 5-minute data inside a 1-hour bar) to calculate the Net Delta—the difference between aggressive buying volume and aggressive selling volume.
Cyan Candles: Indicate that aggressive buyers (hitting the Ask) won the internal battle.
Magenta Candles: Indicate that aggressive sellers (hitting the Bid) won the internal battle.
But knowing who won isn't enough. The real edge comes from identifying Absorption.
🎯 The Signals: Detecting Traps & Shields
The core philosophy of this strategy by @Ash_TheTrader is simple: Identify where high effort yields low results.
When massive volume comes in, but price refuses to move, it means one side is being "absorbed" by a larger player. This is often the precursor to a violent reversal.
1. The Bear Trap (🪤)
What you see: A candle with massive volume and aggressive internal buying (positive Delta), yet the candle body remains small and fails to push price significantly higher.
The Psychology: Retail traders are FOMO-buying aggressively at a high. Institutional "Whales" are sitting on the other side, passively selling into this demand, absorbing all the buy orders without letting price rise.
The Result: Once the buyers are exhausted, the trap snaps shut, and price reverses downward.
Strategy Action: Enters a SHORT position.
2. The Bull Shield (🛡️)
What you see: A candle with massive volume and aggressive internal selling (negative Delta), yet the candle body remains small and fails to push price lower.
The Psychology: A "Stop Run" is occurring. Retail traders are panic-selling. Smart money is stepping in like a shield, absorbing all the sell pressure at a fixed level.
The Result: Once the sellers are exhausted, there is no one left to sell, and price rallies upward.
Strategy Action: Enters a LONG position.
⚡ Strategy Features & The Viral Dashboard
This isn't just an indicator; it's a complete, automated trading system.
Automated Execution: The script takes the trades for you when a Shield or Trap is confirmed upon candle close.
Smart Risk Management: It automatically places Stop Losses beyond the wick of the signal candle and targets a default 2:1 Risk/Reward ratio.
The Live Performance Panel: Look at the top right of your chart. The strategy features a built-in, professional-grade dashboard that displays real-time statistics. You can instantly see the strategy's Win Rate and Net Profit over the current historical data.
"Numbers don't lie. Don't just guess if a setup works; watch the win rate adjust in real-time." — @Ash_TheTrader
🛠️ How to Use This Strategy
For the best results, follow these institutional guidelines:
Timeframe: This strategy is most effective on Higher Timeframes where institutional volume is dominant. We recommend the 1-Hour (1H) or 4-Hour (4H) charts.
Intrabar Resolution (Settings): In the strategy settings, ensure the "Intrabar Resolution" is set lower than your chart timeframe. The default is 5 minutes, which is ideal for scanning inside 1H or 4H candles.
Confluence: While the strategy can be traded standalone, the best signals often occur near major support/resistance zones or key Fibonacci levels.
⚠️ Disclaimer
This strategy uses request.security_lower_tf to perform its calculations. While highly accurate, past performance on the dashboard does not guarantee future results. Always manage your risk responsibly.
Trade smart. See the liquidity.
~ @Ash_TheTrader
KIMATIX FVG/IFVG/BPRProfessional Fair Value Gap & Imbalance Toolkit
The KIMATIX FVG/IFVG/BPR indicator is a precision tool designed to identify institutional inefficiencies in price:
Fair Value Gaps (FVG), Inverse Fair Value Gaps (IFVG) and Balanced Price Ranges (BPR) — clean, minimal and non-repainting.
This indicator is built for scalpers, intraday traders and smart-money traders who want to trade where price is most likely to react, not where indicators lag.
What this indicator shows
Fair Value Gaps (FVG)
Detects bullish and bearish FVGs using strict 3-candle imbalance logic
Highlights areas where price moved too fast, leaving inefficient structure
Ideal for:
Continuation trades
Pullback entries
Reaction zones after impulse moves
Color-coded
🟢 Bullish FVG
🔴 Bearish FVG
Inverse Fair Value Gaps (IFVG)
Automatically detects when an FVG is invalidated
Marks the same zone as an Inverse FVG
Extremely useful for:
Failed structure setups
Reversal trades
Stop-hunt & liquidity traps
Color-coded
🟡 IFVG (invalidation zone)
Balanced Price Range (BPR)
Detects overlapping bullish & bearish FVGs
Highlights price areas where buying and selling pressure are balanced
These zones often act as:
High-probability reaction areas
Compression zones before expansion
Premium intraday decision levels
Color-coded
🔵 BPR (balanced price range)
Smart, Clean & Non-Repainting
Non-repainting
Only the last 3 active zones are shown → no clutter
Boxes extend forward with a manual cap (user-controlled)
Designed for 1m – 15m execution, works on all markets
Futures, Crypto, FX, Indices, Stocks
How professionals use it
Combine FVGs with:
VWAP
Session highs/lows
Volume Profile (POC / VAH / VAL)
Market structure (BOS / displacement)
Use IFVGs to spot failed smart-money narratives
Use BPRs as decision zones, not blind entries
This indicator does not give buy/sell signals.
It shows you where trades make sense — execution is up to you.
Best use cases
Scalping (1m–3m)
Intraday trading (5m–15m)
Smart-money concepts
Liquidity-based trading
News reactions & stop runs
Learn how to trade it properly
This indicator is part of the KIMATIX Trading Framework.
More education, live examples & full system:
kimatixtrading.com
