MFI - Money Flow Index [UTS]Money Flow Index (MFI) is the technical indicator, which indicates the rate at which money is invested into a security and then withdrawn from it.
Construction and interpretation of the indicator is similar to Relative Strength Index with the only difference that volume is important to MFI.
Usage:
When analyzing the money flow index one needs to take into consideration the following points:
divergences between the indicator and price movement. If prices grow while MFI falls (or vice versa), there is a great probability of a price turn;
Money Flow Index value, which is over 80 or under 20, signals correspondingly of a potential peak or bottom of the market.
Common known variants of this type of indicator are the On Balance Volume, Chaikin Oscillator or Chaikin Money Flow.
Based on www.metatrader5.com
Search in scripts for "index"

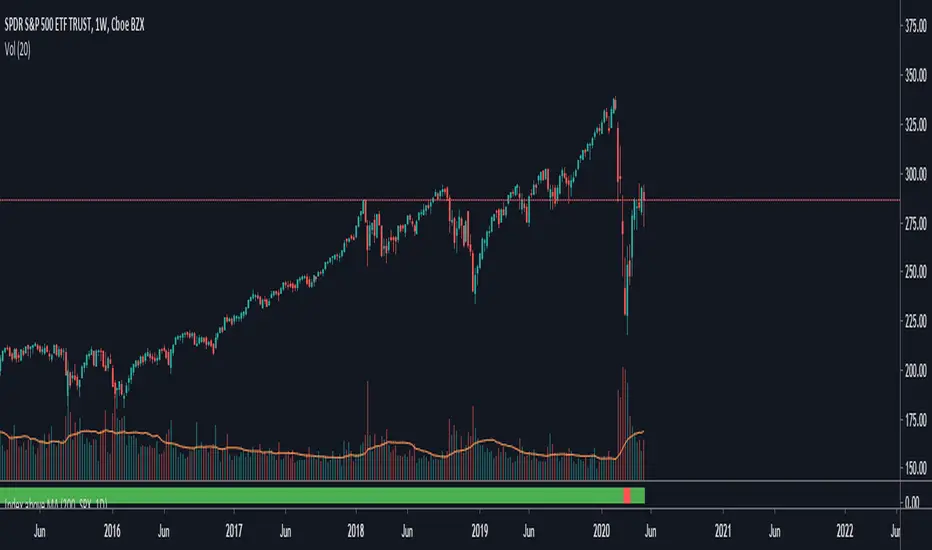
TNZ - Index above MA Use this indicator to filter stock selection based on the relevant index value being above the selected simple moving average.
For example, only buying the S+P 500 stock if the S+P 500 index value is above the 10 period moving average.
The time frame used is that displayed
Sell Relative Strength Index [ChuckBanger]This is Sell Relative Strength Index (SRSI or “sell gravitation index”). This indicator was developed by Howard Wand as featured in the February 2019 issue of TASC magazine.
"Traders accumulate profits trade by trade, with the goal of maximizing profits. But selloffs happen and when they do, you see significant price drops that are fast. Here’s an indicator that uses the profit accumulation size to estimate subsequent selloff size.
Green lines represent buy, red represents sell and yellow represents a balance between buy and sell signals on the SRSI."
Trend Direction Force Index v2 - TDFI [wm]TDFI can range from -1 to 1 and thus indicate the direction of the trend.
In periods of consolidation ratios take very low values close to zero as a rule, do not exceed the value of 0.05 (and -0.05), which have set arbitrarily as horizontal signal lines. Rate accelerates rapidly to higher values when the consolidation ends and is a good chance of becoming a permanent trend.
As an extension, the trader can assume that as long as the pointer moves above the signal line and does not come down to the low value of less than 0.05 for at least two bars the trend continues. So the descent below signal line and a return to higher values should be interpreted as a temporary weakening trend. Not before rate remains below 0.05 for at least 2 bars, can we consider that the market is likely to begin to consolidate
In addition, we can assess the strength of the trend, depending on the value of the index – the index reaches 1 trend is strong (-1 is a strong downward trend) and generally values above 0.6 should be so interpreted. Less than in decline should be considered that the trend is losing its momentum.
Change Log:
* Refactored tdfi implementation. Functionally exactly the same
* Added selectable smoothers
* Added finer grained inputs fora each smoother
Combo Strategy 123 Reversal & Commodity Selection Index This is combo strategies for get a cumulative signal.
First strategy
This System was created from the Book "How I Tripled My Money In The
Futures Market" by Ulf Jensen, Page 183. This is reverse type of strategies.
The strategy buys at market, if close price is higher than the previous close
during 2 days and the meaning of 9-days Stochastic Slow Oscillator is lower than 50.
The strategy sells at market, if close price is lower than the previous close price
during 2 days and the meaning of 9-days Stochastic Fast Oscillator is higher than 50.
Second strategy
The Commodity Selection Index ("CSI") is a momentum indicator. It was
developed by Welles Wilder and is presented in his book New Concepts in
Technical Trading Systems. The name of the index reflects its primary purpose.
That is, to help select commodities suitable for short-term trading.
A high CSI rating indicates that the commodity has strong trending and volatility
characteristics. The trending characteristics are brought out by the Directional
Movement factor in the calculation--the volatility characteristic by the Average
True Range factor.
Wilder's approach is to trade commodities with high CSI values (relative to other
commodities). Because these commodities are highly volatile, they have the potential
to make the "most money in the shortest period of time." High CSI values imply
trending characteristics which make it easier to trade the security.
The Commodity Selection Index is designed for short-term traders who can handle
the risks associated with highly volatile markets.
WARNING:
- For purpose educate only
- This script to change bars colors.
Liquid RSI - Marrying The Relative Strength Index And The VolumeIntroduction
I recently derived the calculation of the relative strength index, an indicator that aim to spot overbought and oversold assets, but what is an overbought/sold asset ? Can such things be estimated with price alone ?
This why i propose a modification of the relative strength using my recently proposed efficient calculation including volume information in order to spot overbought/sold asset.
Scaling A Liquid Market
The relative strength index detect an overbought/sold asset when higher/lower than a certain level, often 80/20. An overbought asset, or better say over evaluated, is more attractive to sell because prices are no longer attractive to buy, it has reached its value of interest for traders looking to go long, we can then expect the price to correct and start a trend of opposite direction, while an oversold asset is more attractive to buy based on the same logic.
The idea of talking about over bought and over sold without taking into account the volume can be a bit strange, since volume is directly related to the quantity of contracts traded, an higher volume can show sign of a more active market, which can describe the terms : overbought/sold a bit better. Many indicators used the rsi framework with volume, the money flow index for example, but it can be interesting to provide other alternatives.
The Indicator
The indicator is based on the average positive changes in price multiplied by positive changes in volume divided by the average absolute change in price multiplied by the absolute changes in volume. The average is based on the wilder moving average which is a simple exponential filter with smoothing constant 1/length .
The indicator will react according to the volume magnitude, higher volumes will make the indicator go over/under the overbought/sold threshold more easily, in the image above, the indicator is currently saying that the market is under evaluated, which is not the case for the RSI. Such situation allow us to take a position that we could't take if we base our judgement only on price change magnitude.
The indicator has a tendency to be over/under the thresholds a longer period of time if the volume is relatively high.
An interesting effect the indicator has it to ignore movements with moderate volume, the indicator is less prone to cross under a threshold and to go back to it, this is shown in the image above. Another observation we can make is that the proposed indicator is smoother than the rsi, this is certainly due to the fact that the volume underweight small price changes.
Conclusions
I proposed a modification of the relative strength index that also take into account volume information. The proposed indicator is also smoother. Regarding its ability to detect overbought and oversold market, it has indeed the capacity to do it, however the problem remain the same, what is the extent of the correction following an overbought/oversold market ? We can see that the correction can be minor, and thus be followed by a large movements correlated with the main trend.
With those oscillators we are interested into knowing the end of the "whole trend", and they fail to do this because they use past information. I still hope the indicator find some creative usages amongst the community.
Thanks for reading ! And remember to ask before using the script code, it pains me to see minor changes on scripts i can pass 3 hours on.
Elder's force index impulseForce Index is an oscillator. It combines volume with prices
to discover the force of bulls or bears behind every rally or decline.
It brings together three essential pieces of information the direction of price
change, its extent, and the volume during that change. It provides a practical way of
using volume for making trading decisions.
Force Index can be used in its raw form, but its signals stand out much more
clearly if we smooth it with a moving average. Using a short EMA of Force Index
helps pinpoint entry and exit points. Using a longer EMA helps confirm trends.
Efi long > 0 (bullish trend) and efi short < 0 = buy signal (green bar)
Efi long < 0 (bear trend) and efi short>0 = sell signal (red bar)

Combo Strategy 123 Reversal & CCI This is combo strategies for get a cumulative signal.
First strategy
This System was created from the Book "How I Tripled My Money In The
Futures Market" by Ulf Jensen, Page 183. This is reverse type of strategies.
The strategy buys at market, if close price is higher than the previous close
during 2 days and the meaning of 9-days Stochastic Slow Oscillator is lower than 50.
The strategy sells at market, if close price is lower than the previous close price
during 2 days and the meaning of 9-days Stochastic Fast Oscillator is higher than 50.
Second strategy
The Commodity Channel Index (CCI) is best used with markets that display cyclical or
seasonal characteristics, and is formulated to detect the beginning and ending of these
cycles by incorporating a moving average together with a divisor that reflects both possible
and actual trading ranges. The final index measures the deviation from normal, which indicates
major changes in market trend.
To put it simply, the Commodity Channel Index (CCI) value shows how the instrument is trading
relative to its mean (average) price. When the CCI value is high, it means that the prices are
high compared to the average price; when the CCI value is down, it means that the prices are low
compared to the average price. The CCI value usually does not fall outside the -300 to 300 range
and, in fact, is usually in the -100 to 100 range.
WARNING:
- For purpose educate only
- This script to change bars colors.

Bitfinex vs. Mex IndexBitfinex price vs. Bitmex index price, as a percentage. Bitmex index is an equally weighted average of Coinbase, Bitstamp & Kraken prices.

Trend Direction Force Index - TDFI [wm]TDFI can range from -1 to 1 and thus indicate the direction of the trend.
In periods of consolidation ratios take very low values close to zero as a rule, do not exceed the value of 0.05 (and -0.05), which have set arbitrarily as horizontal signal lines. Rate accelerates rapidly to higher values when the consolidation ends and is a good chance of becoming a permanent trend.
As an extension, the trader can assume that as long as the pointer moves above the signal line and does not come down to the low value of less than 0.05 for at least two bars the trend continues. So the descent below signal line and a return to higher values should be interpreted as a temporary weakening trend. Not before rate remains below 0.05 for at least 2 bars, can we consider that the market is likely to begin to consolidate
In addition, we can assess the strength of the trend, depending on the value of the index – the index reaches 1 trend is strong (-1 is a strong downward trend) and generally values above 0.6 should be so interpreted. Less than in decline should be considered that the trend is losing its momentum.

Rumpy's Dynamic Momentum IndexNote : I haven't been able to determine from the info I've found whether the variable length is used for the average gain/loss part of the calculation and/or for the relative strength portion of the calculation . If anyone knows for certain please let me know.
Type A only uses the variable length for the final relative strength calculation and the fixed RSI length for the average gain/loss.
Type B uses the variable length for both.
I do suspect that Type B is correct though as it is a lot more sensitive to momentum changes while Type A tends to just exaggerate normal RSI
-------------------------------------------------------------------------------------------------------------------------------------------
This indicator, developed by Tushar Chande and Stanley Kroll, is similar to the relative strength index (RSI). The main difference between the two is that the RSI uses a fixed number of time periods (usually 14) in its calculation, while the dynamic momentum index uses different time periods as volatility changes, typically between five and 30.
The dynamic momentum index uses fewer periods in its calculation when volatility is high, and more periods when volatility is low.
The number of time periods used in the dynamic momentum index decreases as volatility in the underlying security increases, making this indicator more responsive to changing prices than the RSI. This is particularly useful when an asset's price moves quickly as it approaches key support or resistance levels. Because the indicator is more sensitive, traders can potentially find earlier entry and exit points than with the RSI.
-------------------------------------------------------------------------------------------------------------------------------------------
If you find it useful please consider a tip/donation :
BTC - 3BMEXEDyWJ58eXUEALYPadbn1wwWKmf6sA
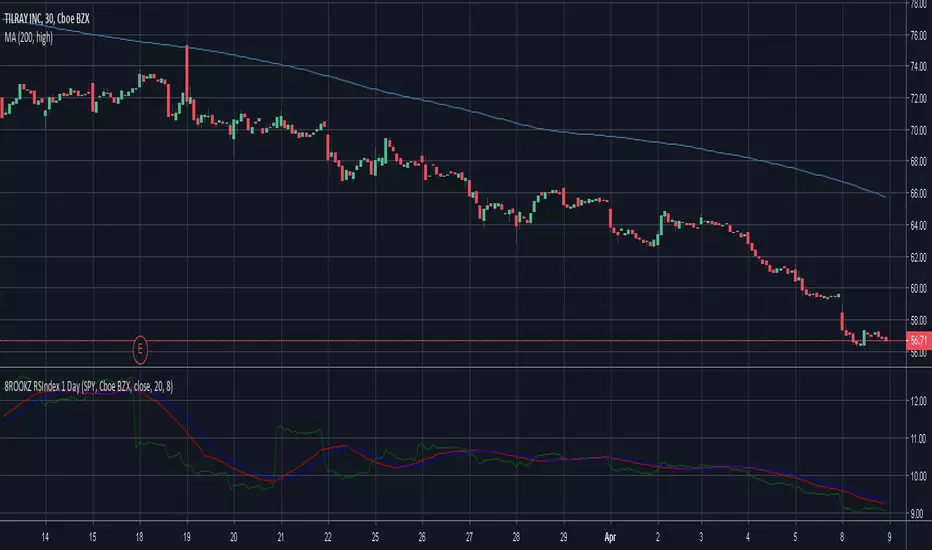
8ROOKZ Rel Strength to index - 1 DayRelative Strength to Index
- use to understand the correlation between stock and the index
- Calculated on one day close
Variable Index Dynamic Average SystemVariable Index Dynamic Average System indicator script based on the original version by Tushar Chande.
I have try to make a "system" with it, just for fun but it can be usefull on alt coins for example.
The indicator is compose of 3 VIDYA 14 peridod, 14*2 and 14*4. and 2 gray line (it's the difference between the fist VIDYA and the higher VIDYA.
With this you can see if we are in a trend, in range, defind level of entry, TP... just be sure feed correctly the indicator with the good TF.
Thanks to @everget for his orginal code that you can find here :

Stochastic Momentum Index (Stoch MTM, SMI)Stochastic Momentum Index (Stoch MTM, SMI)
The Stochastic Momentum Index (Stoch MTM, SMI) is based on the Stochastic Oscillator. The difference is that the Stochastic Oscillator calculates where the close is relative to the high/low range, while the SMI calculates where the close is relative to the midpoint of the high/low range. The values of the SMI range from +100 to -100. When the close is greater than the midpoint, the SMI is above zero, when the close is less than than the midpoint, the SMI is below zero.
The SMI is interpreted the same way as the Stochastic Oscillator. Extreme high/low SMI values indicate overbought/oversold conditions. A buy signal is generated when the SMI rises above -50, or when it crosses above the signal line. A sell signal is generated when the SMI falls below +50, or when it crosses below the signal line. Also look for divergence with the price to signal the end of a trend or indicate a false trend.
The Stochastic Momentum Index was developed by William Blau and was introduced in his article in the January, 1993 issue of Technical Analysis of Stocks & Commodities magazine.

Relative Strength Index of Moving AveragePine script version 3
Author CryptoJoncis
RSIOMA is the abbreviation for Relative Strength index (RSI) of moving averages (MA). This custom built indicator is based on calculating the relative strength of two moving averages and the smoothes out the RSI using a moving average. Combined, the RSIOMA oscillator depicts trend changes in prices relative to the time frame. The RSIOMA can be used as a signal generator by itself. (www.ProfitF.com)
There are some minor things which you can use to modify this version of RSIOMA:
Choose 2 levels of Over Sold and Over Bought for RSI
Set the middle level to easier visualize the trend
Set x% wider MA line to avoid too many fake signals and gain higher precision
You can choose which MA would you like to use from the following list:
Tillson Moving Average (T3)
Double Exponential Moving Average ( DEMA )
Arnaud Legoux Moving Average ( ALMA )
Least Squares Moving Average ( LSMA )
Simple Moving Average ( SMA )
Exponential Moving Average ( EMA )
Weighted Moving Average ( WMA )
Smoothed Moving Average ( SMMA )
Triple Exponential Moving Average ( TEMA )
Hull Moving Average ( HMA )
Adaptive moving average (AMA)
Fractal Adaptive Moving Average (FAMA)
Variable Index Dynamic Average ( VIDYA )
Triangular Moving Average (TRIMA)
Any questions/suggestions/errors or spelling mistakes? Please leave a comment and let me know.
You can use,publish,modify this code in any way as you wish, but only if you reference me after.
You are not allowed to sell it as it is.
If this code is useful to you, then consider to buy me a coffee 2.17% (or better a pint of beer) by donating Bitcoin 0.64% or Etherium to:
BTC: 3FiBnveHo3YW6DSiPEmoCFCyCnsrWS3JBR
ETH: 0xac290B4A721f5ef75b0971F1102e01E1942A4578
References:
www.profitf.com

Market Facilitation Index (MFI) Backtest The Market Facilitation Index is an indicator that relates price range to
volume and measures the efficency of price movement. Use the indicator to
determine if the market is trending. If the Market Facilitation Index increased,
then the market is facilitating trade and is more efficient, implying that the
market is trending. If the Market Facilitation Index decreased, then the market
is becoming less efficient, which may indicate a trading range is developing that
may be a trend reversal.
You can change long to short in the Input Settings
WARNING:
- For purpose educate only
- This script to change bars colors.

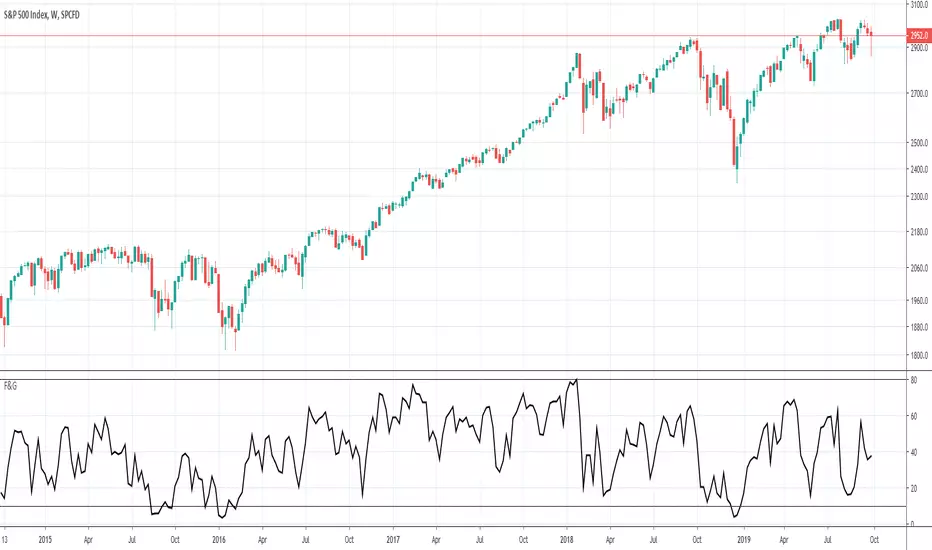
Fear & Greed Index-BuschiThis is an attempt to mimic the CNN Money "Fear & Greed Index": money.cnn.com
It's far from perfect, because the exact numbers can be a bit far off. Still, the highs and lows are quite on target. Alas, CNN does not give away too much information on how the index is calculated.
Feedback is most welcome.
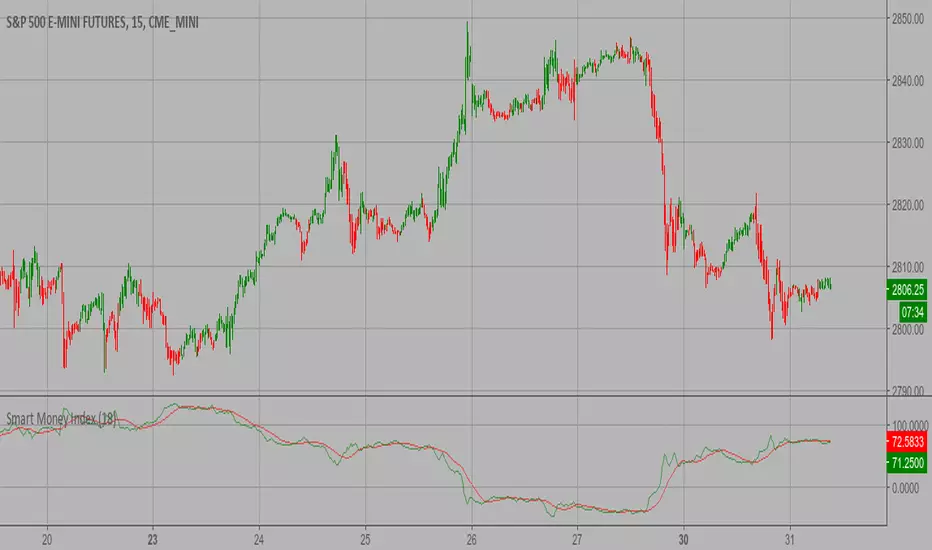
Smart Money Index (SMI) Backtest Attention:
If you would to use this indicator on the ES, you should have intraday data 60min in your account.
Smart money index (SMI) or smart money flow index is a technical analysis indicator demonstrating investors sentiment.
The index was invented and popularized by money manager Don Hays. The indicator is based on intra-day price patterns.
The main idea is that the majority of traders (emotional, news-driven) overreact at the beginning of the trading day
because of the overnight news and economic data. There is also a lot of buying on market orders and short covering at the opening.
Smart, experienced investors start trading closer to the end of the day having the opportunity to evaluate market performance.
Therefore, the basic strategy is to bet against the morning price trend and bet with the evening price trend. The SMI may be calculated
for many markets and market indices (S&P 500, DJIA, etc.)
The SMI sends no clear signal whether the market is bullish or bearish. There are also no fixed absolute or relative readings signaling
about the trend. Traders need to look at the SMI dynamics relative to that of the market. If, for example, SMI rises sharply when the
market falls, this fact would mean that smart money is buying, and the market is to revert to an uptrend soon. The opposite situation
is also true. A rapidly falling SMI during a bullish market means that smart money is selling and that market is to revert to a downtrend
soon. The SMI is, therefore, a trend-based indicator.
Some analysts use the smart money index to claim that precious metals such as gold will continually maintain value in the future.
You can change long to short in the Input Settings
WARNING:
- For purpose educate only
- This script to change bars colors.

Smart Money Index (SMI) Strategy Attention:
If you would to use this indicator on the ES, you should have intraday data 60min in your account.
Smart money index (SMI) or smart money flow index is a technical analysis indicator demonstrating investors sentiment.
The index was invented and popularized by money manager Don Hays. The indicator is based on intra-day price patterns.
The main idea is that the majority of traders (emotional, news-driven) overreact at the beginning of the trading day
because of the overnight news and economic data. There is also a lot of buying on market orders and short covering at the opening.
Smart, experienced investors start trading closer to the end of the day having the opportunity to evaluate market performance.
Therefore, the basic strategy is to bet against the morning price trend and bet with the evening price trend. The SMI may be calculated
for many markets and market indices (S&P 500, DJIA, etc.)
The SMI sends no clear signal whether the market is bullish or bearish. There are also no fixed absolute or relative readings signaling
about the trend. Traders need to look at the SMI dynamics relative to that of the market. If, for example, SMI rises sharply when the
market falls, this fact would mean that smart money is buying, and the market is to revert to an uptrend soon. The opposite situation
is also true. A rapidly falling SMI during a bullish market means that smart money is selling and that market is to revert to a downtrend
soon. The SMI is, therefore, a trend-based indicator.
Some analysts use the smart money index to claim that precious metals such as gold will continually maintain value in the future.
WARNING:
- This script to change bars colors.
Money Flow Index + AlertsThis study is based on the work of TV user Beasley Savage ( ) and all credit goes to them.
Changes I've made:
1. Added a visual symbol of an overbought/oversold threshold cross in the form of a red/green circle, respectively. Sometimes it can be hard to see when a cross actually occurs, and if your scaling isn't set up properly you can get misleading visuals. This way removes all doubt. Bear in mind they aren't meant as trading signals, so DO NOT use them as such. Research the MFI if you're unsure, but I use them as an early warning and that particular market/stock is added to my watchlist.
2. Added 60/40 lines as the MFI respects these incredibly well in trends. E.g. in a solid uptrend the MFI won't go below 40, and vice versa. Use the idea of support and resistance levels on the indicator and it'll be a great help. I've coloured the zones. Strong uptrends should stay above 60, strong downtrends should stay below 40. The zone in between 40-60 I've called the transition zone. MFI often stays here in consolidation periods, and in the last leg of a cycle/trend the MFI will often drop into this zone after being above 60 or below 40. This is a great sign that you should get out and start looking to reverse your position. Hopefully it helps to spot divergences as well.
3. Added alerts based on an overbought/oversold cross. Also added an alert for when either condition is triggered, so hopefully that's useful for those struggling with low alert limits. Feel free to change the overbought/oversold levels, the alerts + crossover visual are set to adapt.
Like any indicator, don't use this one alone. It works best paired with indicators/techniques that contradict it. You'll often see a OB/OS cross, and price will continue on it's way for many weeks more. But MFI is a great tool for identifying upcoming trend changes.
Any queries please comment or PM me.
Cheers,
RJR

Dynamic Momentum Index (DMI) Backtest This indicator plots Dynamic Momentum Index indicator. The Dynamic Momentum
Index (DMI) was developed by Tushar Chande and Stanley Kroll. The indicator
is covered in detail in their book The New Technical Trader.
The DMI is identical to Welles Wilder`s Relative Strength Index except the
number of periods is variable rather than fixed. The variability of the time
periods used in the DMI is controlled by the recent volatility of prices.
The more volatile the prices, the more sensitive the DMI is to price changes.
In other words, the DMI will use more time periods during quiet markets, and
less during active markets. The maximum time periods the DMI can reach is 30
and the minimum is 3. This calculation method is similar to the Variable
Moving Average, also developed by Tushar Chande.
The advantage of using a variable length time period when calculating the RSI
is that it overcomes the negative effects of smoothing, which often obscure short-term moves.
The volatility index used in controlling the time periods in the DMI is based
on a calculation using a five period standard deviation and a ten period average
of the standard deviation.
You can change long to short in the Input Settings
WARNING:
- For purpose educate only
- This script to change bars colors.
