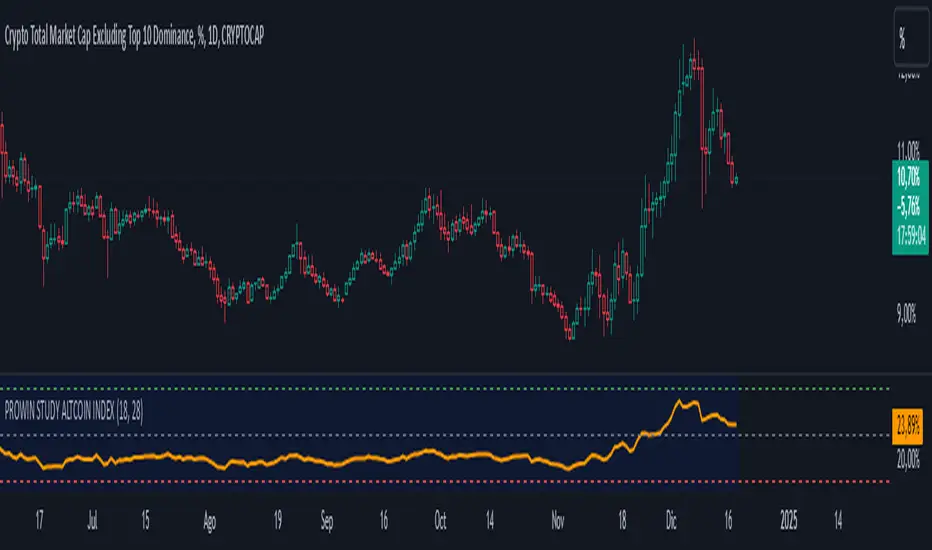
PROWIN STUDY ALTCOIN INDEXPROWIN STUDY ALTCOIN INDEX
This indicator tracks the performance of key altcoin dominance indices (BTC.D, ETH.D, USDT.D, USDC.D, and DAI.D) by analyzing their closing prices. It calculates an Exponential Moving Average (EMA) to highlight the overall trend of the altcoin market. Key horizontal levels representing support (limit up), resistance (limit down), and a central line are drawn to help identify potential price action zones. This indicator is designed for analysis on the others.d asset in a daily timeframe, providing insights into market movements and altcoin dominance shifts.
Search in scripts for "index"
Levy Flight Relative Strength Index [SeerQuant]Lévy Flight Relative Strength Index
A nuanced improvement on the classic RSI, the Lévy Flight RSI leverages the Lévy Flight model to calculate dynamic weighted gains and losses, offering improved responsiveness and smoothness in trend detection compared to the regular RSI. Ideal for traders seeking a balance between precision and adaptability, the Lévy Flight RSI is packed with customizable features and a sleek, modern aesthetic.
-----------------------------------------------------------------
🧠 What is Lévy Flight Modelling?
Lévy Flight modelling is a concept derived from probability theory and fractal mathematics, widely applied in fields such as finance and physics. In trading, Lévy Flights describe a random walk process characterized by small, frequent movements interspersed with larger, less frequent movements. This behaviour reflects real-world price dynamics, where markets often exhibit periods of relative calm followed by sharp, volatile movements. The Lévy Flight model introduces a weighting mechanism that amplifies extreme price changes while smoothing smaller ones, providing a more nuanced view of market trends.
In the context of the Lévy Flight RSI, this model enhances traditional RSI calculations by dynamically weighting price changes (gains and losses) based on their magnitude. This results in an RSI that is more responsive to significant price movements, making it ideal for detecting shifts in momentum and market direction.
-----------------------------------------------------------------
🌟 Key Features:
- Dynamic Lévy Flight Modelling: Adjust alpha (1 to 2) for responsive or smooth signals, making it perfect for varying market conditions.
- Custom RSI Smoothing: Choose from multiple moving average types, including TEMA, DEMA, HMA, ALMA, and more, to match your trading style.
- Visually Intuitive: Neon-inspired gradient colours and centered histogram provide instant insights into market conditions.
- Customizable Overbought/Oversold Levels: Clearly defined thresholds, with additional shaded regions for strength identification.
-----------------------------------------------------------------
⚙️ How the Code Works
The Lévy Flight RSI enhances the traditional RSI calculation by incorporating two primary elements:
Dynamic Weighting Using Lévy Flight:
The code calculates the price change (change) on each bar and applies a power function (alpha) to these changes. Gains are raised to the power of alpha (for positive price changes), and losses are similarly transformed (for negative price changes).
The parameter alpha (ranging from 1 to 2) determines the sensitivity of the weighting. Lower values emphasize responsiveness, while higher values smooth out signals.
Enhanced Moving Averages:
The weighted gains and losses are smoothed using a customizable moving average. Options include traditional averages like SMA and EMA, and more advanced ones like TEMA, HMA, and ALMA. These smoothed values are used to calculate the final RSI value.
-----------------------------------------------------------------
📈 Why Use Lévy Flight RSI?
This unique RSI indicator captures price momentum with enhanced sensitivity to market dynamics. Whether you’re trend-following, scalping, or identifying reversals, the Lévy Flight RSI provides robust insights to refine your trading decisions.
-----------------------------------------------------------------
🔧 Inputs:
RSI Settings: Control RSI length, calculation source, and smoothing type.
Lévy Flight Settings: Adjust alpha to tune the indicator's responsiveness.
Style Customization: Tailor the appearance with different colour themes and gradients.
-----------------------------------------------------------------

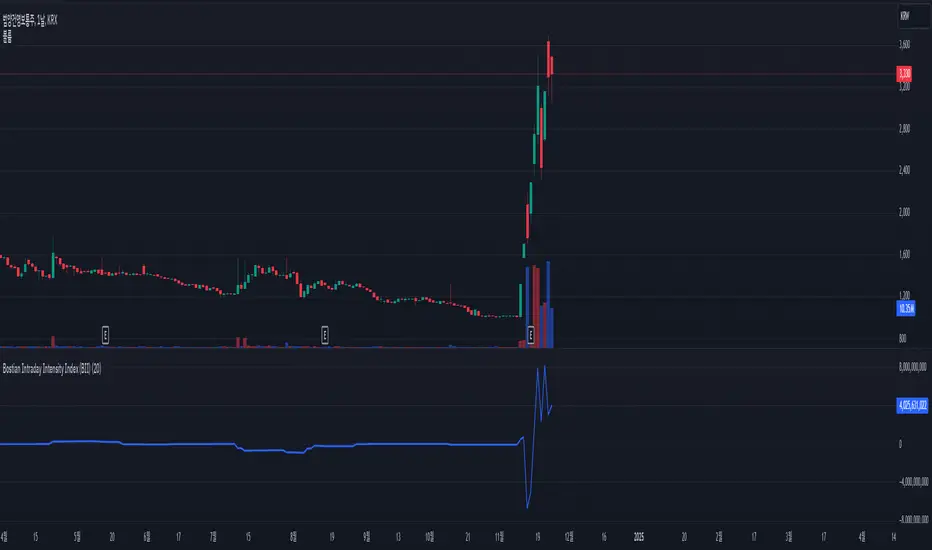
Bostian Intraday Intensity Index (BII)The Bostian Intraday Intensity Index (BII) is a metric used to analyze the trading volume and price movements of a specific stock or asset, measuring the strength and pressure of the market. BII captures buy and sell signals by examining the relationship between trading volume and price fluctuations. Below is an explanation of the key components and calculation method for BII:
○ BII Formula:
sum(V*((C-L)^2-(H-C)^2))/(H-L)))
V (Volume): Trading volume
C (Close): Closing price
L (Low): Lowest price
H (High): Highest price
○ Meaning of the Indicator:
Positive Values: When BII is positive, it indicates strong buying pressure. The closer the closing price is to the high, the stronger the buying pressure.
Negative Values: When BII is negative, it indicates strong selling pressure. The closer the closing price is to the low, the stronger the selling pressure.
○ How to Use:
Buy Signal: When the BII value is positive and trending upwards, it may be considered a buying opportunity.
Sell Signal: When the BII value is negative and trending downwards, it may be considered a selling opportunity.
The BII indicator is useful for analyzing the strength and pressure of the market through the correlation of price movements and trading volume. It helps investors capture buy and sell signals to make better investment decisions.
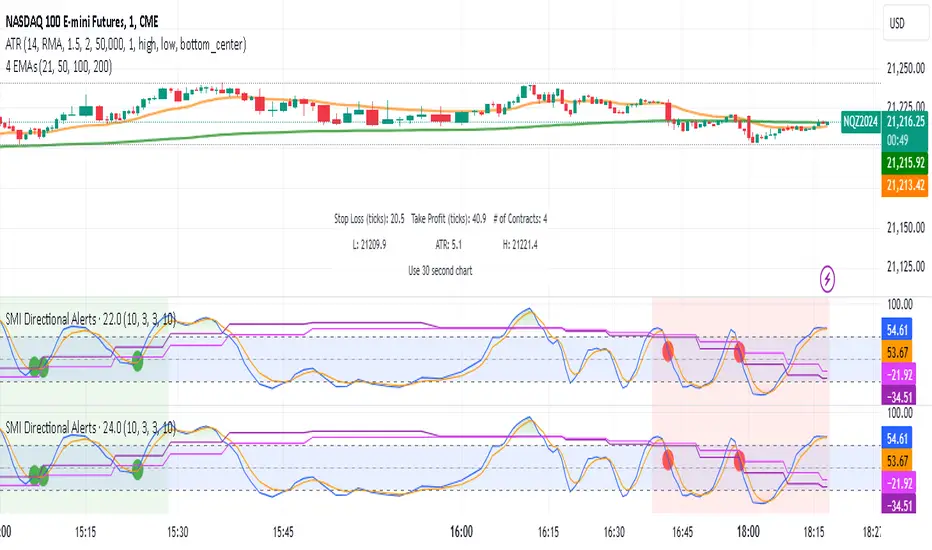
Dual Timeframe Stochastic Momentum Index w/buy sell signalsThis indicator combines momentum analysis across two timeframes to identify high-probability trading opportunities. It plots the Stochastic Momentum Index (SMI) for both the chart timeframe and a higher timeframe (default 10 minutes) to help traders align with the broader market trend.
Key Features
Displays SMI and its EMA for both timeframes
Background shading indicates favorable trading conditions
Signal dots mark potential entry points
Customizable parameters for fine-tuning
Signals Explained
Bullish Signals (Green Dots)
Appear when the chart timeframe SMI crosses above its EMA
Only trigger during periods when the higher timeframe shows:
SMI is above its EMA (increasing momentum)
SMI is between -40 and +40 (not overbought/oversold)
Bearish Signals (Red Dots)
Appear when the chart timeframe SMI crosses below its EMA
Only trigger during periods when the higher timeframe shows:
SMI is below its EMA (decreasing momentum)
SMI is between -40 and +40 (not overbought/oversold)
Settings
%K Length: Lookback period for SMI calculation (default: 10)
%D Length: Smoothing period for primary calculation (default: 3)
EMA Length: Smoothing period for signal line (default: 3)
Alternative Timeframe: Higher timeframe for trend analysis (default: 10 minutes)
Best Practices
Use higher timeframe signals to determine market bias
Wait for signal dots in the chart timeframe for entry timing
Avoid trades when higher timeframe SMI is in extreme zones (above 40 or below -40)
Consider additional confirmation from price action or other indicators
Note: This indicator combines trend and momentum analysis but should be used as part of a complete trading strategy that includes proper risk management.
Tims Smart Money COT-IndexThe **Tims Smart Money COT Index** analyzes the positions of different groups of market participants from the COT report (Commercials, Large Specs, Small Specs). It calculates their net positions and scales them relative to extremes of the last 24 weeks. It indicates bullish and bearish zones to identify market sentiments.
- Commercials (Smart Money)**: Often act against the trend, bullish from 80+.
- Large Specs (Retail Money)**: Trend-following, bullish from 80+.
- Small Specs**: Mostly impulsive, bullish from 80+.
The indicator helps to identify turning points in the market based on the behavior of the players.

Relative Strength Index Custom [BRTLab]RSI Custom — Strategy-Oriented RSI with Multi-Timeframe Precision
The Relative Strength Index Custom is designed with a focus on developing robust trading strategies. This powerful indicator leverages the logic of calculating RSI on higher timeframes (HTFs) while allowing traders to execute trades on lower timeframes (LTFs). Its unique ability to extract accurate RSI data from higher timeframes without waiting for those candles to close provides a real-time advantage, eliminating the "look-ahead" bias that often
distorts backtest results.
Key Features
Multi-Timeframe RSI for Strategy Development
This indicator stands out by allowing you to calculate RSI on higher timeframes, even while operating on lower timeframe charts. This means you can, for example, calculate RSI on the 1-hour or daily chart and execute trades on a 1-minute chart without needing to wait for the higher timeframe candle to close. This feature is crucial for strategy-building as it eliminates backtesting issues where data from the future is inadvertently used, providing more reliable backtest results.
Example: On a 15-minute chart, you can use the 1-hour RSI to open positions based on higher timeframe momentum, but you get this signal in real-time, improving timing and accuracy.
Accurate Data Extraction from Higher Timeframes
The indicator's custom logic ensures that accurate RSI data is retrieved from higher timeframes, providing an edge by delivering timely information for lower timeframe decisions. This prevents delayed signals often encountered when waiting for higher timeframe candles to close, which is crucial for high-frequency and intraday traders looking for precise entries based on multi-timeframe data.
Customizable RSI Settings for Strategy Tuning
The script offers full customization of the RSI, including length and source price (close, open, high, or low), allowing traders to tailor the RSI to fit specific trading strategies. These settings are housed in the "RSI Settings" section, enabling precise adjustments that align with your overall strategy.
No Future-Looking in Backtests
Traditional backtests often suffer from "future-looking" bias, where calculations unintentionally use data from candles that haven’t yet closed. This indicator is specifically designed to prevent such issues by calculating RSI values in real-time. This is particularly important when creating and testing strategies, as it ensures that the conditions under which trades would have been made are accurately represented in historical tests.
RSI-Based Moving Average for Additional Filtering
The built-in moving average (MA) based on RSI values helps filter out noise, making it easier to identify genuine trend shifts. This is particularly useful in strategies where moving average crossovers act as additional confirmation for trade entries and exits.
Overbought and Oversold Zone Detection
Visual gradient fills on the RSI chart help traders identify overbought and oversold zones (above 70 and below 30, respectively). These zones are crucial for timing reversal trades or confirming momentum-based strategies.
How This Indicator Enhances Your Strategy
Increased Accuracy for Intraday Strategies
For traders who operate on lower timeframes, using higher timeframe RSI data gives a broader perspective of market momentum while still maintaining precision for short-term trade entries. The real-time data extraction means you don't need to wait for HTF candles to close, which can dramatically improve your entry timing.
Strategic Edge in Backtesting
One of the greatest challenges in backtesting strategies is avoiding future-looking bias. This indicator is built to overcome this by using real-time multi-timeframe data, ensuring the accuracy and reliability of historical strategy testing, which provides confidence in your strategies when applied to live markets.
Advanced Filtering for Trend Strategies
By combining the RSI values with a customizable moving average (MA) and visualizing key momentum zones with overbought/oversold fills, the indicator allows for more refined trade filters. This ensures that signals generated by your strategy are based on solid momentum data and not short-term price fluctuations.

Volume-Weighted Trend Strength indexVolume-Weighted Trend Strength index (VWTSI)
Introduction
The VWTSI is a custom indicator designed to combine trend strength, volume, and volatility to give traders a comprehensive view of market dynamics. It provides flexibility by allowing you to visualize the indicator as either an oscillator or a moving average.
Features
Dual Visualization: Can be displayed either as an oscillator or as a moving average on the chart.
Volume-Weighted: Adjusts trend strength based on current volume compared to its average.
Volatility-Adjusted: Incorporates market volatility into the trend strength calculation.
Customizable: Various parameters can be fine-tuned to suit different trading environments.
How It Works
1. Trend Strength Calculation
The difference between the fast (10-period) and slow (30-period) EMAs is used to calculate trend strength, which gives a percentage-based indication of the trend's strength
2. Volatility Adjustment
The ATR-based volatility is calculated and used to amplify or reduce the trend strength based on the current market conditions
3. Volume Adjustment
The ratio of current volume to the volume SMA adds another layer of adjustment to the final VWTSI value
4. Final VWTSI Calculation
The VWTSI value is the product of trend strength, volatility factor, and volume ratio
5. Normalization
The final VWTSI is normalized to fit within a range of -100 to 100 for better visualization in oscillator mode
Customization Inputs
Fast EMA Length: Default is 10.
Slow EMA Length: Default is 30.
Volume Length: Default is 14.
Volatility Length (ATR): Default is 20.
Oscillator or MA Mode: Toggle between displaying the indicator as an oscillator or moving average.

Relative Rating Index (RRI)The technical rating is one of the most perfect indicators. The reason is that this indicator is based on a majority vote of multiple indicators. It is logical that the judgment based on a majority vote of multiple indicators would not be inferior to the judgment made using only a single indicator. However, just as any indicator has its shortcomings, the technical rating also has weaknesses. The most significant issue is that it primarily provides only a momentary evaluation of the current situation.
Let's consider this in more detail. In the technical rating, an evaluation of 1.0 by the majority vote of indicators is considered a strong buy. However, in the market, there are naturally varying levels of strength. For example, would a market that only once reached an evaluation of 1.0 within a given period be considered the same as a market that consistently maintains an evaluation of 1.0? The latter clearly shows a stronger trend, but the technical rating does not provide an objective criterion for such differentiation. While it is possible to check the histogram to see how long the buy or sell rating has continued, there is no objective standard for judgment.
The indicator I have created this time compensates for this weakness by using the concept of RSI. As is well known, RSI is an indicator that shows the momentum of the market. RSI typically calculates the strength of the price increase during a 14-period by dividing the total upward movement by the total movement range. Similarly, I thought that if we divide the positive evaluations of the technical rating during a given period by the total evaluations, we could calculate the "momentum of the technical rating," which shows how often positive ratings have appeared during that period.
Below is the calculation formula.
1. Setting the Evaluation Period
Decide the period to calculate (e.g., 14 periods). This is denoted as `n`.
2. Total Positive Ratings of the Technical Rating
Calculate the total number of times the technical rating is evaluated as "strong buy" or "buy" during each period. This is called `positive_sum`.
3. Total Ratings
Count the total number of ratings (including buy, sell, and neutral) during the period. This is called `total_sum`.
4. Calculating the Upward Strength
Divide `positive_sum` by `total_sum` to calculate the ratio of positive ratings in the technical rating. This is called the "ratio of positive ratings."
The ratio of positive ratings, denoted as `P`, is calculated as follows:
P = positive_sum / total_sum
5. Calculating RRI
Following the calculation method of RSI, RRI is calculated by the following formula:
RRI = 100 - (100 / (1 + (P / (1 - P))))
As you can see, the calculation method is similar to that of RSI. Therefore, initially, I intended to name this indicator the Technical Rating RSI. However, RSI calculates based on the difference between the previous bar's price and the current bar's price, whereas this indicator calculates by summing the values of the technical ratings themselves. In the case of prices, if the difference between bars is zero, it indicates a flat market, but in the case of technical rating values, if 1.0 continues for two consecutive periods, it signifies an extremely strong buy rather than a flat market. For this reason, I decided that the calculation method could no longer be considered the same as the traditional RSI, and to avoid confusion, I chose to give this new indicator the name "Relative Rating Index" (RRI), as it provides a new type of numerical evaluation.
The information provided by this indicator is simple. When RRI exceeds 50, it means that more than 50% of the technical rating evaluations during the set period (I recommend 50 periods, but please determine the optimal value based on your timeframe) are buy evaluations. However, since there may be many false signals around exactly 50, I define it as buy-dominant when the value exceeds 60 and sell-dominant when it falls below 40. Additionally, if the graph itself is rising, it indicates that the buying momentum is strengthening, and if it is falling, it indicates that the selling momentum is increasing.
Furthermore, there are lines drawn at 90 and 10, but please note that unlike RSI, these do not indicate overbought or oversold conditions. When RRI exceeds 90, it means that over 90% of the technical rating evaluations during the specified period are buy evaluations, indicating an ongoing extremely strong buy trend. Until the RRI graph turns downward and falls below 90, it should rather be considered a buying opportunity.
With this new indicator, the technical rating becomes an indicator with depth, providing evaluations not only for the moment but over a specified period. I hope you find it helpful in your market analysis.

True Strength Index with Buy/Sell Signals and AlertsThe True Strength Index (TSI) is a momentum oscillator that helps traders identify trends and potential reversal points in the market. Here’s how it works:
1. **Price Change Calculation**:
- **`pc = ta.change(price)`**: This calculates the change in price (current price minus the previous price).
2. **Double Smoothing**:
- **`double_smooth(src, long, short)`**: This function smooths the price change data twice using two Exponential Moving Averages (EMAs):
- The first EMA smooths the raw data.
- The second EMA smooths the result of the first EMA.
- **`double_smoothed_pc`**: The double-smoothed price change.
- **`double_smoothed_abs_pc`**: The double-smoothed absolute price change, which helps normalize the TSI value.
3. **TSI Calculation**:
- **`tsi_value = 100 * (double_smoothed_pc / double_smoothed_abs_pc)`**: This calculates the TSI by dividing the double-smoothed price change by the double-smoothed absolute price change, then multiplying by 100 to scale the value.
- The TSI oscillates around the zero line, indicating momentum. Positive values suggest bullish momentum, while negative values suggest bearish momentum.
4. **Signal Line**:
- **`signal_line = ta.ema(tsi_value, signal)`**: This creates a signal line by applying another EMA to the TSI value. The signal line is typically used to identify entry and exit points.
5. **Buy and Sell Signals**:
- **Buy Signal**: Occurs when the TSI crosses above the signal line (`ta.crossover(tsi_value, signal_line)`), indicating that bullish momentum is strengthening, which might suggest a buying opportunity.
- **Sell Signal**: Occurs when the TSI crosses below the signal line (`ta.crossunder(tsi_value, signal_line)`), indicating that bearish momentum is strengthening, which might suggest a selling opportunity.
6. **Visual Representation**:
- The TSI line and the signal line are plotted on the chart.
- Buy signals are marked with green "BUY" labels below the bars, and sell signals are marked with red "SELL" labels above the bars.
**How to Use It**:
- **Trend Identification**: When the TSI is above zero, it suggests an uptrend; when it's below zero, it suggests a downtrend.
- **Buy/Sell Signals**: Traders often enter a buy trade when the TSI crosses above the signal line and enter a sell trade when the TSI crosses below the signal line.
- **Divergences**: TSI can also be used to spot divergences between the indicator and price action, which can signal potential reversals.
The TSI is particularly useful in identifying the strength of a trend and the potential turning points, making it valuable for trend-following and swing trading strategies.

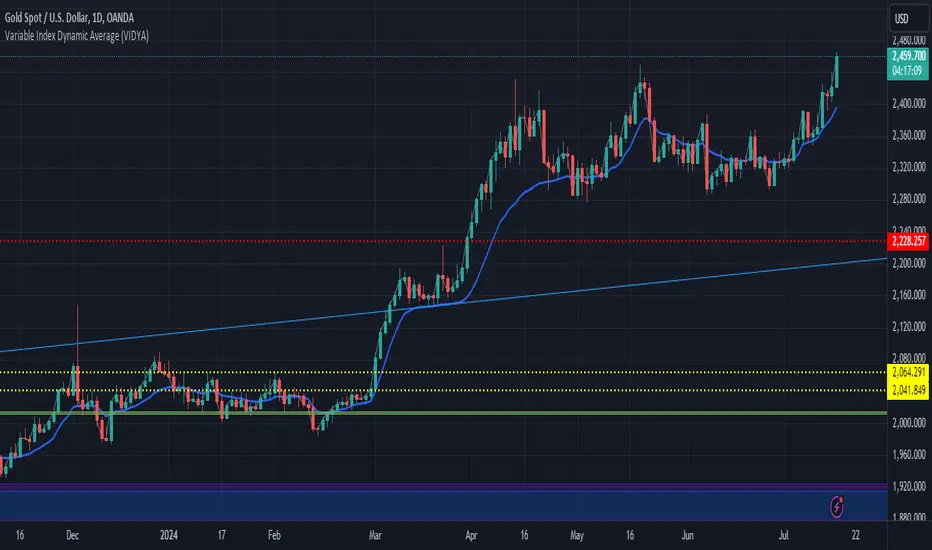
Variable Index Dynamic Average (VIDYA) with HistperThe Variable Index Dynamic Average (VIDYA) is a unique and adaptive moving average indicator designed to respond dynamically to market volatility. It adjusts its smoothing factor based on the standard deviation of price changes, making it more responsive during periods of high volatility and smoother during periods of low volatility. This version includes two key parameters:
Period: The number of bars used to calculate the VIDYA.
HistPer: The number of historical bars used to calculate the standard deviation, affecting the smoothness and responsiveness of the indicator.
Features:
Dynamic Adaptation: VIDYA adjusts its responsiveness based on market conditions, providing a balance between smoothness and responsiveness.
Customizable Parameters: Users can customize the Period and HistPer to fit their specific trading style and asset characteristics.
Overlay on Price Chart: The VIDYA is plotted directly on the price chart for easy visualization and integration with other technical analysis tools.
Usage:
Trend Identification: Use VIDYA to identify the prevailing trend. A rising VIDYA line indicates an uptrend, while a falling VIDYA line indicates a downtrend.
Entry and Exit Signals: Combine VIDYA with other indicators and trading strategies to confirm entry and exit signals.
Volatility Analysis: Adjust the HistPer to see how the indicator responds to different levels of market volatility.
Weighted Global Liquidity Index (WGLI) ROCThe Weighted Global Liquidity Index (WGLI) ROC indicator calculates the rate of change (ROC) of the WGLI, providing valuable insights into the dynamics of global liquidity. The WGLI consolidates major central bank balance sheets and key financial indicators, such as Foreign Exchange Reserves, Interbank Rates, and Interest Rates, converted to USD and expressed in trillions. Specific US accounts like the Treasury General Account (TGA) and Reverse Repurchase Agreements (RRP) are subtracted from the Federal Reserve's balance sheet for a more detailed view of US liquidity.
Using both the WGLI and the WGLI ROC together allows users to track changes in global liquidity and understand policy trajectories and economic conditions. This dual approach offers insights into asset pricing and helps investors make informed decisions about capital allocation.
Feel free to explore and customize the WGLI ROC script to suit your analysis needs!
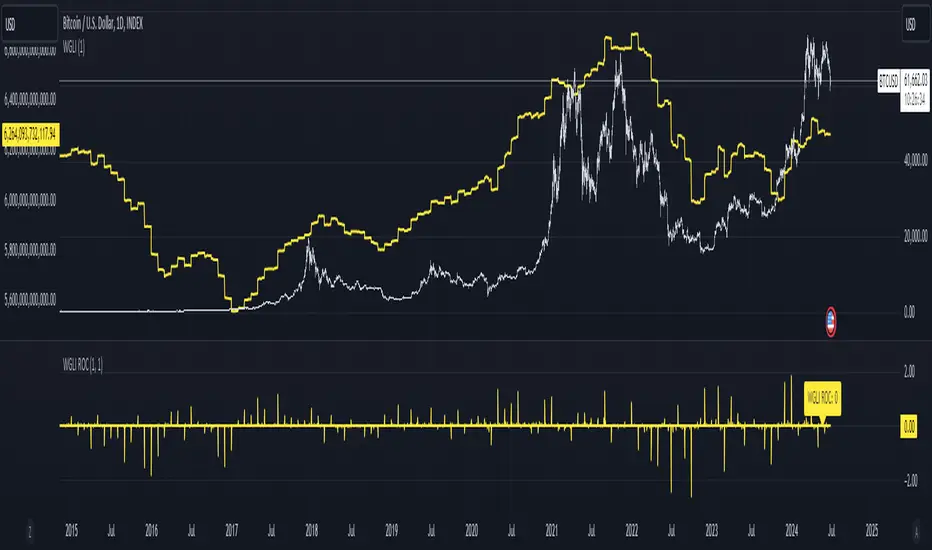
Weighted Global Liquidity Index (WGLI)The Weighted Global Liquidity Index (WGLI) provides a comprehensive view of major central bank balance sheets from around the world, using data converted to USD for consistency and expressed in trillions. This indicator includes specific US accounts like the Treasury General Account (TGA) and Reverse Repurchase Agreements (RRP), which are subtracted from the Federal Reserve's balance sheet to offer a more detailed perspective on US liquidity.
The WGLI incorporates not only the balance sheets but also additional key financial indicators such as Foreign Exchange Reserves, Interbank Rates, and Interest Rates, weighted by their global liquidity importance. The regions and central banks included are:
Federal Reserve System (FED) - Treasury General Account (TGA) - Reverse Repurchase Agreements (RRP)
European Central Bank (ECB)
People's Bank of China (PBC)
Bank of Japan (BOJ)
Bank of England (BOE)
Bank of Canada (BOC)
Reserve Bank of Australia (RBA)
Reserve Bank of India (RBI)
Swiss National Bank (SNB)
Central Bank of the Russian Federation (CBR)
Central Bank of Brazil (BCB)
Bank of Korea (BOK)
Reserve Bank of New Zealand (RBNZ)
Sweden's Central Bank (Riksbank)
Central Bank of Malaysia (BNM)
This tool is designed for anyone interested in gaining a snapshot of global liquidity to interpret macroeconomic trends. By examining these balance sheets and additional indicators, users can understand policy trajectories and evaluate the global economic climate. It also offers insights into asset pricing and helps investors make informed capital allocation decisions.
Feel free to explore and customize the WGLI script on Trading View to suit your analysis needs!

Quantiple Direction IndexThis indicator indicates market trends by analyzing the following signals:
1. RSI which is a momentum oscillator
2. Directional Movement Index (DMI) which measures the direction of the movement
3. Price in comparison to EMA 13 and 21 to determine whether the trend is clear or there is an ambiguity
4. ADX that shows the strength of the momentum
Scoring logic
While we have kept the source code open which gives the scoring logic, for ease of the user, I am summarizing the scoring logic
A. We break down RSI and DMI into a 9 point scale (-4 to +4) from extremely bearish to bullish. Then we give equal weight to both and come out with a direction score.
B. We use EMA to determine if their is clarity in the price trend. While the direction is deduced from point A, if there is clarity we know that the confidence on the direction is high. If EMA 13 is higher than EMA 21 and the price is above EMA 13, then we assign it as a score of +1 as we get clear bullish trend. Similarly if EMA 13 is below EMA 21 and the price is below both the EMAs then we assign it a score of -1 as we get clear bearish trend. Anything else is considered as inconclusive and given a score of 0
C. We use ADX to determine the strength of the directional momentum. It is like acceleration. We use ADX score as an strength adjustment factor. If the value is above 25 - we multiply A+B by 1.25. Similarly we multiply it by 0.75 if the strength is weak and no change if the strength is neutral.
Finally this indicator categorizes market direction into five levels:
- Very Bullish
- Bullish
- Neutral
- Bearish
- Very Bearish
Scores range from +6 (very bullish) to -6 (very bearish), with the user setting thresholds for each category. The midpoint between Bullish and Bearish defines the neutral zone.
Again all the exact values are in the code and the user can also customize as per their trading system.
Why does it make sense to combine these different indicators rather than looking at them in isolation?
We give equal weight to RSI and DMI to derive the direction of the price movement. Using two different indicators provide a better confirmation on the direction. However, this alone is not sufficient.
We want clarity of the direction and for that we use the EMA score (please refer to point B above). If we have clarity, the probability of the direction being right goes up.
Once we know the direction, we want to know what is the strength of that direction. This point is very valuable for an option trader. This is where this indicator brings value.
Please note that by looking at these indicators in isolation one can get a sense of direction or a sense of strength of the direction. But, when you combine them, you get whether the direction move is with strength or not. If you are into option trading, you will clearly understand the rational behind it when you look at the trading rules provided in this description. For example if one knows that the direction is bullish (which one can potentially get from RSI or DMI), one can either buy a call or sell a put. But one knows that not only the direction is bullish, but it has the right acceleration (strength of the momentum), then one will assign higher probability of higher profit from buying call than from selling put.
To summarize we have combined indicators to achieve the following
1. Get confirmation from two different indicators on the direction of the price movement (RSI and DMI)
2. Confirm that the direction is clear (Price relative to EMA)
3. Combine with the strength of the direction (ADX)
Direction, clarity of the direction and the strength of the directional movement is a valuable trading indicator in our opinion.
Suggested trading rules
1. Short strangle strategy when the trend is neutral with one's usual option selling quantity. Equal quantity on put and call.
2. Full quantity short put and half quantity short call when the trend is bullish.
3. Full quantity short put and call long when the indicator is very bullish.
4. Vice versa for bearish ( full call short, half put short) and very bearish (full call short, put long)
Suggested to use 5 min timeframe for scalping, 15 min for intraday positions, 1 hour for weekly and monthly positions, and daily/weekly for investments.
The value of this indicator oscillates between +6 to -6. You can tweak the range for V bullish, bullish, bearish, and v bearish. The values in between will default to the neutral zone.
Disclaimers:
1. While the creator has used this in the live market, no claim is being made on its effectiveness or profit making ability. Please use it for trading only after you have tested it and are satisfied.
2. There may be thousands or millions of better trader in this world than the creator of this script. The creator makes no claim of his intelligence or trading ability.
3. The creator has no intention of selling this particular script now or in future. This is purely for community use and there's no intention to make any monetary profit from it.
4. The creator is not requesting or soliciting anyone to like or promote this script. The creator is also not asking anyone to give him any business now or in future even if they like this script and benefit from it.

RSI AcceleratorThe Relative Strength Index (RSI) is like a fitness tracker for the underlying time series. It measures how overbought or oversold an asset is, which is kinda like saying how tired or energized it is.
When the RSI goes too high, it suggests the asset might be tired and due for a rest, so it could be a sign it's gonna drop. On the flip side, when the RSI goes too low, it's like the asset is pumped up and ready to go, so it might be a sign it's gonna bounce back up. Basically, it helps traders figure out if a stock is worn out or revved up, which can be handy for making decisions about buying or selling.
The RSI Accelerator takes the difference between a short-term RSI(5) and a longer-term RSI(14) to detect short-term movements. When the short-term RSI rises more than the long-term RSI, it typically refers to a short-term upside acceleration.
The conditions of the signals through the RSI Accelerator are as follows:
* A bullish signal is generated whenever the Accelerator surpasses -20 after having been below it.
* A bearish signal is generated whenever the Accelerator breaks 20 after having been above it.

Deck@r True Range IndexThis Pine Script calculates the True Range Index (TRI) using ATR and Fib Levels and uses the result to generate buy and sell signals based on certain conditions.
Here's a breakdown of the code:
Inputs:
atr_period: Determines the period for calculating the Average True Range (ATR), preferred setting at 14.
atr_multiplier: Multiplier used to set the width of the ATR bands preferred setting at 1.
Calculations:
atr_value: Calculates the Average True Range (ATR) using the input period.
upper_band: Calculates the upper band of the ATR bands using a Simple Moving Average (SMA) of the close price plus the ATR multiplied by the multiplier.
lower_band: Calculates the lower band of the ATR bands using a Simple Moving Average (SMA) of the close price minus the ATR multiplied by the multiplier.
midline_75 and midline_25: Calculate midlines at Fibonacci retracement levels of 0.75 and 0.25, respectively, between the upper and lower bands.
Plotting:
Plots the upper and lower bands of the ATR bands.
Optionally plots midlines for the ATR bands (commented out in the code).
Buy and Sell Conditions:
buy_condition: Defines a condition for a buy signal, which occurs when the close price is above the midline at the Fibonacci retracement level of 0.25.
sell_condition: Defines a condition for a sell signal, which occurs when the close price is below the midline at the Fibonacci retracement level of 0.75.
Candle Color:
Sets the candle color based on the buy and sell conditions.
Buy and Sell Signals:
buy_signal: Checks for a buy signal when the close price crosses above the midline at the Fibonacci retracement level of 0.25.
sell_signal: Checks for a sell signal when the close price crosses below the midline at the Fibonacci retracement level of 0.75.
Plots buy and sell signals on the chart.

HSI - Halving Seasonality Index for Bitcoin (BTC) [Logue]Halving Seasonality Index (HSI) for Bitcoin (BTC) - The HSI takes advantage of the consistency of BTC cycles. Past cycles have formed macro tops around 538 days after each halving. Past cycles have formed macro bottoms every 948 days after each halving. Therefore, a linear "risk" curve can be created between the bottom and top dates to measure how close BTC might be to a bottom or a top. The default triggers are set at 98% risk for tops and 5% risk for bottoms. Extensions are also added as defaults to allow easy identification of the dates of the next top or bottom according to the HSI.

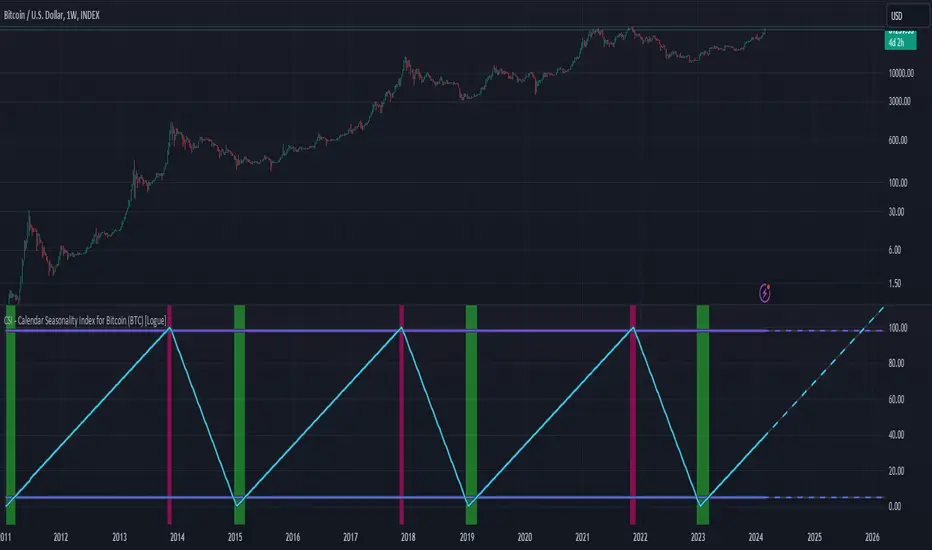
CSI - Calendar Seasonality Index for Bitcoin (BTC) [Logue]Calendar Seasonality Index (CSI) for Bitcoin (BTC) - The CSI takes advantage of the consistency of BTC cycles. Past cycles have formed macro tops every four years near November 21st, starting from in 2013. Past cycles have formed macro bottoms every four years near January 15th, starting from 2011. Therefore, a linear "risk" curve can be created between the bottom and top dates to measure how close BTC might be to a bottom or a top. The default triggers are at 98% risk for tops and 5% risk for bottoms. Extensions are also added as defaults to allow easy identification of the dates of the next top or bottom according to the CSI.
PDM - Plus Directional Movement Weekly BTC Index [Logue]Plus Directional Movement (PDM) weekly BTC index - The PDM is a momentum indicator that measures the strength of a trend in the positive direction. The weekly PDM is calculated by determining the difference between the week's high price and the previous week's high price smoothed by a 14-period moving average. Higher PDM values indicate higher momentum in the positive (higher price) direction. The default triggers for this indicator are PDM values above 55 for tops and below 14 for bottoms.

Broad market index / quantifytools- Overview
Broad market index is a market breadth based oscillator, depicting broad market trend by analysing ratio between symbols moving up and symbols moving down in a given market. When market breadth is positive, more symbols are going up and when negative, more symbols are going down. As markets tend to correlate, broad market trend dictates likely path for all individual symbols that make up the market.
This tool provides market breadth for US equities (based on NYSE advancers - decliners) and ability to build two custom breadth baskets with up to 39 symbols included in each. Market breadth can be customized with variety of smoothing options, weighting and threshold modes to find most optimal rules for trend following. Performance of the model is reflected on metrics showing percentage of up/down moves during bullish/bearish states.
Example
↑ 63% = 63% of price moves during positive breadth state are to the upside
↓ 59% = 59% of price moves during negative breadth state are to the downside
Breadth state is colorized on line and chart according to its state (negative/positive/equilibrium) and direction (trending up/down). Upper and lower bands depict historical turning points in breadth for identifying extremes in broad market trend. Triangles mark breadth thrusts, in other words abnormally large moves in breadth at either upper or lower extreme. Breadth thrusts can serve as early signs of broad market trend reverting.
- Concept and features
By default, market breadth is calculated based on NYSE advancers - decliners, usable for all major indices that depict broad markets in US equities (SP500, QQQ, IWM). Users can also build 2 custom breadth baskets consisting of up to 39 symbols for defining broad market on other asset classes, such as cryptocurrencies. Custom baskets are suitable for any chart that fairly represents a market as a whole.
Example
Basket consisting of cryptocurrencies = Use on CRYPTOCAP:TOTAL (all cryptocurrencies aggregated)
Basket consisting of healthcare stocks = Use on AMEX:XLV (healthcare sector ETF)
Breadth line can be further refined using various smoothing options (SMA, EMA, HMA, RMA, WMA), threshold method and weights. By default, threshold (dividing line between bullish and bearish states) is set to fixed at 0, depicting an equilibrium where equal amount of symbols are going up and down.
Threshold mode can also be set to Dynamic, switching threshold to a moving average of the breadth line. Fundamental functionality still remains, breadth line above threshold marks bullish state and below threshold marks bearish state. Difference here is that the threshold no longer depicts a point of equilibrium, but simply a smoothed version of the breadth line itself, which can catch turns in broad market trend earlier.
Breadth basket can be adjusted to volatility of the viewed chart, causing an overstating of breadth on high volatility and understating on low volatility. Weighting takes into account magnitude of up/down moves, which can provide better relevance for trend following purposes.
- Practical guide
Example #1 : Broad market trend
The utility of market breadth is based on the idea that markets correlate and individual symbols making up the market will eventually join the broad market trend. With this in mind, going against broad market is like swimming upstream, it's going to be the hard way. A well performing basket with clear skew for upside and downside on respective breadth states can be used to form directional bias for trades and risk on/off regimes for investing.
Example #2 : Broad market reversals
Thrusts signify two things: a historical extreme in breadth and an aggressive move to the opposite direction. Thrusts are valuable clues for exhaustion in broad market trend, potentially leading to a reversal.
Example #3 : Breadth/price divergences
Market breadth and price diverging signify events where most symbols that make up the market are going one way but a few high weight symbols (big tech for SP500) are going the other way. In other words, only a few symbols are moving the market while general interest and intention is to the other direction. Divergences in breadth and price are not ideal for sustainable trend and can be expected to eventually revert to the direction of broad market.

Herrick Payoff Index @shrilssThis indicator combines elements of price action, volume, and open interest to provide insights into market strength and potential trend reversals. This script calculates the Herrick Payoff Index (HPI) based on a modified formula that incorporates volume and open interest adjustments.
The HPI is derived from comparing the current day's mean price to the previous day's mean price, factoring in volume and open interest changes. By analyzing these factors, the indicator aims to gauge the effectiveness of market participants' positions.
Key Features:
- HPI Calculation: The HPI value is calculated using the formula: ((M - My) * C * V) * (1 + |OI - OI | / min(OI, OI )), where M represents the mean price for the current day, My represents the mean price for the previous day, C is a constant (set to 1), V is the volume, and OI is the open interest. This adjusted calculation accounts for changes in volume and open interest, providing a more nuanced view of market dynamics.
- Moving Averages: The script also includes two Exponential Moving Averages (EMAs) of the HPI values, allowing traders to identify trends and potential reversal points. Users can customize the length of these moving averages to suit their trading strategies.
- Visual Signals: The indicator visually represents the HPI values and their relationship to the moving averages. When the HPI value is above the shorter-term EMA, it suggests bullish momentum, while values below indicate bearish sentiment.

MUJBOT - Multi-TF RSI Table
The "Multi-TF RSI Table" indicator is a comprehensive tool designed to present traders with a quick visual summary of the Relative Strength Index (RSI) across multiple timeframes, all within a single glance. It is crafted for traders who incorporate multi-timeframe analysis into their trading strategy, aiming to enhance decision-making by identifying overall market sentiment and trend direction. Here's a rundown of its features:
User Inputs: The indicator includes customizable inputs for the RSI and Moving Average (MA) lengths, allowing users to tailor the calculations to their specific trading needs. Additionally, there is an option to display or hide the RSI & MA table as well as to position it in various places on the chart for optimal visibility.
Multi-Timeframe RSI & MA Calculations: It fetches RSI and MA values from different timeframes, such as 1 minute (1m), 5 minutes (5m), 15 minutes (15m), 1 hour (1h), 4 hours (4h), and 1 day (1D). This multi-timeframe approach provides a thorough perspective of the momentum and trend across different market phases.
Trend and Sentiment Analysis: For each timeframe, the script determines whether the average RSI is above or below the MA, categorizing the trend as "Rising", "Falling", or "Neutral". Moreover, it infers market sentiment as "Bullish" or "Bearish", based on the relationship between the RSI and its MA.
Dynamic Color-Coding: The indicator uses color-coding to convey information quickly. It highlights the trend and sentiment cells in the table with green for "Bullish" and red for "Bearish" conditions. It also shades the timeframe cells based on the RSI value, with varying intensities of green for "Oversold" conditions and red for "Overbought" conditions, providing an immediate visual cue of extreme market conditions.
Customization and Adaptability: The script is designed with customization in mind, enabling users to adjust the RSI and MA lengths according to their trading strategy. Its adaptable interface, which offers the option to display or hide the RSI & MA table, ensures that the tool fits into different trading setups without cluttering the chart.
Ease of Use: By consolidating critical information into a simple table, the "Multi-TF RSI Table" indicator saves time and simplifies the analysis process for traders. It eliminates the need to switch between multiple charts or timeframes, thus streamlining the trading workflow.
In essence, the "Multi-TF RSI Table" is a powerful indicator for Pine Script users on TradingView, offering a multi-dimensional view of market dynamics. It is ideal for both novice and experienced traders who seek to enhance their technical analysis with an at-a-glance summary of RSI trends and market sentiment across various timeframes.

Premium Index Change with MAPremium Index // Capture close price difference with given ticker (ex. BITFINEX:BTCUSD - BINANCE:BTCUSDT)

Momentum Bias Index [AlgoAlpha]Description:
The Momentum Bias Index by AlgoAlpha is designed to provide traders with a powerful tool for assessing market momentum bias. The indicator calculates the positive and negative bias of momentum to gauge which one is greater to determine the trend.
Key Features:
Comprehensive Momentum Analysis: The script aims to detect momentum-trend bias, typically when in an uptrend, the momentum oscillator will oscillate around the zero line but will have stronger positive values than negative values, similarly for a downtrend the momentum will have stronger negative values. This script aims to quantify this phenomenon.
Overlay Mode: Traders can choose to overlay the indicator on the price chart for a clear visual representation of market momentum.
Take-profit Signals: The indicator includes signals to lock in profits, they appear as labels in overlay mode and as crosses when overlay mode is off.
Impulse Boundary: The script includes an impulse boundary, the impulse boundary is a threshold to visualize significant spikes in momentum.
Standard Deviation Multiplier: Users can adjust the standard deviation multiplier to increase the noise tolerance of the impulse boundary.
Bias Length Control: Traders can customize the length for evaluating bias, enabling them to fine-tune the indicator according to their trading preferences. A higher length will give a longer-term bias in trend.
