Crypto Options Greeks & Volatility Analyzer [BackQuant]Crypto Options Greeks & Volatility Analyzer
Overview
The Crypto Options Greeks & Volatility Analyzer is a comprehensive analytical tool that calculates Black-Scholes option Greeks up to the third order for Bitcoin and Ethereum options. It integrates implied volatility data from VOLMEX indices and provides multiple visualization layers for options risk analysis.
Quick Introduction to Options Trading
Options are financial derivatives that give the holder the right, but not the obligation, to buy or sell an underlying asset at a predetermined price (strike price) within a specific time period (expiration date). Understanding options requires grasping two fundamental concepts:
Call Options : Give the right to buy the underlying asset at the strike price. Calls increase in value when the underlying price rises above the strike price.
Put Options : Give the right to sell the underlying asset at the strike price. Puts increase in value when the underlying price falls below the strike price.
The Language of Options: Greeks
Options traders use "Greeks" - mathematical measures that describe how an option's price changes in response to various factors:
Delta : How much the option price moves for each $1 change in the underlying
Gamma : How fast delta changes as the underlying moves
Theta : Daily time decay - how much value erodes each day
Vega : Sensitivity to implied volatility changes
Rho : Sensitivity to interest rate changes
These Greeks are essential for understanding risk. Just as a pilot needs instruments to fly safely, options traders need Greeks to navigate market conditions and manage positions effectively.
Why Volatility Matters
Implied volatility (IV) represents the market's expectation of future price movement. High IV means:
Options are more expensive (higher premiums)
Market expects larger price swings
Better for option sellers
Low IV means:
Options are cheaper
Market expects smaller moves
Better for option buyers
This indicator helps you visualize and quantify these critical concepts in real-time.
Back to the Indicator
Key Features & Components
1. Complete Greeks Calculations
The indicator computes all standard Greeks using the Black-Scholes-Merton model adapted for cryptocurrency markets:
First Order Greeks:
Delta (Δ) : Measures the rate of change of option price with respect to underlying price movement. Ranges from 0 to 1 for calls and -1 to 0 for puts.
Vega (ν) : Sensitivity to implied volatility changes, expressed as price change per 1% change in IV.
Theta (Θ) : Time decay measured in dollars per day, showing how much value erodes with each passing day.
Rho (ρ) : Interest rate sensitivity, measuring price change per 1% change in risk-free rate.
Second Order Greeks:
Gamma (Γ) : Rate of change of delta with respect to underlying price, indicating how quickly delta will change.
Vanna : Cross-derivative measuring delta's sensitivity to volatility changes and vega's sensitivity to price changes.
Charm : Delta decay over time, showing how delta changes as expiration approaches.
Vomma (Volga) : Vega's sensitivity to volatility changes, important for volatility trading strategies.
Third Order Greeks:
Speed : Rate of change of gamma with respect to underlying price (∂Γ/∂S).
Zomma : Gamma's sensitivity to volatility changes (∂Γ/∂σ).
Color : Gamma decay over time (∂Γ/∂T).
Ultima : Third-order volatility sensitivity (∂²ν/∂σ²).
2. Implied Volatility Analysis
The indicator includes a sophisticated IV ranking system that analyzes current implied volatility relative to its recent history:
IV Rank : Percentile ranking of current IV within its 30-day range (0-100%)
IV Percentile : Percentage of days in the lookback period where IV was lower than current
IV Regime Classification : Very Low, Low, High, or Very High
Color-Coded Headers : Visual indication of volatility regime in the Greeks table
Trading regime suggestions based on IV rank:
IV Rank > 75%: "Favor selling options" (high premium environment)
IV Rank 50-75%: "Neutral / Sell spreads"
IV Rank 25-50%: "Neutral / Buy spreads"
IV Rank < 25%: "Favor buying options" (low premium environment)
3. Gamma Zones Visualization
Gamma zones display horizontal price levels where gamma exposure is highest:
Purple horizontal lines indicate gamma concentration areas
Opacity scaling : Darker shading represents higher gamma values
Percentage labels : Shows gamma intensity relative to ATM gamma
Customizable zones : 3-10 price levels can be analyzed
These zones are critical for understanding:
Pin risk around expiration
Potential for explosive price movements
Optimal strike selection for gamma trading
Market maker hedging flows
4. Probability Cones (Expected Move)
The probability cones project expected price ranges based on current implied volatility:
1 Standard Deviation (68% probability) : Shown with dashed green/red lines
2 Standard Deviations (95% probability) : Shown with dotted green/red lines
Time-scaled projection : Cones widen as expiration approaches
Lognormal distribution : Accounts for positive skew in asset prices
Applications:
Strike selection for credit spreads
Identifying high-probability profit zones
Setting realistic price targets
Risk management for undefined risk strategies
5. Breakeven Analysis
The indicator plots key price levels for options positions:
White line : Strike price
Green line : Call breakeven (Strike + Premium)
Red line : Put breakeven (Strike - Premium)
These levels update dynamically as option premiums change with market conditions.
6. Payoff Structure Visualization
Optional P&L labels display profit/loss at expiration for various price levels:
Shows P&L at -2 sigma, -1 sigma, ATM, +1 sigma, and +2 sigma price levels
Separate calculations for calls and puts
Helps visualize option payoff diagrams directly on the chart
Updates based on current option premiums
Configuration Options
Calculation Parameters
Asset Selection : BTC or ETH (limited by VOLMEX IV data availability)
Expiry Options : 1D, 7D, 14D, 30D, 60D, 90D, 180D
Strike Mode : ATM (uses current spot) or Custom (manual strike input)
Risk-Free Rate : Adjustable annual rate for discounting calculations
Display Settings
Greeks Display : Toggle first, second, and third-order Greeks independently
Visual Elements : Enable/disable probability cones, gamma zones, P&L labels
Table Customization : Position (6 options) and text size (4 sizes)
Price Levels : Show/hide strike and breakeven lines
Technical Implementation
Data Sources
Spot Prices : INDEX:BTCUSD and INDEX:ETHUSD for underlying prices
Implied Volatility : VOLMEX:BVIV (Bitcoin) and VOLMEX:EVIV (Ethereum) indices
Real-Time Updates : All calculations update with each price tick
Mathematical Framework
The indicator implements the full Black-Scholes-Merton model:
Standard normal distribution approximations using Abramowitz and Stegun method
Proper annualization factors (365-day year)
Continuous compounding for interest rate calculations
Lognormal price distribution assumptions
Alert Conditions
Four categories of automated alerts:
Price-Based : Underlying crossing strike price
Gamma-Based : 50% surge detection for explosive moves
Moneyness : Deep ITM alerts when |delta| > 0.9
Time/Volatility : Near expiration and vega spike warnings
Practical Applications
For Options Traders
Monitor all Greeks in real-time for active positions
Identify optimal entry/exit points using IV rank
Visualize risk through probability cones and gamma zones
Track time decay and plan rolls
For Volatility Traders
Compare IV across different expiries
Identify mean reversion opportunities
Monitor vega exposure across strikes
Track higher-order volatility sensitivities
Conclusion
The Crypto Options Greeks & Volatility Analyzer transforms complex mathematical models into actionable visual insights. By combining institutional-grade Greeks calculations with intuitive overlays like probability cones and gamma zones, it bridges the gap between theoretical options knowledge and practical trading application.
Whether you're:
A directional trader using options for leverage
A volatility trader capturing IV mean reversion
A hedger managing portfolio risk
Or simply learning about options mechanics
This tool provides the quantitative foundation needed for informed decision-making in cryptocurrency options markets.
Remember that options trading involves substantial risk and complexity. The Greeks and visualizations provided by this indicator are tools for analysis - they should be combined with proper risk management, position sizing, and a thorough understanding of options strategies.
As crypto options markets continue to mature and grow, having professional-grade analytics becomes increasingly important. This indicator ensures you're equipped with the same analytical capabilities used by institutional traders, adapted specifically for the unique characteristics of 24/7 cryptocurrency markets.
Search in scripts for "index"

Bilateral Filter For Loop [BackQuant]Bilateral Filter For Loop
The Bilateral Filter For Loop is an advanced technical indicator designed to filter out market noise and smooth out price data, thus improving the identification of underlying market trends. It employs a bilateral filter, which is a sophisticated non-linear filter commonly used in image processing and price time series analysis. By considering both spatial and range differences between price points, this filter is highly effective at preserving significant trends while reducing random fluctuations, ultimately making it suitable for dynamic trend-following strategies.
Please take the time to read the following:
Key Features
1. Bilateral Filter Calculation:
The bilateral filter is the core of this indicator and works by applying a weight to each data point based on two factors: spatial distance and price range difference. This dual weighting process allows the filter to preserve important price movements while reducing the impact of less relevant fluctuations. The filter uses two primary parameters:
Spatial Sigma (σ_d): This parameter adjusts the weight applied based on the distance of each price point from the current price. A larger spatial sigma means more smoothing, as further away values will contribute more heavily to the result.
Range Sigma (σ_r): This parameter controls how much weight is applied based on the difference in price values. Larger price differences result in smaller weights, while similar price values result in larger weights, thereby preserving the trend while filtering out noise.
The output of this filter is a smoothed version of the original price series, which eliminates short-term fluctuations, helping traders focus on longer-term trends. The bilateral filter is applied over a rolling window, adjusting the level of smoothing dynamically based on both the distance between values and their relative price movements.
2. For Loop Calculation for Trend Scoring:
A for-loop is used to calculate the trend score based on the filtered price data. The loop compares the current value to previous values within the specified window, scoring the trend as follows:
+1 for upward movement (when the filtered value is greater than the previous value).
-1 for downward movement (when the filtered value is less than the previous value).
The cumulative result of this loop gives a continuous trend score, which serves as a directional indicator for the market's momentum. By summing the scores over the window period, the loop provides an aggregate value that reflects the overall trend strength. This score helps determine whether the market is experiencing a strong uptrend, downtrend, or sideways movement.
3. Long and Short Conditions:
Once the trend score has been calculated, it is compared against predefined threshold levels:
A long signal is generated when the trend score exceeds the upper threshold, indicating that the market is in a strong uptrend.
A short signal is generated when the trend score crosses below the lower threshold, signaling a potential downtrend or trend reversal.
These conditions provide clear signals for potential entry points, and the color-coding helps traders quickly identify market direction:
Long signals are displayed in green.
Short signals are displayed in red.
These signals are designed to provide high-confidence entries for trend-following strategies, helping traders capture profitable movements in the market.
4. Trend Background and Bar Coloring:
The script offers customizable visual settings to enhance the clarity of the trend signals. Traders can choose to:
Color the bars based on the trend direction: Bars are colored green for long signals and red for short signals.
Change the background color to provide additional context: The background will be shaded green for a bullish trend and red for a bearish trend. This visual feedback helps traders to stay aligned with the prevailing market sentiment.
These features offer a quick visual reference for understanding the market's direction, making it easier for traders to identify when to enter or exit positions.
5. Threshold Lines for Visual Feedback:
Threshold lines are plotted on the chart to represent the predefined long and short levels. These lines act as clear markers for when the market reaches a critical threshold, triggering a potential buy (long) or sell (short) signal. By showing these threshold lines on the chart, traders can quickly gauge the strength of the market and assess whether the trend is strong enough to warrant action.
These thresholds can be adjusted based on the trader's preferences, allowing them to fine-tune the indicator for different market conditions or asset behaviors.
6. Customizable Parameters for Flexibility:
The indicator offers several parameters that can be adjusted to suit individual trading preferences:
Window Period (Bilateral Filter): The window size determines how many past price values are used to calculate the bilateral filter. A larger window increases smoothing, while a smaller window results in more responsive, but noisier, data.
Spatial Sigma (σ_d) and Range Sigma (σ_r): These values control how sensitive the filter is to price changes and the distance between data points. Fine-tuning these parameters allows traders to adjust the degree of noise reduction applied to the price series.
Threshold Levels: The upper and lower thresholds determine when the trend score crosses into long or short territory. These levels can be customized to better match the trader's risk tolerance or asset characteristics.
Visual Settings: Traders can customize the appearance of the chart, including the line width of trend signals, bar colors, and background shading, to make the indicator more readable and aligned with their charting style.
7. Alerts for Trend Reversals:
The indicator includes alert conditions for real-time notifications when the market crosses the defined thresholds. Traders can set alerts to be notified when:
The trend score crosses the long threshold, signaling an uptrend.
The trend score crosses the short threshold, signaling a downtrend.
These alerts provide timely information, allowing traders to take immediate action when the market shows a significant change in direction.
Final Thoughts
The Bilateral Filter For Loop indicator is a robust tool for trend-following traders who wish to reduce market noise and focus on the underlying trend. By applying the bilateral filter and calculating trend scores, this indicator helps traders identify strong uptrends and downtrends, providing reliable entry signals with minimal market noise. The customizable parameters, visual feedback, and alerting system make it a versatile tool for traders seeking to improve their timing and capture profitable market movements.
Thus following all of the key points here are some sample backtests on the 1D Chart
Disclaimer: Backtests are based off past results, and are not indicative of the future.
INDEX:BTCUSD
INDEX:ETHUSD
CRYPTO:SOLUSD

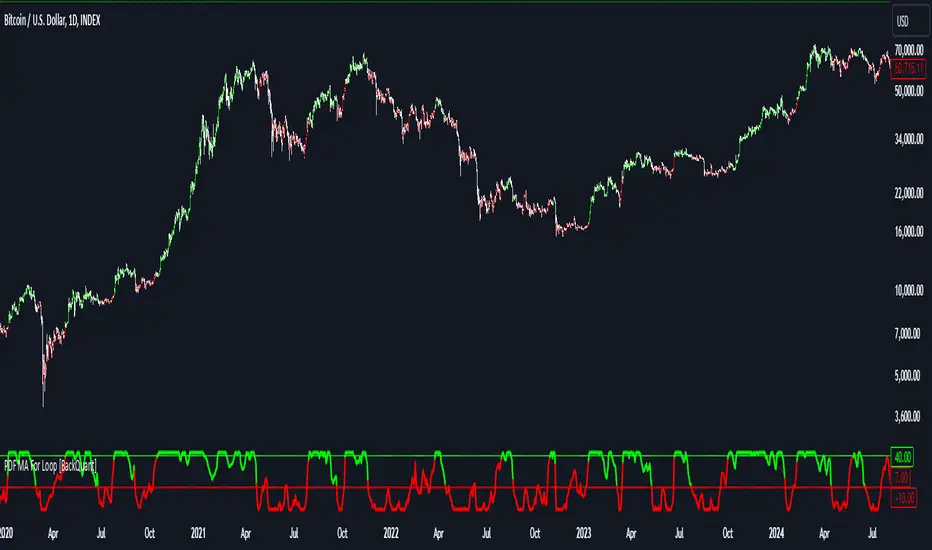
PDF MA For Loop [BackQuant]PDF MA For Loop
Introducing the PDF MA For Loop, an innovative trading indicator that combines Probability Density Function (PDF) smoothing with a dynamic for-loop scoring mechanism. This advanced tool provides traders with precise trend-following signals, helping to identify long and short opportunities with improved clarity and adaptability to market conditions.
If you would like to check out the stand alone PDF Moving Average:
Core Concept: Probability Density Function (PDF) Smoothing
The PDF smoothing method is a unique approach that applies adaptive weights to price data based on a Probability Density Function. This ensures that recent data points receive appropriate emphasis while maintaining a smooth transition across the data set. The result is a moving average that is not only smoother but also more responsive to market changes.
Key parameters in PDF smoothing:
Variance : Controls the spread of the PDF, where a higher value results in broader smoothing and a lower value makes the moving average more sensitive.
Mean : Centers the PDF around a specific value, influencing the weighting and responsiveness of the smoothing process.
By combining PDF smoothing with traditional moving averages (EMA or SMA), the indicator creates a hybrid signal that balances responsiveness and reliability.
For-Loop Scoring Mechanism
At the heart of this indicator is the for-loop scoring mechanism, which evaluates the smoothed PDF moving average over a defined range of historical data points. This process assigns a score to the current market condition based on whether the PDF moving average is greater than or less than previous values.
Long Signal: A long signal is generated when the score exceeds the Long Threshold (default set at 40), indicating upward momentum.
Short Signal: A short signal is triggered when the score crosses below the Short Threshold (default set at -10), suggesting potential downward momentum.
This dynamic scoring system ensures that the indicator remains adaptive, capturing trends and shifts in market sentiment effectively.
Customization Options
The PDF MA For Loop includes a variety of customizable settings to fit different trading styles and strategies:
Calculation Settings
Price Source : Select the input price for the calculation (default is the close price).
Smoothing Method : Choose between EMA or SMA for the additional smoothing layer, providing flexibility to adapt to market conditions.
Smoothing Period : Adjust the lookback period for the smoothing function, with shorter periods providing more sensitivity and longer periods offering greater stability.
Variance & Mean : Fine-tune the PDF function parameters to control the weighting of the smoothing process.
Signal Settings
Thresholds : Customize the upper and lower thresholds to define the sensitivity of the long and short signals.
For Loop Range : Set the range of historical data points analyzed by the for-loop, influencing the depth of the scoring mechanism.
UI Settings
Signal Line Width: Adjust the thickness of the plotted signal line for better visibility.
Candle Coloring: Enable or disable the coloring of candlesticks based on trend direction (green for long, red for short, gray for neutral).
Background Coloring: Add background shading to highlight long and short signals for an enhanced visual experience.
Alerts and Automation
The indicator includes built-in alert conditions to notify traders of important market events:
Long Signal Alert: Notifies when the score exceeds the upper threshold, indicating a bullish trend.
Short Signal Alert: Notifies when the score crosses below the lower threshold, signaling a bearish trend.
These alerts can be configured for real-time notifications, allowing traders to respond quickly to market changes without constant chart monitoring.
Trading Applications
The PDF MA For Loop is versatile and can be applied across various trading strategies and market conditions:
Trend Following: The PDF smoothing method combined with for-loop scoring makes this indicator particularly effective for identifying and following trends.
Reversal Trading: By observing the thresholds and score, traders can anticipate potential reversals when the trend shifts from long to short (or vice versa).
Risk Management: The dynamic thresholds and scoring provide clear signals, allowing traders to enter and exit trades with greater confidence and precision.
Final Thoughts
The PDF MA For Loopis merges advanced mathematical concepts with practical trading tools. By leveraging Probability Density Function smoothing and a dynamic for-loop scoring system, it provides traders with clear, actionable signals while adapting to market conditions.
Whether you’re looking for an edge in trend-following strategies or seeking precision in identifying reversals, this indicator offers the flexibility and power to enhance your trading decisions
As always, backtesting and integrating the PDF MA For Loop into a comprehensive trading strategy is recommended for optimal performance, as no single indicator should be used in isolation.
Thus following all of the key points here are some sample backtests on the 1D Chart
Disclaimer: Backtests are based off past results, and are not indicative of the future.
INDEX:BTCUSD
INDEX:ETHUSD
BINANCE:SOLUSD
ToolsPosLibrary "ToolsPos"
Library for general purpose position helpers
new_pos(state, price, when, index)
Returns new PosInfo object
Parameters:
state (series PosState) : Position state
price (float) : float Entry price
when (int) : int Entry bar time UNIX. Default: time
index (int) : int Entry bar index. Default: bar_index
Returns: PosInfo
new_tp(pos, price, when, index, info)
Returns PosInfo object with new take profit info object
Parameters:
pos (PosInfo) : PosInfo object
price (float) : float Entry price
when (int) : int Entry bar time UNIX. Default: time
index (int) : int Entry bar index. Default: bar_index
info (Info type from aybarsm/Tools/14) : Info holder object. Default: na
Returns: PosInfo
new_re(pos, price, when, index, info)
Returns PosInfo object with new re-entry info object
Parameters:
pos (PosInfo) : PosInfo object
price (float) : float Entry price
when (int) : int Entry bar time UNIX. Default: time
index (int) : int Entry bar index. Default: bar_index
info (Info type from aybarsm/Tools/14) : Info holder object. Default: na
Returns: PosInfo
PosTPInfo
PosTPInfo - Position Take Profit info object
Fields:
price (series float) : float Take profit price
when (series int) : int Take profit bar time UNIX. Default: time
index (series int) : int Take profit bar index. Default: bar_index
info (Info type from aybarsm/Tools/14) : Info holder object
PosREInfo
PosREInfo - Position Re-Entry info object
Fields:
price (series float) : float Re-entry price
when (series int) : int Re-entry bar time UNIX. Default: time
index (series int) : int Take profit bar index. Default: bar_index
info (Info type from aybarsm/Tools/14) : Info holder object
PosInfo
PosInfo - Position info object
Fields:
state (series PosState) : Position state
price (series float) : float Entry price
when (series int) : int Entry bar time UNIX. Default: time
index (series int) : int Entry bar index. Default: bar_index
tp (array) : PosTPInfo Take profit info. Default: na
re (array) : PosREInfo Re-entry info. Default: na
info (Info type from aybarsm/Tools/14) : Info holder object

Financial Conditions Composite Z-Score1. Inputs and Data Sources
The script pulls data for the following financial metrics using TradingView's request.security function:
CBOE:VIX (Volatility Index): A measure of market volatility.
MOVE Index: A measure of bond market volatility (or Treasury volatility).
BAMLH0A0HYM2 (High-Yield Spread): The spread between high-yield corporate bonds and Treasury yields.
BAMLC0A0CM (Credit Spread): The spread for investment-grade corporate bonds.
Each of these metrics represents a key aspect of financial conditions:
VIX: Equity market risk.
MOVE: Bond market risk.
High-Yield Spread and Credit Spread: Perception of risk in corporate debt.
2. Z-Score Calculation
A z-score standardizes each metric to show how far it deviates from its average over a specified period (lookback = 160, or 160 days):
Positive z-scores indicate the metric is higher than average.
Negative z-scores indicate the metric is lower than average.
The formula for the z-score:
Z-Score = Metric − Mean
Standard Deviation Z-Score = Standard Deviation Metric−Mean
3. Combined Z-Score
The script combines the four individual z-scores into a single Composite Z-Score, equally weighted across the metrics:
Combined Z-Score = (Z VIX + Z MOVE + Z High-Yield Spread + Z Credit Spread) / 4
This Combined Z-Score provides an overall measure of financial conditions:
Positive combined z-scores indicate tighter or riskier financial conditions.
Negative combined z-scores indicate looser or less risky financial conditions.
4. Visual Elements on the Chart
A. Colorful Lines: Individual Z-Scores
Each of the four metrics is plotted as a separate line:
Red: Z-score of the VIX.
Green: Z-score of the MOVE index.
Orange: Z-score of the high-yield spread.
Purple: Z-score of the credit spread.
These lines show how each metric contributes to the overall financial conditions. For example:
A rising red line means increasing equity market volatility (risk).
A rising green line means increasing bond market volatility (risk).
B. Blue Line: Combined Z-Score
The blue line represents the Combined Z-Score. It aggregates the individual z-scores into a single measure:
A rising blue line suggests financial conditions are tightening (greater risk across markets).
A falling blue line suggests financial conditions are loosening (lower risk across markets).
C. Red and Green Background: Z-Score Regions
Red Background: When the Combined Z-Score is positive (>0), it indicates riskier or tighter financial conditions.
Green Background: When the Combined Z-Score is negative (<0), it indicates less risky or looser financial conditions.
This background coloring helps visually distinguish periods of riskier financial conditions from less risky ones.
5. Purpose of the Visualization
This indicator provides a comprehensive view of financial conditions across multiple asset classes:
Traders can use it to gauge the level of systemic market stress.
Investors can use it to assess when risk is elevated (positive z-scores) or subdued (negative z-scores).
It helps in decision-making for strategies that depend on market volatility or risk appetite.
Summary of What You See:
Colorful Lines (Red, Green, Orange, Purple): Individual z-scores for each metric (VIX, MOVE, high-yield spread, credit spread).
Blue Line: The aggregated Combined Z-Score that summarizes financial conditions.
Red and Green Background:
Red: Tight or risky financial conditions (Combined Z-Score > 0).
Green: Loose or low-risk financial conditions (Combined Z-Score < 0).
This visualization provides a multi-dimensional view of financial conditions at a glance, helping to identify periods of high or low risk in the markets.

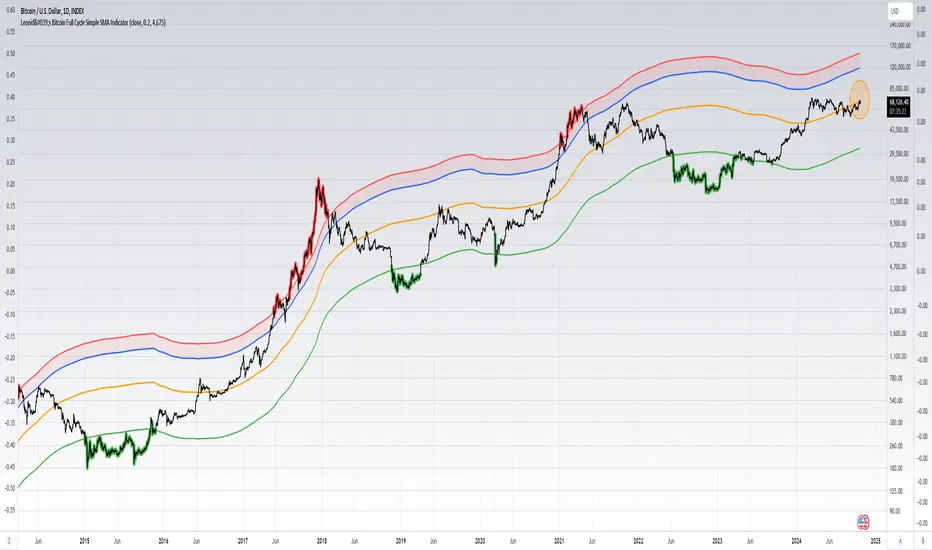
Leonid's Bitcoin Full Cycle Simple SMA IndicatorThis is a straight-forward and customizable indicator to track Bitcoin cycles, specifically used for helping investors understand where to buy and sell. This is done by using a two year SMA period as the base calculation. With that calculation you create lower and upper bounds for bull market peaks and bear market bottoms.
The novel idea here is that you can customize the SMA "strength" for both the upper and lower bounds as alpha decays over time and price get's less volatile with adoption increasing. The multiples are customizable for both the upper and lower bounds along with a mid-line that will adjust based on the settings input.
Indicators don't always have to rely on crazy math or outlandish ideas to be useful, sometimes even the simplest of inputs can give investors (especially those that are new) a great base case for their strategy. Something being simple does not diminish the idea or strength behind the data.
How to use this indicator: This script must be used on INDEX:BTCUSD (Bitcoin All-Time History Index) with the y-axis being set to Logarithmic scale.
Details & how to interpret: The price is colored green when Bitcoin enters a "value zone" meaning it is heavily oversold and likely near a bottom for the bear market cycle. The price is colored red when Bitcoin enters an "overbought zone" meaning it is heavily overbought and is likely near a top for the bull market cycle.
Along with the upper and lower bound I have plotted a mid-line (in orange) to establish a neutral zone which helps depict what phase of the cycle we're in (under mid-line = bearish/accumulation phase, over mid-line = bullish/distribution phase).
The inputs for the upper and lower bound are customizable and will need to be adjusted over time as alpha decay will occur as time goes on. Currently the numbers are as follows:
0.2 for the lower bound
4.675 for the upper bound
Both inputs can be modified depending on your risk tolerance. Mathematically it is safe to assume these numbers will decrease as time goes on and volatility during cycle peaks & troughs is reduced.
I've also plotted an upper bound "heat zone" which is shaded in green, this area is great for signaling when you should be preparing to begin taking profits. It takes the upper bound and subtracts the lower bound to derive the band.
All the colors are customizable and this indicator is best used on a line chart but can be customized to use on a bar chart/candlestick as well.
Simple Moving Averages are a very basic indicator but are often extremely powerful because the majority of traders/investors are looking at such levels which creates a psychological/herd effect. Another good example is the law of round numbers.
Regardless this script can be adapted with EMAs or additional standard deviations if necessary. If you have any questions or concerns please don't hesitate to message me.
Adaptive Gaussian MA For Loop [BackQuant]Adaptive Gaussian MA For Loop
PLEASE Read the following carefully before applying this indicator to your trading system. Knowing the core logic behind the tools you're using allows you to integrate them into your strategy with confidence and precision.
Introducing BackQuant's Adaptive Gaussian Moving Average For Loop (AGMA FL) — a sophisticated trading indicator that merges the Gaussian Moving Average (GMA) with adaptive volatility to provide dynamic trend analysis. This unique indicator further enhances its effectiveness by utilizing a for-loop scoring mechanism to detect potential shifts in market direction. Let's dive into the components, the rationale behind them, and how this indicator can be practically applied to your trading strategies.
Understanding the Gaussian Moving Average (GMA)
The Gaussian Moving Average (GMA) is a smoothed moving average that applies Gaussian weighting to price data. Gaussian weighting gives more significance to data points near the center of the lookback window, making the GMA particularly effective at reducing noise while maintaining sensitivity to changes in price direction. In contrast to simpler moving averages like the SMA or EMA, GMA provides a more refined smoothing function, which can help traders follow the true trend in volatile markets.
In this script, the GMA is calculated over a defined Calculation Period (default 14), applying a Gaussian filter to smooth out market fluctuations and provide a clearer view of underlying trends.
Adaptive Volatility: A Dynamic Edge
The Adaptive feature in this indicator gives it the ability to adjust its sensitivity based on current market volatility. If the Adaptive option is enabled, the GMA uses a standard deviation-based volatility measure (with a default period of 20) to dynamically adjust the width of the Gaussian filter, allowing the GMA to react faster in volatile markets and more slowly in calm conditions. This dynamic nature ensures that the GMA stays relevant across different market environments.
When the Adaptive setting is disabled, the script defaults to a constant standard deviation value (default 1.0), providing a more stable but less responsive smoothing function.
Why Use Adaptive Gaussian Moving Average?
The Gaussian Moving Average already provides smoother results than standard moving averages, but by adding an adaptive component, the indicator becomes even more responsive to real-time price changes. In fast-moving or highly volatile markets, this adaptation allows traders to react quicker to emerging trends. Conversely, in quieter markets, it reduces over-sensitivity to minor fluctuations, thus lowering the risk of false signals.
For-Loop Scoring Mechanism
The heart of this indicator lies in its for-loop scoring system, which evaluates the smoothed price data (the GMA) over a specified range, comparing it to previous values. This scoring system assigns a numerical value based on whether the current GMA is higher or lower than previous values, creating a trend score.
Long Signals: These are generated when the for-loop score surpasses the Long Threshold (default set at 40), signaling that the GMA is gaining upward momentum, potentially identifying a favorable buying opportunity.
Short Signals: These are triggered when the score crosses below the Short Threshold (default set at -10), indicating that the market may be losing strength and that a selling or shorting opportunity could be emerging.
Thresholds & Customization Options
This indicator offers a high degree of flexibility, allowing you to fine-tune the settings according to your trading style and risk preferences:
Calculation Period: Adjust the lookback period for the Gaussian filter, affecting how smooth or responsive the indicator is to price changes.
Adaptive Mode: Toggle the adaptive feature on or off, allowing the GMA to dynamically adjust based on market volatility or remain consistent with a fixed standard deviation.
Volatility Settings: Control the standard deviation period for adaptive mode, fine-tuning how quickly the GMA responds to shifts in volatility.
For-Loop Settings: Modify the start and end points for the for-loop score calculation, adjusting the depth of analysis for trend signals.
Thresholds for Signals: Set custom long and short thresholds to determine when buy or sell signals should be generated.
Visualization Options: Choose to color bars based on trend direction, plot signal lines, or adjust the background color to reflect current market sentiment visually.
Trading Applications
The Adaptive Gaussian MA For Loop can be applied to a variety of trading styles and markets. Here are some key ways you can use this indicator in practice:
Trend Following: The combination of Gaussian smoothing and adaptive volatility helps traders stay on top of market trends, identifying significant momentum shifts while filtering out noise. The for-loop scoring system enhances this by providing a numerical representation of trend strength, making it easier to spot when a new trend is emerging or when an existing one is gaining strength.
Mean Reversion: For traders looking to capitalize on short-term market corrections, the adaptive nature of this indicator makes it easier to identify when price action is deviating too far from its smoothed trend, allowing for strategic entries and exits based on overbought or oversold conditions.
Swing Trading: With its ability to capture medium-term price movements while avoiding the noise of short-term fluctuations, this indicator is well-suited for swing traders who aim to profit from market reversals or short-to-mid-term trends.
Volatility Management: The adaptive feature allows the indicator to adjust dynamically in volatile markets, ensuring that it remains responsive in times of increased uncertainty while avoiding unnecessary noise in calmer periods. This makes it an effective tool for traders who want to manage risk by staying in tune with changing market conditions.
Final Thoughts
The Adaptive Gaussian MA For Loop is a powerful and flexible indicator that merges the elegance of Gaussian smoothing with the adaptability of volatility-based adjustments. By incorporating a for-loop scoring mechanism, this indicator provides traders with a comprehensive view of market trends and potential trade opportunities.
It’s important to test the settings on historical data and adapt them to your specific trading style, timeframe, and market conditions. As with any technical tool, the AGMA For Loop should be used in conjunction with other indicators and solid risk management practices for the best results.
Thus following all of the key points here are some sample backtests on the 1D Chart
Disclaimer: Backtests are based off past results, and are not indicative of the future.
INDEX:BTCUSD
INDEX:ETHUSD
BINANCE:SOLUSD

Two Pole Butterworth For Loop [BackQuant]Two Pole Butterworth For Loop
PLEASE read the following carefully, as understanding the underlying concepts and logic behind the indicator is key to incorporating it into your trading system in a sound and methodical manner.
Introducing BackQuant's Two Pole Butterworth For Loop (2P BW FL) — an advanced indicator that fuses the power of the Two Pole Butterworth filter with a dynamic for-loop scoring mechanism. This unique approach is designed to extract actionable trading signals by smoothing out price data and then analyzing it using a comparative scoring method. Let's delve into how this indicator works, why it was created, and how it can be used in various trading scenarios.
Understanding the Two Pole Butterworth Filter
The Butterworth filter is a signal processing tool known for its smooth response and minimal distortion. It's often used in electronic and communication systems to filter out unwanted noise. In trading, the Butterworth filter can be applied to price data to smooth out the volatility, providing traders with a clearer view of underlying trends without the whipsaws often associated with market noise.
The Two Pole Butterworth variant further enhances this effect by applying the filter with two poles, effectively creating a sharper transition between the passband and stopband. In simple terms, this allows the filter to follow the price action more closely, reacting to changes while maintaining smoothness.
In this script, the Two Pole Butterworth filter is applied to the Calculation Source (default is set to the closing price), creating a smoothed price series that serves as the foundation for further analysis.
Why Use a Two Pole Butterworth Filter?
The Two Pole Butterworth filter is chosen for its ability to reduce lag while maintaining a smooth output. This makes it an ideal choice for traders who want to capture trends without being misled by short-term volatility or market noise. By filtering the price data, the Two Pole Butterworth enables traders to focus on the broader market movements and avoid false signals.
The For-Loop Scoring Mechanism
In addition to the Butterworth filter, this script uses a for-loop scoring system to evaluate the smoothed price data. The for-loop compares the current value of the filtered price (referred to as "subject") to previous values over a defined range (set by the start and end input). The score is calculated based on whether the subject is higher or lower than the previous points, and the cumulative score is used to determine the strength of the trend.
Long and Short Signal Logic
Long Signals: A long signal is triggered when the score surpasses the Long Threshold (default set at 40). This suggests that the price has built sufficient upward momentum, indicating a potential buying opportunity.
Short Signals: A short signal is triggered when the score crosses under the Short Threshold (default set at -10). This indicates weakening price action or a potential downtrend, signaling a possible selling or shorting opportunity.
By utilizing this scoring system, the indicator identifies moments when the price momentum is shifting, helping traders enter positions at opportune times.
Customization and Visualization Options
One of the strengths of this indicator is its flexibility. Traders can customize various settings to fit their personal trading style or adapt it to different markets and timeframes:
Calculation Periods: Adjust the lookback period for the Butterworth filter, allowing for shorter or longer smoothing depending on the desired sensitivity.
Threshold Levels: Set the long and short thresholds to define when signals should be triggered, giving you control over the balance between sensitivity and specificity.
Signal Line Width and Colors: Customize the visual presentation of the indicator on the chart, including the width of the signal line and the colors used for long and short conditions.
Candlestick and Background Colors: If desired, the indicator can color the candlesticks or the background according to the detected trend, offering additional clarity at a glance.
Trading Applications
This Two Pole Butterworth For Loop indicator is versatile and can be adapted to various market conditions and trading strategies. Here are a few use cases where this indicator shines:
Trend Following: The Butterworth filter smooths the price data, making it easier to follow trends and identify when they are gaining or losing strength. The for-loop scoring system enhances this by providing a clear indication of how strong the current trend is compared to recent history.
Mean Reversion: For traders looking to identify potential reversals, the indicator’s ability to compare the filtered price to previous values over a range of periods allows it to spot moments when the trend may be losing steam, potentially signaling a reversal.
Swing Trading: The combination of smoothing and scoring allows swing traders to capture short to medium-term price movements by filtering out the noise and focusing on significant shifts in momentum.
Risk Management: By providing clear long and short signals, this indicator helps traders manage their risk by offering well-defined entry and exit points. The smooth nature of the Butterworth filter also reduces the risk of getting caught in false signals due to market noise.
Final Thoughts
The Two Pole Butterworth For Loop indicator offers traders a powerful combination of smoothing and scoring to detect meaningful trends and shifts in price momentum. Whether you are a trend follower, swing trader, or someone looking to refine your entry and exit points, this indicator provides the tools to make more informed trading decisions.
As always, it's essential to backtest the indicator on historical data and tailor the settings to your specific trading style and market. While the Butterworth filter helps reduce noise and smooth trends, no indicator can predict the future with absolute certainty, so it should be used in conjunction with other tools and sound risk management practices.
Thus following all of the key points here are some sample backtests on the 1D Chart
Disclaimer: Backtests are based off past results, and are not indicative of the future.
INDEX:BTCUSD
INDEX:ETHUSD
BINANCE:SOLUSD

Fourier For Loop [BackQuant]Fourier For Loop
PLEASE Read the following, as understanding an indicator's functionality is essential before integrating it into a trading strategy. Knowing the core logic behind each tool allows for a sound and strategic approach to trading.
Introducing BackQuant's Fourier For Loop (FFL) — a cutting-edge trading indicator that combines Fourier transforms with a for-loop scoring mechanism. This innovative approach leverages mathematical precision to extract trends and reversals in the market, helping traders make informed decisions. Let's break down the components, rationale, and potential use-cases of this indicator.
Understanding Fourier Transform in Trading
The Fourier Transform decomposes price movements into their frequency components, allowing for a detailed analysis of cyclical behavior in the market. By transforming the price data from the time domain into the frequency domain, this indicator identifies underlying patterns that traditional methods may overlook.
In this script, Fourier transforms are applied to the specified calculation source (defaulted to HLC3). The transformation yields magnitude values that can be used to score market movements over a defined range. This scoring process helps uncover long and short signals based on relative strength and trend direction.
Why Use Fourier Transforms?
Fourier Transforms excel in identifying recurring cycles and smoothing noisy data, making them ideal for fast-paced markets where price movements may be erratic. They also provide a unique perspective on market volatility, offering traders additional insights beyond standard indicators.
Calculation Logic: For-Loop Scoring Mechanism
The For Loop Scoring mechanism compares the magnitude of each transformed point in the series, summing the results to generate a score. This score forms the backbone of the signal generation system.
Long Signals: Generated when the score surpasses the defined long threshold (default set at 40). This indicates a strong bullish trend, signaling potential upward momentum.
Short Signals: Triggered when the score crosses under the short threshold (default set at -10). This suggests a bearish trend or potential downside risk.'
Thresholds & Customization
The indicator offers customizable settings to fit various trading styles:
Calculation Periods: Control how many periods the Fourier transform covers.
Long/Short Thresholds: Adjust the sensitivity of the signals to match different timeframes or risk preferences.
Visualization Options: Traders can visualize the thresholds, change the color of bars based on trend direction, and even color the background for enhanced clarity.
Trading Applications
This Fourier For Loop indicator is designed to be versatile across various market conditions and timeframes. Some of its key use-cases include:
Cycle Detection: Fourier transforms help identify recurring patterns or cycles, giving traders a head-start on market direction.
Trend Following: The for-loop scoring system helps confirm the strength of trends, allowing traders to enter positions with greater confidence.
Risk Management: With clearly defined long and short signals, traders can manage their positions effectively, minimizing exposure to false signals.
Final Note
Incorporating this indicator into your trading strategy adds a layer of mathematical precision to traditional technical analysis. Be sure to adjust the calculation start/end points and thresholds to match your specific trading style, and remember that no indicator guarantees success. Always backtest thoroughly and integrate the Fourier For Loop into a balanced trading system.
Thus following all of the key points here are some sample backtests on the 1D Chart
Disclaimer: Backtests are based off past results, and are not indicative of the future .
INDEX:BTCUSD
INDEX:ETHUSD
BINANCE:SOLUSD

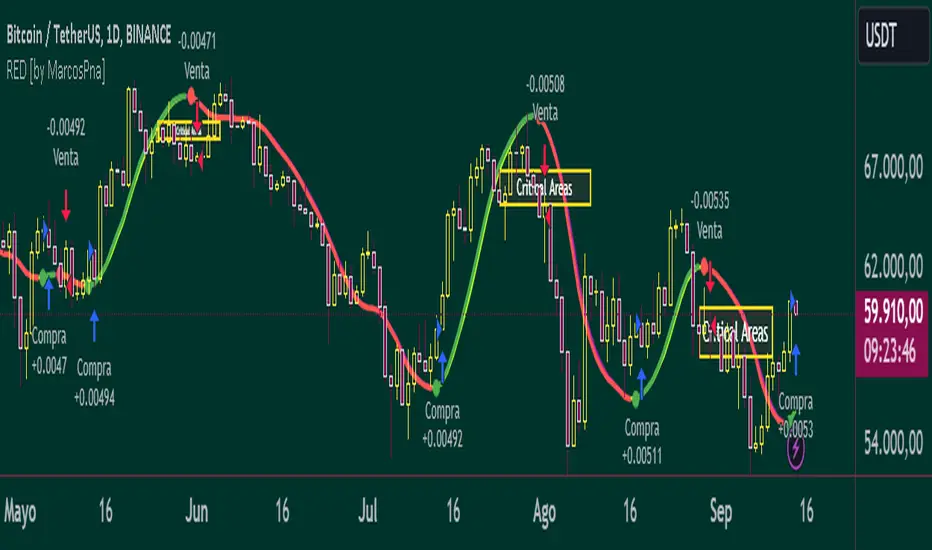
Reflected ema Difference (RED) This script, titled "Reflected EMA Difference (RED)," is based on the logic of evaluating the percentage of convergence and divergence between two moving averages, specifically the Hull Moving Averages (HMA), to make price-related decisions. The Hull Moving Average, created by Alan Hull, is used as the foundation of this strategy, offering a faster and more accurate way to analyze market trends. In this script, the concept is employed to measure and reflect price variations.
Script Functionality Overview:
Hull Moving Averages (HMA): The script utilizes two HMAs, one short-term and one long-term. The main idea is to compute the Delta Difference between these two moving averages, which represents how much they are converging or diverging from each other. This difference is key to identifying potential market trend changes.
Reflected HMA Value: Using the Delta Difference between the HMAs, the value of the short-term HMA is reflected, creating a visual reference point that helps traders see the relationship between price and HMAs on the chart.
Percentage Change Index: The second key parameter is the percentage change index. This determines when a trend is reversing, allowing buy or sell orders to be established based on significant changes in the relationship between the HMAs and the price.
Delta Multiplier: The script comes with a default Delta multiplier of 2 for calculating the difference between HMAs, allowing traders to adjust the sensitivity of the analysis based on the time frame being analyzed.
Trend Reversal Signals: When the price crosses the thresholds defined by the percentage change index, buy or sell signals are triggered, based on the detection of a potential trend reversal.
Visual Cues with Boxes: Boxes are drawn on the chart when the HullMA crosses the reflected HMA value, providing a visual aid to identify critical moments where risk should be evaluated.
Alerts for Receiving Signals:
This script allows you to set up buy and sell alerts via TradingView's alert system. These alerts are triggered when trend changes are detected based on the conditions coded in the script. Traders can receive instant notifications, allowing them to make decisions without needing to constantly monitor the chart.
Additional Considerations:
The percentage change parameter is adjustable and should be configured based on the time frame you are trading on. For longer time frames, it's advisable to use a larger percentage change to avoid false signals.
The use of Hull Moving Averages (HMA) provides a faster and more reactive approach to trend evaluation compared to other moving averages, making it a powerful tool for traders seeking quick reversal signals.
This approach combines the power of Hull Moving Averages with an alert system to improve the trader’s response to trend changes.
Spanish
Este script, titulado "Reflected EMA Difference (RED)", está fundamentado en la lógica de evaluar el porcentaje de acercamiento y distancia entre dos medias móviles, específicamente las medias móviles de Hull (HMA), para tomar decisiones sobre el valor del precio. El creador de la media móvil de Hull, Alan Hull, diseñó este indicador para ofrecer una forma más rápida y precisa de analizar tendencias de mercado, y en este script se utiliza su concepto como base para medir y reflejar las variaciones de precio.
Descripción del funcionamiento:
Medias Móviles de Hull (HMA): Se utilizan dos HMAs, una de corto plazo y otra de largo plazo. La idea principal es calcular la diferencia Delta entre estas dos medias móviles, que representa cuánto se están alejando o acercando entre sí. Esta diferencia es clave para identificar cambios potenciales en la tendencia del mercado.
Valor Reflejado de la HMA: Con la diferencia Delta calculada entre las HMAs, se refleja el valor de la HMA corta, creando un punto de referencia visual que ayuda a los traders a observar la relación entre el precio y las HMAs en el gráfico.
Índice de Cambio de Porcentaje: El segundo parámetro clave del script es el índice de cambio porcentual. Este define el momento en que una tendencia está revirtiendo, permitiendo establecer órdenes de compra o venta en función de un cambio significativo en la relación entre las HMAs y el precio.
Multiplicador Delta: El script tiene un multiplicador predeterminado de 2 para el cálculo de la diferencia Delta, lo que permite ajustar la sensibilidad del análisis según la temporalidad del gráfico.
Señales de Reversión de Tendencia: Cuando el precio cruza los límites definidos por el índice de cambio porcentual, se emiten señales para comprar o vender, basadas en la detección de una posible reversión de tendencia.
Visualización con Cajas: Se dibujan cajas en el gráfico cuando el indicador HullMA cruza el valor reflejado de la HMA, ayudando a identificar visualmente los momentos críticos en los que se debe evaluar el riesgo de las operaciones.
Alertas para Recibir Señales:
Este script permite configurar alertas de compra y venta desde el apartado de alertas de TradingView. Estas alertas se activan cuando se detectan cambios de tendencia en función de las condiciones establecidas en el código. El trader puede recibir notificaciones instantáneas, lo que facilita la toma de decisiones sin necesidad de estar constantemente observando el gráfico.
Consideraciones adicionales:
El porcentaje de cambio es un parámetro ajustable y debe configurarse según la temporalidad que se esté operando. En temporalidades más largas, es recomendable usar un porcentaje de cambio mayor para evitar señales falsas.
La utilización de las medias móviles de Hull (HMA) proporciona un enfoque más rápido y reactivo para evaluar tendencias en comparación con otras medias móviles, lo que lo convierte en una herramienta poderosa para traders que buscan señales rápidas de reversión.
Este enfoque combina la potencia de las medias móviles de Hull con un sistema de alertas que mejora la reactividad a cambios de tendencia.
DEMA Adaptive DMI [BackQuant]DEMA Adaptive DMI
PLEASE Read the following, knowing what an indicator does at its core before adding it into a system is pivotal. The core concepts can allow you to include it in a logical and sound manner.
Conceptual Foundation and Innovation
The DEMA Adaptive DMI blends the Double Exponential Moving Average (DEMA) with the Directional Movement Index (DMI) to offer a unique approach to trend-following. By applying DEMA to the high and low prices, this indicator refines the traditional DMI calculation, enhancing its responsiveness to price changes. This results in a more adaptive and timely measure of market trends and momentum, providing traders with a more refined tool for capturing directional movements in the market.
Technical Composition and Calculation
At its core, the DEMA Adaptive DMI calculates the DEMA for both the high and low prices over a user-defined period. This dual application of DEMA serves to smooth out price fluctuations while retaining sensitivity to market movements. The DMI is then derived from the changes in these DEMA values, producing a set of plus and minus directional indicators that reflect the prevailing trend. Additionally, an Average Directional Index (ADX) is computed to measure the strength of the trend, with the entire process being dynamically adjusted based on the DEMA calculations.
DEMA Application:
The DEMA is applied to both high and low prices to reduce lag and provide a smoother representation of price action.
Directional Movement Calculation: The DMI is calculated using the smoothed price changes, resulting in plus and minus indicators that accurately reflect market trends.
ADX Calculation:
The ADX is computed to quantify the strength of the trend, offering traders insight into whether the market is trending strongly or is in a phase of consolidation.
Features and User Inputs The DEMA Adaptive DMI offers a range of customizable options to suit different trading styles and market conditions:
DEMA Calculation Period: Users can set the period for the DEMA calculation, allowing for adjustments based on the desired sensitivity.
DMI Length: The length of the DMI calculation can be adjusted, providing flexibility in how trends are measured.
ADX Smoothing Period: The smoothing period for the ADX can be customized to fine-tune the trend strength measurement.
Divergence Detection: Optional divergence detection features allow traders to spot potential reversals based on the DMI and price action.
Visualization options include static high and low levels to mark extreme DMI thresholds, the ability to color bars according to trend direction, and background hues to highlight overbought and oversold conditions.
Practical Applications
The DEMA Adaptive DMI is particularly effective in markets where trend strength and direction are crucial for successful trading. Traders can leverage this indicator to:
Identify Trend Reversals:
Detect potential trend reversals by monitoring the DMI and ADX in conjunction with divergence signals.
Trend Confirmation:
Use the DEMA-based DMI to confirm the strength and direction of a trend, aiding in the timing of entries and exits.
Strategic Positioning:
The indicator's responsiveness allows traders to position themselves effectively in fast-moving markets, reducing the risk of late entries or exits.
Advantages and Strategic Value
By integrating the DEMA with the DMI, this indicator provides a more adaptive and timely measure of market trends. The reduced lag from the DEMA ensures that traders receive signals that are closely aligned with current market conditions, while the dynamic DMI calculation offers a more accurate representation of trend direction and strength. This makes the DEMA Adaptive DMI a valuable tool for traders looking to enhance their trend-following strategies with a focus on precision and adaptability.
Summary and Usage Tips
The DEMA Adaptive DMI is a sophisticated trend-following indicator that combines the benefits of DEMA and DMI into a single, powerful tool. Traders are encouraged to incorporate this indicator into their trading systems for a more nuanced and responsive approach to trend detection and confirmation. Whether used for identifying trend reversals, confirming trend strength, or strategically positioning in the market, the DEMA Adaptive DMI offers a versatile and reliable solution for trend-following strategies.
Thus following all of the key points here are some sample backtests on the 1D Chart
Disclaimer: Backtests are based off past results, and are not indicative of the future.
INDEX:BTCUSD
INDEX:ETHUSD
BINANCE:SOLUSD

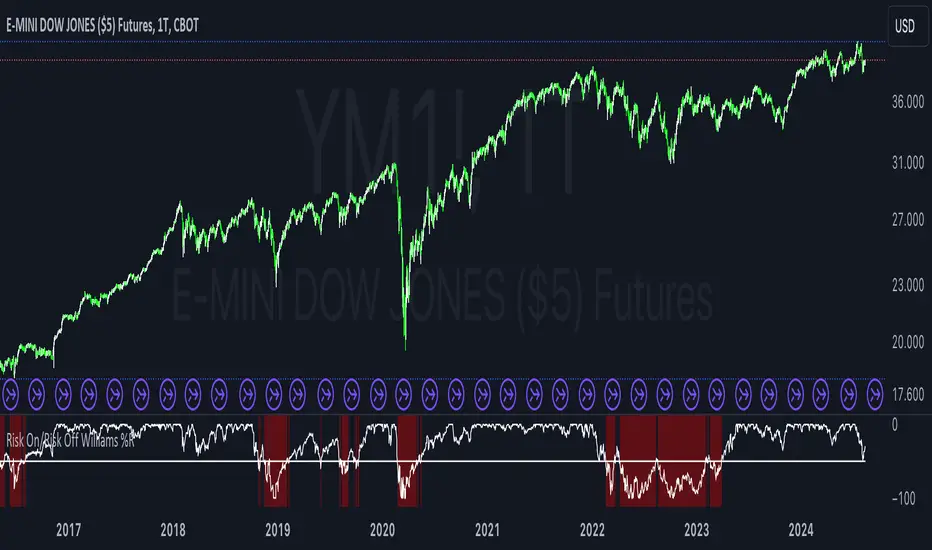
Risk On/Risk Off Williams %RThe Risk On/Risk Off Williams %R indicator is a technical analysis tool designed to gauge market sentiment by comparing the performance of risk-on and risk-off assets. This indicator combines the Williams %R, a momentum oscillator, with a composite index derived from various financial assets to determine the prevailing market risk sentiment.
Components:
Risk-On Assets: These are typically more volatile and are expected to perform well during bullish market conditions. The indicator uses the following risk-on assets:
SPY (S&P 500 ETF)
QQQ (Nasdaq-100 ETF)
HYG (High-Yield Corporate Bond ETF)
XLF (Financial Select Sector SPDR Fund)
XLK (Technology Select Sector SPDR Fund)
Risk-Off Assets: These are generally considered safer investments and are expected to outperform during bearish market conditions. The indicator includes:
TLT (iShares 20+ Year Treasury Bond ETF)
GLD (SPDR Gold Trust)
DXY (U.S. Dollar Index)
IEF (iShares 7-10 Year Treasury Bond ETF)
XLU (Utilities Select Sector SPDR Fund)
Calculation:
Risk-On Index: The average closing price of the risk-on assets.
Risk-Off Index: The average closing price of the risk-off assets.
The composite index is computed as:
Composite Index=Risk On Index−Risk Off Index
Composite Index=Risk On Index−Risk Off Index
Williams %R: This momentum oscillator measures the current price relative to the high-low range over a specified period. It is calculated as:
\text{Williams %R} = \frac{\text{Highest High} - \text{Composite Index}}{\text{Highest High} - \text{Lowest Low}} \times -100
where "Highest High" and "Lowest Low" are the highest and lowest values of the composite index over the lookback period.
Usage:
Williams %R: A momentum oscillator that ranges from -100 to 0. Values above -50 suggest bullish conditions, while values below -50 indicate bearish conditions.
Background Color: The background color of the chart changes based on the Williams %R relative to a predefined threshold level:
Green background: When Williams %R is above the threshold level, indicating a bullish sentiment.
Red background: When Williams %R is below the threshold level, indicating a bearish sentiment.
Purpose:
The indicator is designed to provide a visual representation of market sentiment by comparing the performance of risk-on versus risk-off assets. It helps traders and investors understand whether the market is leaning towards higher risk (risk-on) or safety (risk-off) based on the relative performance of these asset classes. By incorporating the Williams %R, the indicator adds a momentum-based dimension to this analysis, allowing for better decision-making in response to shifting market conditions.
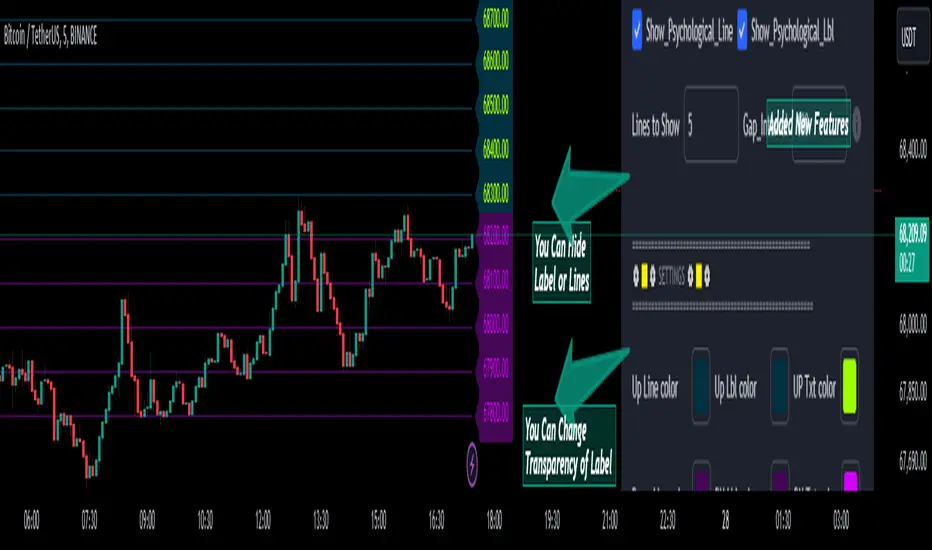
Psychological Lines
**The Option Chain Shows Strike Price Levels per Index Option**
- **Bank Nifty Index:** 100-point difference or gap between two strike prices.
- **Nifty 50 Index:** 50-point difference or gap between two strike prices.
- **FinNifty 50 Index:** 50-point difference or gap between two strike prices.
**Importance of These Levels:**
- When prices trade at these levels, the option premium either increases or decreases.
- Round numbers always affect option prices.
- Psychological round numbers have a significant impact and act as support and resistance.
- More strangle or straddle positions are created at these levels.
- More call writers or put writers trade at these levels.
**Benefits of Plotting Levels on Charts:**
- Having levels to plot on the chart is always helpful while trading and aids in taking trade positions accordingly.
**Indicator Features:**
- Helps users with various functionalities.
- Allows users to plot lines as needed and adjust the gap between lines as per requirements or option strikes.
- User input to show the number of lines on the chart.
- Tooltip on each level, indicating the current price (LTP) and the difference in points from the LTP.
- Simple to use.
- User-friendly.
- Enhances trading experience with the help of lines.
---
These adjustments should make the text clearer and more professional. If you need any further changes, feel free to ask!
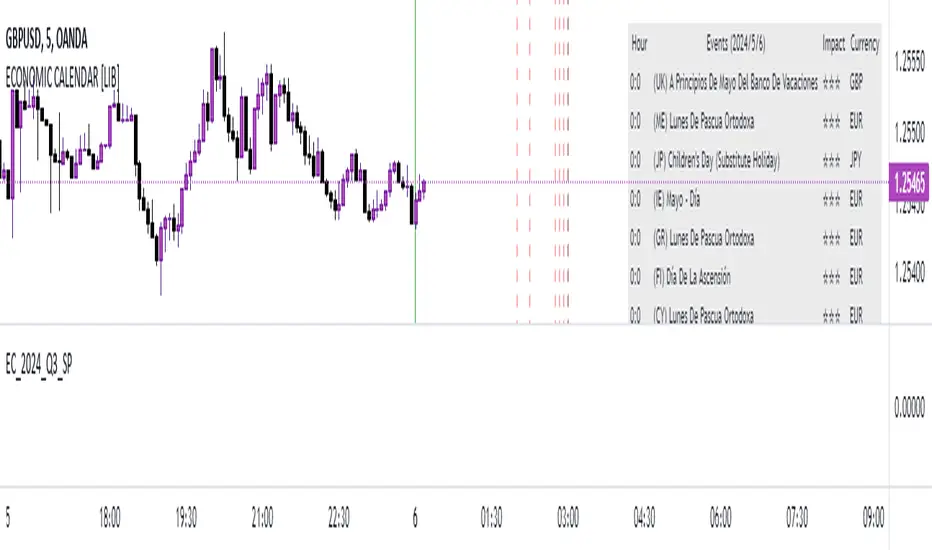
EC_2025_Q4_ENLibrary "EC_2025_Q4_EN"
output2025()
Returns the list of events during the period.
Returns: array: (week1,week2, ... week_n)
week_n= ;;; ...
Where: is expressed as date + characteristics: YYYY,MM,DD,hh,mm,ss,x,y,z
x impact in numbers
y event name in numbers
z currency in numbers
name2025()
Returns the list of event names during the period.
Returns: array: (week1,week2, ... week_n)
week_n= ;; ...
Where: is expressed as: index, name
index: related to event name y
name event: event name related to y text
impact2025()
Returns the list of impact names during the period.
Returns: array: (week1,week2, ... week_n)
week_n= ;; ...
Where: is expressed as: index, impact
index: related to impact name x
impact: impact name related to x text
currency2025()
Returns the list of currencies during the period.
Returns: array: (week1,week2, ... week_n)
week_n= ;; ...
Where: is expressed as: index, currency
index: related to currency name z
currency: currency name related to z text

EC_2025_Q3_ENLibrary "EC_2025_Q3_EN"
output2025()
Returns the list of events during the period.
Returns: array: (week1,week2, ... week_n)
week_n= ;;; ...
Where: is expressed as date + characteristics: YYYY,MM,DD,hh,mm,ss,x,y,z
x impact in numbers
y event name in numbers
z currency in numbers
name2025()
Returns the list of event names during the period.
Returns: array: (week1,week2, ... week_n)
week_n= ;; ...
Where: is expressed as: index, name
index: related to event name y
name event: event name related to y text
impact2025()
Returns the list of impact names during the period.
Returns: array: (week1,week2, ... week_n)
week_n= ;; ...
Where: is expressed as: index, impact
index: related to impact name x
impact: impact name related to x text
currency2025()
Returns the list of currencies during the period.
Returns: array: (week1,week2, ... week_n)
week_n= ;; ...
Where: is expressed as: index, currency
index: related to currency name z
currency: currency name related to z text

EC_2025_Q2_ENLibrary "EC_2025_Q2_EN"
output2025()
Returns the list of events during the period.
Returns: array: (week1,week2, ... week_n)
week_n= ;;; ...
Where: is expressed as date + characteristics: YYYY,MM,DD,hh,mm,ss,x,y,z
x impact in numbers
y event name in numbers
z currency in numbers
name2025()
Returns the list of event names during the period.
Returns: array: (week1,week2, ... week_n)
week_n= ;; ...
Where: is expressed as: index, name
index: related to event name y
name event: event name related to y text
impact2025()
Returns the list of impact names during the period.
Returns: array: (week1,week2, ... week_n)
week_n= ;; ...
Where: is expressed as: index, impact
index: related to impact name x
impact: impact name related to x text
currency2025()
Returns the list of currencies during the period.
Returns: array: (week1,week2, ... week_n)
week_n= ;; ...
Where: is expressed as: index, currency
index: related to currency name z
currency: currency name related to z text

EC_2025_Q1_ENLibrary "EC_2025_Q1_EN"
output2025()
Returns the list of events during the period.
Returns: array: (week1,week2, ... week_n)
week_n= ;;; ...
Where: is expressed as date + characteristics: YYYY,MM,DD,hh,mm,ss,x,y,z
x impact in numbers
y event name in numbers
z currency in numbers
name2025()
Returns the list of event names during the period.
Returns: array: (week1,week2, ... week_n)
week_n= ;; ...
Where: is expressed as: index, name
index: related to event name y
name event: event name related to y text
impact2025()
Returns the list of impact names during the period.
Returns: array: (week1,week2, ... week_n)
week_n= ;; ...
Where: is expressed as: index, impact
index: related to impact name x
impact: impact name related to x text
currency2025()
Returns the list of currencies during the period.
Returns: array: (week1,week2, ... week_n)
week_n= ;; ...
Where: is expressed as: index, currency
index: related to currency name z
currency: currency name related to z text

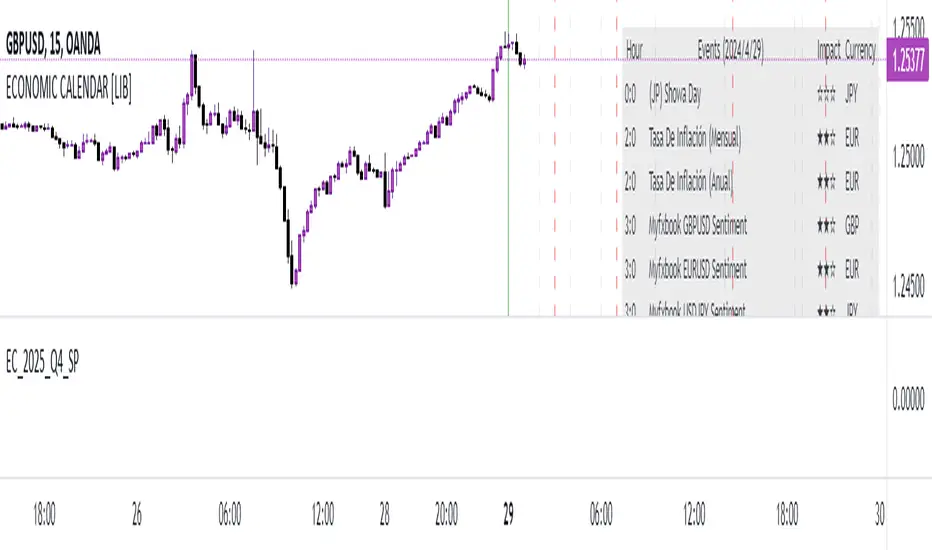
EC_2025_Q4_SPLibrary "EC_2025_Q4_SP"
output2025()
Returns the list of events during the period.
Returns: array: (week1,week2, ... week_n)
week_n= ;;; ...
Where: is expressed as date + characteristics: YYYY,MM,DD,hh,mm,ss,x,y,z
x impact in numbers
y event name in numbers
z currency in numbers
name2025()
Returns the list of event names during the period.
Returns: array: (week1,week2, ... week_n)
week_n= ;; ...
Where: is expressed as: index, name
index: related to event name y
name event: event name related to y text
impact2025()
Returns the list of impact names during the period.
Returns: array: (week1,week2, ... week_n)
week_n= ;; ...
Where: is expressed as: index, impact
index: related to impact name x
impact: impact name related to x text
currency2025()
Returns the list of currencies during the period.
Returns: array: (week1,week2, ... week_n)
week_n= ;; ...
Where: is expressed as: index, currency
index: related to currency name z
currency: currency name related to z text
EC_2025_Q3_SPLibrary "EC_2025_Q3_SP"
output2025()
Returns the list of events during the period.
Returns: array: (week1,week2, ... week_n)
week_n= ;;; ...
Where: is expressed as date + characteristics: YYYY,MM,DD,hh,mm,ss,x,y,z
x impact in numbers
y event name in numbers
z currency in numbers
name2025()
Returns the list of event names during the period.
Returns: array: (week1,week2, ... week_n)
week_n= ;; ...
Where: is expressed as: index, name
index: related to event name y
name event: event name related to y text
impact2025()
Returns the list of impact names during the period.
Returns: array: (week1,week2, ... week_n)
week_n= ;; ...
Where: is expressed as: index, impact
index: related to impact name x
impact: impact name related to x text
currency2025()
Returns the list of currencies during the period.
Returns: array: (week1,week2, ... week_n)
week_n= ;; ...
Where: is expressed as: index, currency
index: related to currency name z
currency: currency name related to z text

EC_2025_Q2_SPLibrary "EC_2025_Q2_SP"
output2025()
Returns the list of events during the period.
Returns: array: (week1,week2, ... week_n)
week_n= ;;; ...
Where: is expressed as date + characteristics: YYYY,MM,DD,hh,mm,ss,x,y,z
x impact in numbers
y event name in numbers
z currency in numbers
name2025()
Returns the list of event names during the period.
Returns: array: (week1,week2, ... week_n)
week_n= ;; ...
Where: is expressed as: index, name
index: related to event name y
name event: event name related to y text
impact2025()
Returns the list of impact names during the period.
Returns: array: (week1,week2, ... week_n)
week_n= ;; ...
Where: is expressed as: index, impact
index: related to impact name x
impact: impact name related to x text
currency2025()
Returns the list of currencies during the period.
Returns: array: (week1,week2, ... week_n)
week_n= ;; ...
Where: is expressed as: index, currency
index: related to currency name z
currency: currency name related to z text

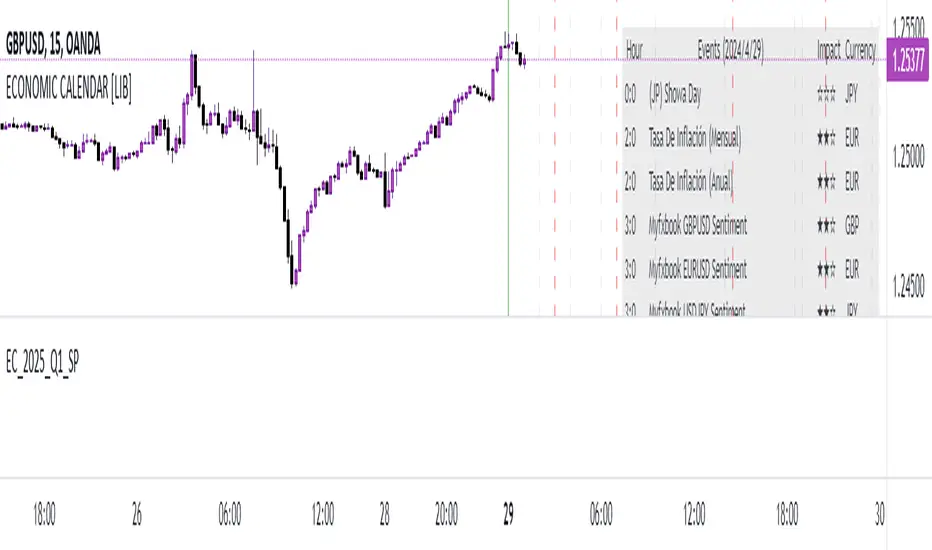
EC_2025_Q1_SPLibrary "EC_2025_Q1_SP"
output2025()
Returns the list of events during the period.
Returns: array: (week1,week2, ... week_n)
week_n= ;;; ...
Where: is expressed as date + characteristics: YYYY,MM,DD,hh,mm,ss,x,y,z
x impact in numbers
y event name in numbers
z currency in numbers
name2025()
Returns the list of event names during the period.
Returns: array: (week1,week2, ... week_n)
week_n= ;; ...
Where: is expressed as: index, name
index: related to event name y
name event: event name related to y text
impact2025()
Returns the list of impact names during the period.
Returns: array: (week1,week2, ... week_n)
week_n= ;; ...
Where: is expressed as: index, impact
index: related to impact name x
impact: impact name related to x text
currency2025()
Returns the list of currencies during the period.
Returns: array: (week1,week2, ... week_n)
week_n= ;; ...
Where: is expressed as: index, currency
index: related to currency name z
currency: currency name related to z text
EC_2024_Q4_SPLibrary "EC_2024_Q4_SP"
output2024()
Returns the list of events during the period.
Returns: array: (week1,week2, ... week_n)
week_n= ;;; ...
Where: is expressed as date + characteristics: YYYY,MM,DD,hh,mm,ss,x,y,z
x impact in numbers
y event name in numbers
z currency in numbers
name2024()
Returns the list of event names during the period.
Returns: array: (week1,week2, ... week_n)
week_n= ;; ...
Where: is expressed as: index, name
index: related to event name y
name event: event name related to y text
impact2024()
Returns the list of impact names during the period.
Returns: array: (week1,week2, ... week_n)
week_n= ;; ...
Where: is expressed as: index, impact
index: related to impact name x
impact: impact name related to x text
currency2024()
Returns the list of currencies during the period.
Returns: array: (week1,week2, ... week_n)
week_n= ;; ...
Where: is expressed as: index, currency
index: related to currency name z
currency: currency name related to z text

EC_2024_Q3_SPLibrary "EC_2024_Q3_SP"
output2024()
Returns the list of events during the period.
Returns: array: (week1,week2, ... week_n)
week_n= ;;; ...
Where: is expressed as date + characteristics: YYYY,MM,DD,hh,mm,ss,x,y,z
x impact in numbers
y event name in numbers
z currency in numbers
name2024()
Returns the list of event names during the period.
Returns: array: (week1,week2, ... week_n)
week_n= ;; ...
Where: is expressed as: index, name
index: related to event name y
name event: event name related to y text
impact2024()
Returns the list of impact names during the period.
Returns: array: (week1,week2, ... week_n)
week_n= ;; ...
Where: is expressed as: index, impact
index: related to impact name x
impact: impact name related to x text
currency2024()
Returns the list of currencies during the period.
Returns: array: (week1,week2, ... week_n)
week_n= ;; ...
Where: is expressed as: index, currency
index: related to currency name z
currency: currency name related to z text