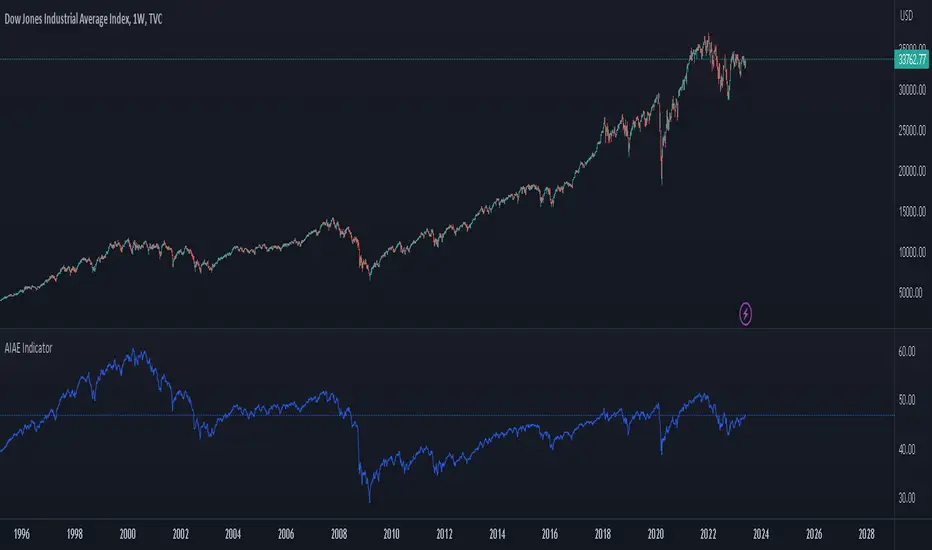
AIAE IndicatorAggregate (or Average) Investor Allocation to Equities.
When it comes to predicting long-term equity returns, several well-known indicators come to mind—for example, the CAPE ratio, Tobin’s Q, and Market Cap to GDP, to name a few.
Yet there is another indicator without nearly as high of a profile that has outperformed the aforementioned indicators significantly when it comes to both forecasting and tactical asset allocation.
That indicator, known as the Aggregate (or Average) Investor Allocation to Equities (AIAE), was developed by the pseudonymous financial pundit, Jesse Livermore, and published on his blog in 2013.
In an essay titled, “The Single Greatest Predictor of Future Stock Market Returns,” Livermore makes the case that the primary driver of long-term equity returns is not valuation, but rather the supply of equities relative to the combined supply of bonds and cash.
Accordingly, the AIAE is computed by taking the total market value of equities and dividing by the sum of a) the total market value of equities, b) the total market value of bonds, and c) the total amount of cash available to investors (i.e., that in circulation plus bank deposits):
This ratio gives the market-wide allocation to equities (or, equivalently, the average investor allocation to equities weighted by portfolio size). (Note that every share of stock, every bond, and every unit of cash in existence must be held in some portfolio somewhere at all times.)
Livermore explains that, in practice, the total market value of bonds plus cash can be estimated by the total liabilities held by the five classes of economic borrowers: Households, Non-Financial Corporations, State and Local Governments, the Federal Government, and the Rest of the World.
This follows from the fact that if these entities borrow directly from investors, new bonds are created. Whereas, if they borrow directly from banks, new bank deposits (cash) are created.
As the economy grows, the supply of bonds and cash steadily increases. Historically, the rate of increase of the supply of bonds and cash has been about 7.5% per annum. Consequently, if the market portfolio is to maintain the same allocation to equities, the supply of equities must increase at the exact same rate.
The supply of equities can increase either by new equity issuance or by price increases. Historically, net new equity issuance has been negligible (with issuances being offset by buybacks and acquisitions). Thus, in order for equities not to become an ever-smaller portion of the average investor’s portfolio, the price of stocks must rise over the long-term.
While we often hear that stock prices follow earnings, in the 1980s earnings fell slightly from the beginning of the decade to the end of the decade, yet stocks rose at an annualized rate of 17% during that time. How could this be?
Well, at the beginning of the decade the average investor’s portfolio had a 25% allocation to equities. During the decade, the supply of bonds and cash rose strongly. If the price of equities had not risen, the average investor’s allocation to equities would have fallen to a mere 13% (as the supply of cash and bonds grew). Thus, equities had no choice but to rise despite the fall in earnings.
Search in scripts for "indicator"
Basic Polychromatic Momentum IndicatorBasic Polychromatic Momentum Indicator with alerts
PMI involves taking the difference between the current price and the price n periods ago, and then subtracting from it the difference between the current price and the price n periods ago, divided by n. This gives a smoothed version of the momentum indicator.
The user can also specify a smoothing factor using the "smoothing" input, which applies a simple moving average to the PMI. The resulting smoothed PMI is plotted on the chart in blue, with a dotted gray line at the zero level.

Ladder StDevThis indicator shows the upwards (green) and downward (red) volatility of the market. It is a standard deviation of the price but with a twist! For the upwards volatility , only the green candles are taken into account, and for the downwards only the red candles are.
Compared to my previous "Ladder ATR" indicator this a different approach to measure the the upwards and downwards volatility of the market by utilizing the standard deviation instead of the ATR. When both measure the volatility they have different "dynamics". Standard deviation increases the weight of larger values over smaller values. The ATR indicator is based on the average of absolute changes. So, if we apply the indicators on a daily chart , ATR considers intraday and between-day data, while the standard deviation calculation includes only daily returns (source price).
Indecision Indicator [CHE]"In times of great uncertainty, indecision is often the wisest course of action."
Introduction:
The Indecision Indicator is a custom script for use in Trading View. The script is designed to help traders determine potential reversal points in financial markets, by displaying different levels of indecision or rejection.
Glossary:
Indecision: Indicates a situation where the market is uncertain and can move in either direction.
Rejection: Indicates a situation where the market has rejected a certain price level and is likely to move in the opposite direction.
Totalwick: The total length of the upper and lower shadows on a candlestick chart.
MACD: Moving Average Convergence Divergence, a popular momentum indicator.
Inputs:
Rejection: Allows the user to choose between the different types of indecision to display, including Indecision, Rejection, Totalwick, All, and MACD.
Indecision Length: The number of candles used to calculate the indecision level.
Length: The length of the Moving Average used to smooth the indecision or rejection levels.
Trigger Length: The number of candles used to calculate the trigger line, which is used to indicate potential reversal points.
Output:
The script calculates the lower and upper rejection levels, as well as the indecision level, and displays them as lines on the chart. The lines are color-coded to indicate whether the market is in a state of indecision or rejection, and whether it is likely to move up or down.
Best regards
Chervolino
3 indicators in another time frame "3 indicators in another time frame"
1- In the indicator settings section, you can save and change another time period
2-For time frame changes, it should be calculated in minutes
3-Includes three performance indicators ( ichimoku , bollinger bans, pivot ) that are set to a 15-minute timeframe by default.

CM_SlingShotSystem+_CassicEMA+Willams21EMA13 htc1977 editionThis strategy is a combination of 2 indicators based on EMA(actually x3 EMAs and Williams ind.
We usin this to see where EMA fast is above EMA slow(for long), entry position when price hit fast EMA and exit if trend changes or price overbought, or by stoploss 1%.
The opposite for a short position.
For better result You can change every EMA's, stoploss, Willam's ind and other visualisation in settings.
If You find good combination - please, let me know(if You want).
I will check it with ML, and attach it here.
Original indicators will write in comments

Best Indicators for Day TradingThis is the best indicator for Day Traders. It is great for traders who don't want to pay for more indicators
Fed Net Liquidity Indicator v2Updated script for jlb05013's original Fed Net Liquidity Indicator. TradingView was bringing in the FRED data in different units than they used to. This code fixes it.
This indicator aims to present a "Net Liquidity" indicator comprised of the Fed Balance sheet , less the TGA account and Overnight Reverse REPO agreements.
Net Liquidity = Fed Balance Sheet - ( TGA + Reverse REPO)
This is an overlay that can be added to stock or other charts (like SPY ) to see how the market may appear correlated to Net Liquidity - injection of liquidity into the markets.
This was hypothesized by Max Anderson, this is just a script realizing that posting.
New updates include a resolution feature, and an option to offset backwards by 2 days per original intent.

P4L London Aperture IndicatorIt is just for let you know the london aperture.
Use this indicator.
P4L

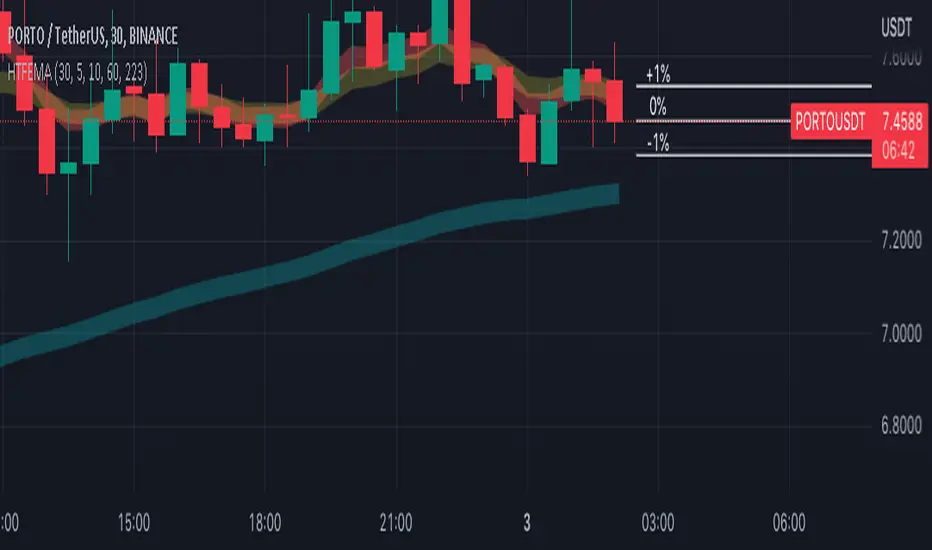
Higher Time Frame EMAs and 1% volatility indicatorSet the "higher time frame" (HTF) from which the EMAs will be calculated in all timeframes.
Example: I chose timeframe 1D and I will see the EMAs from TF 1D also in smaller TF as 1, 5, 30, 60 minutes.
There are 4 EMAs. The default values are 5, 10, 60 and 223 periods from "Scalping the Bull" indicator.
You can change the periods of each EMA.
The indicator have also a volatility indication, showing -1% and +1% price levels.
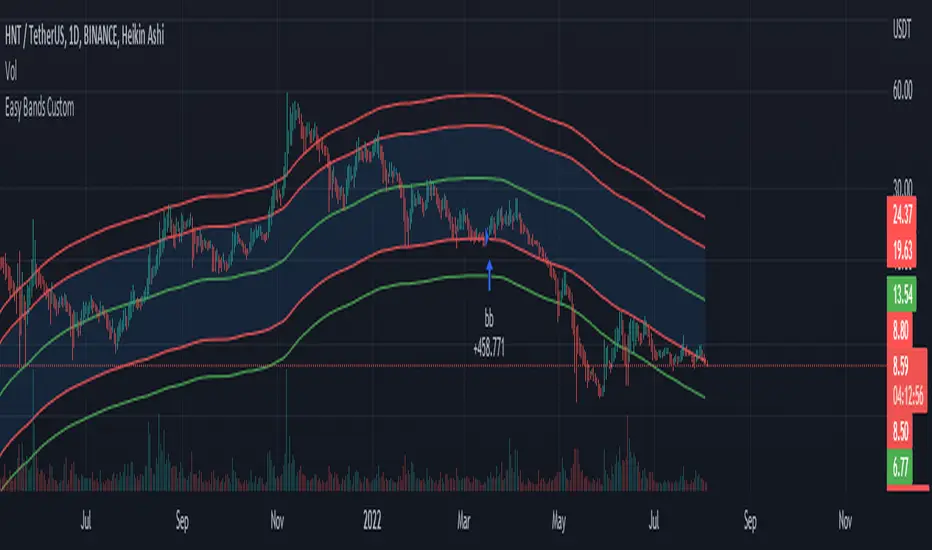
Easy Bands Custom IndicatorBased on 21 Week SMA
--- // Buy when the market is oversold - Sell when the Market is overbought // --
If you don't know what that means don't use this indicator. Good luck out there!
LoTek - CT Moving Average Crossover Indicator - MTF [CT/LoTek]This is a shameless fork of Caretaker's excellent CT MAC indicator. This indicator has 2 new features. I've added the ability to select a different timeframe for each moving average. This way you can set a Daily 10, or a weekly 20 or any other of your favorite lines and it will always be there on your chart. The other new features is the ability to select VWMA as well as SMA and EMA for each moving average. VWMA is pretty nice to watch as well, and with 9 moving averages to mix and match, I'm sure you'll find something worth keeping.
To fork this, I created a new "resolution" variable for each MA. I also created a new function that uses the request.security call to get the specific timeframe resolution. I backtested this with CT's OG script and the numbers stay the same... but I have a sneaky suspicion that VWMAs are not showing proper crossover values. So keep that in mind. The drawn lines are fine, but the crossover data when using VWMA may be off. I wrote the new function to default to EMA, so if it fails at VWMA, it will just show you EMA data.
Let's see, what else... please tell me if you find any bugs or want any other features baked in.

RS Compare IndicatorRelative Strength Breakout is always a great indicator of change in trends. This indicator is a visual attempt to show the region of outperformance of a stock with respect to a sector or primary indicator.
The color indicated should read as below
1) Color Red: Indicates that the selected script is underperforming the indexing with which it is compared
2) Color Yellow: Indicates that the selected script is as per the indexing with which it is compared.
3) Color Green: Indicates that the script is outperforming the indexing with which it is compared.

MACD S/R signal indicatorI've based the script on my MACDs/r indicator.
I think it works better on higher timeframes, this is just an experiment, please feel free to modify it.
I have been testing it with parabolic SARS to know when to exit the trades.
Exit condition: if I'm in a log position and the price is below the last bearish parabolic SARS dot I exit the trade and the opposite for shorts
DISCLAIMER: Is just an experiment and I haven't test it with real money, be careful
JG RSI/MFI/divergence IndicatorThis is a combination of
- RSI (relative strength index)
- MFI (money flow index)
- Divergences on the RSI
MFI behaves much the same as RSI but it more responsive/to some degree a leading indicator. I find it helps having this overlayed with RSI to help gauge price action and sentiment, as well as for confluence with RSI.
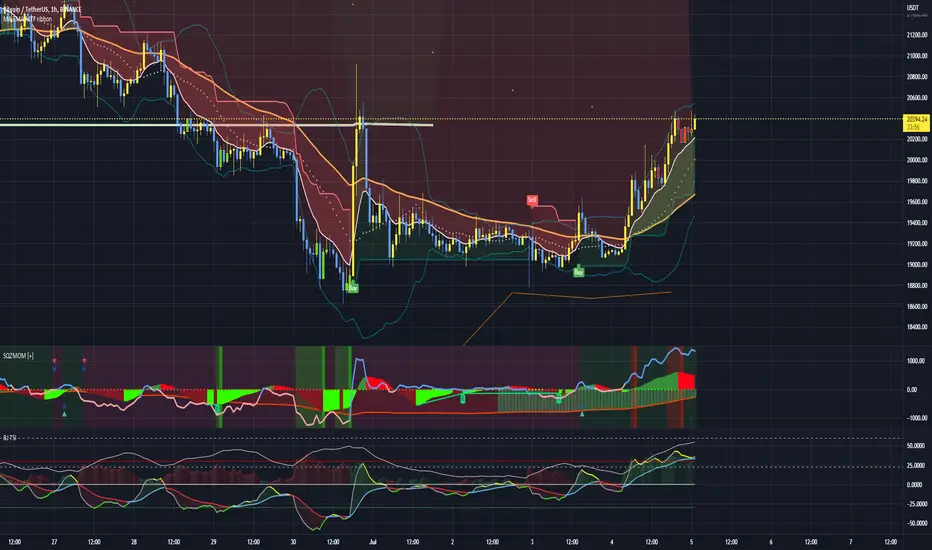
Squeeze Momentum Indicator + 2.0This is a squeeze momentum oscillator with ADX-RSI, Elliot waves oscillator, HMA background and more.
I recommend configure ADX-RSI with the following settings:
-ADX Length = 14
-ADX smooth = 14
-RSI Length = 14
-Threshold = 15
-Upline = 70
-Downline = 30
Thanks to OskarGallard for develop this indicator.
I am Sc4lp1ng, the developer of EMA MTF cloud and TSI-ADX Histogram.
Pi Cycle Bottom IndicatorBack in June 2021, I was able to find two moving averages that crossed when Bitcoin reached it's cycle bottom, similar to Philip Swift's Pi-Cycle Top indicator.
The moving average pair used here was the x0.475 multiple of the 471 MA and the 150 EMA ( EMA to take into account of short term volatility ).
I have a more in-depth analysis and explanation of my findings on my medium page .
Trader Dončić.


Vortex Indicator w/ ALFAdded Adaptive Laguerre Filters (ALF) to built-in TradingView Vortex Indicator.
Use these ALFs similar to an MA or ROC on the VI+ or VI-, as they indicate the strength of the uptrend/downtrend and can help spot tops and bottoms earlier (when the VI line crosses through the ALF the ALF will change color)
- Added configurable horizontal lines to show periods of extremely high/low trend strength. Also can be used to help call tops/bottoms.
- Add horizontal ranges with background color/
- Added background color for when RSI is above a certain level (50 by default). Etienne Botes has mentioned using Vortex with RSI of the same period being over 50.0 can filter out false signals.
- Added background color for when VI+ and VI- cross.
- Added adaptive lookback length based on timeframes. I don't recommend daytrading using multiple vortex timeframes, but it can be useful when screening/analyzing stocks.

SP IndicatorSP Indicator - One of the best indicators for scalping trading on any timeframes. The best readings are given on 5, 15 and 30 minute frames.
For readings, several indicators are combined into one, which allows you to get a more accurate forecast, which is more than 90%.
Instruction.
The indicator is easy to use. Just install it and follow the arrows to go long or short. Stop loss set small, about 1-2%. In most cases, this is sufficient.
Good luck in bidding!
[blackcat] L3 Market Sentiment IndicatorLevel 3
Background
I've been thinking about trying out some technical indicators of market sentiment recently. Of course, this may not be limited to OHLC data, but requires more statistical data for analysis. However, I still wanted to try making a market sentiment indicator with OHLC. In this way, the difference between the two indicators can be compared later.
Function
This market sentiment indicator is functionally divided into two categories: the first is the sentiment line, which is a total of 3 lines. The first line is the yellow aggressive trader sentiment line, usually expressed as a 5-period moving average; the second line is the purple conservative trader interest line, which I used a slightly more complicated algorithm. The third line is the market sentiment line that takes the average of the first two. It is yellow when the market price is rising and purple when the price is falling.
The second type is the pressure line and the support line, a total of four, when they are support lines, the color is green; once they become resistance lines, the color will change from green to red, and show the current price of pressure or support.
Remarks
Feedbacks are appreciated.

Resistance/Support Indicator - FontiramisuIndicator showing resistances and support, based on pivots location
When a new pivot location is near from a resistance/support the latter gains weight.
You can modify multiple parameters :
Nb Max res/sup : Define the number max res/sup to keep in our res/sup history array. The greater it is the older bar index will be taken.
Nb show res/sup : Define the number of res/sup to be drawn.
Min weight shown : Define min res/sup weight to be shown. Weight is used to measure strengh of res/sup.
% range stack : Define price percentage change required to stack a pivot into an existing res/sup. Default is 0.015 = 1.5%.
Pivots are calculated with deviation parameter to validate with more precision.
Fontilab Library is used to code this indicator.

Custom Multi-Timeframe IndicatorIt's a pretty simple example of a nice custom screener you can run for multiple timeframes. This is an RSI screener, but you can easily change the function for your own Indicator.
Screener displays:
Last value of the instrument
RSI value for up to 10 instruments / 4 timeframes.
In Parameters you can change:
4 timeframes
10 instruments
Parameters for RSI
Styling parameters for table
If the selected timeframe will be lower than the current one you will receive a warning message in a table.
Thanks to @MUQWISHI to help me code it.
Disclaimer
Please remember that past performance may not be indicative of future results.
Due to various factors, including changing market conditions, the strategy may no longer perform as well as in historical backtesting.
This post and the script don’t provide any financial advice.
