1st Hour High and Low ISRDaily Range :
1st Hour High and Low From Market Start Time
ISR = Initial Support Resistance
Search in scripts for "low"
Better All time high & All time lowBetter & improved & simpler All time high (ATH) and All time low (ATL) indicator with custom bars length and enable/disable feature.

Day start top and bottomThis code is modified to draw the first 15 minutes(variable in setting by default 15m is set) of the high and lows through out the day.
It will work on time frames less than than or equal to 1st input. Hope this code helps you all.
IMPORTANT SETTING DETAILS:
1.Res = input(title="Starting X minutes lines to be Displayed",defval="15", type=input.resolution)
2.Day_start_15m=input("0915-0930",title="your country's Trading session time (starting X minutes)")
make sure to enter the starting 15 min of your country trading time in the input in 2nd input
both the above input 1 and 2 must be equal in time i.e "0915-0930"=15min and first one is also 15m
you need to make sure that the input settings are correct. It is By default set For INDIAs trading start time, you have to set start time according to your country.

Average Low/High Percentage DifferenceThis indicator calculates the Simple Moving Average of the difference in percentage between lows and highs of a candle. This assists in understanding the volatility of an asset. Showing this in percentages is more helpful in crypto.

Previous High/Low MTFIndicator to plot higher time frame previous candle highs and lows.
One of the key factor in understanding the trend is to look at higher time-frames chart.
Parameters are explained below:
resolution : Chose resolution of higher timeframe. If set to same as symbol, it will consider next parameter HTFMultiplier for calculation of higher timeframe
HTFMultiplier : Multiply symbol timeframe to by HTFMultiplier to derive higher time-frame
Offset : Number of higher timeframe candles before to be plotted. 1 means - it will show highs/lows of previous higher timeframe candle.
Combo Backtest 123 Reversal & High and Low Levels This is combo strategies for get a cumulative signal.
First strategy
This System was created from the Book "How I Tripled My Money In The
Futures Market" by Ulf Jensen, Page 183. This is reverse type of strategies.
The strategy buys at market, if close price is higher than the previous close
during 2 days and the meaning of 9-days Stochastic Slow Oscillator is lower than 50.
The strategy sells at market, if close price is lower than the previous close price
during 2 days and the meaning of 9-days Stochastic Fast Oscillator is higher than 50.
Second strategy
This script shows a high and low period value.
Width - width of lines
SelectPeriod - Day or Week or Month and etc.
LookBack - Shift levels 0 - current period, 1 - previous and etc.
WARNING:
- For purpose educate only
- This script to change bars colors.
High Low Differential MeterYet another trend follower that is based on a very simple principle: Take the highest high and lowest low from a user defined bars back period, do an average between them and smooth them up with 3 possible moving averages, VIDYA, EMA and SMA, while VIDYA is the default.
What is VIDYA ?
Variable Index Dynamic Average (VIDYA) is similar to the Exponential Moving Average (EMA), but automatically adjusts the smoothing weight based on price volatility.
How to use:
GREEN : Up trending
LIGHT GREEN : Up trend reversal might occur.
RED : Down trending
LIGHT RED : Down trend reversal might occur.
NOTE: BAR COLORS are set to TRUE by default!
Follow for more indicators: www.tradingview.com

Percentage Oscillator Swing highest high and lowest lowThis is a simple but efficient indicator.
Its made from an oscillator, which is calculated from the current close price with the highest high and the lowest low over a period of time.
This way we can see how much prices has changed over a X ammount of candles ( in positive or negative ) .
Yesterday's open, high, low and closeA very simple script to plot the yesterday's OHLC, to be used in an intraday graph.
There were other scripts like this, but their code was ugly, filthy, smelly, and WET, so I did this.

Previous Day High - Low and EMA BandThe fib are plotted to previous day High and low to find next days support and resistance based on fibs.
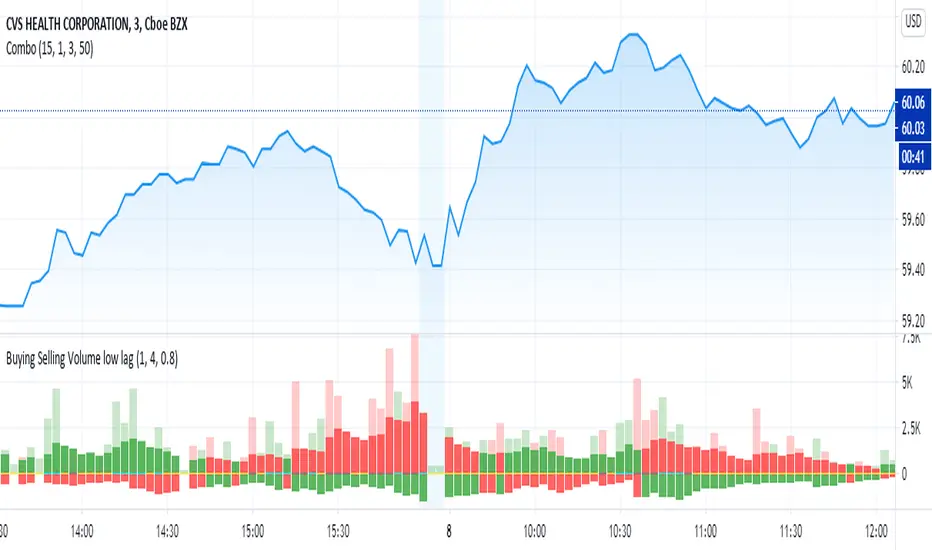
Buying Selling Volume low lagOriginally written by @ceyhun
I added a low lag filter to key components to smooth the bars. The user can adjust the parameters 'fast' and 'slow' to tune.
capam
The original comments of ceyhun are below repeated:
Buying Selling Volume
-Buy Volume
-Sell Volume
-Buy Volume Percent %
-Sell Volume Percent %
-Volume Index
-Buy Sell Volume-
BuyVolume>SellVolume=Blue barcolor
SellVolume>BuyVolume=Purple barcolor
-Volume Index-
VolumeIndex>length and close > open =Cyan barcolor
VolumeIndex>length and close < open =Gray barcolor
VolumeIndex<=length = Yellow barcolor
MWD Highs & LowsThis is a minor update and modification to the script by kisshore19: I updated a few pieces to make it v4 compliant (color. and syminfo. prefixes, etc), inserted the passed variables on the functions, and modified a few items per my preference (line style, removed the infinity offset, added transp). Very minor updates, the work is all credit to kisshore19. I wanted to be able to update which previous days/weeks were shown so bringing it up to date with v4 was the idea.

Derivative Pivot HL Points Hello.
This script aims to take into account mutable variable Pivot Points' periods.
While doing this, it takes the period between 2 signals that I use in the script:
And these periods in my Pivot HL function integrated into len length (Mutable variables) :
The cornerstone of the script is these facts.
Pivot can be optimized by playing with reversal periods.
These pre-formed levels can be used as Supply and Demand levels.
Regards.

Previous Candle High and LowThis Indicator add's a label over and below the previous candle which show's it's high and low values.
Anas persistence high low mva band using High and low band of moving average , if price persistence to be above the high MVA its strong probability of uptrend started . and the line turn green
and vice versa if for down trend it will turn red .


BBVV Low IndicatorThis is an indicator that flags the lowest Bollinger Bands Width value for a set number of bars back.
This is based on my BBVV script seen here
Each dot on the BBVV indicator marks the rolling "X"-period low in BBVV value. You can set "X" as any number of bars back in the settings of this indicator.
This can be used to accurately predict when periods of high-volatility could come into play due to continually contracting Bollinger Bands on a time-frame that you can set manually.
Created from a request from a user.