Search in scripts for "low"

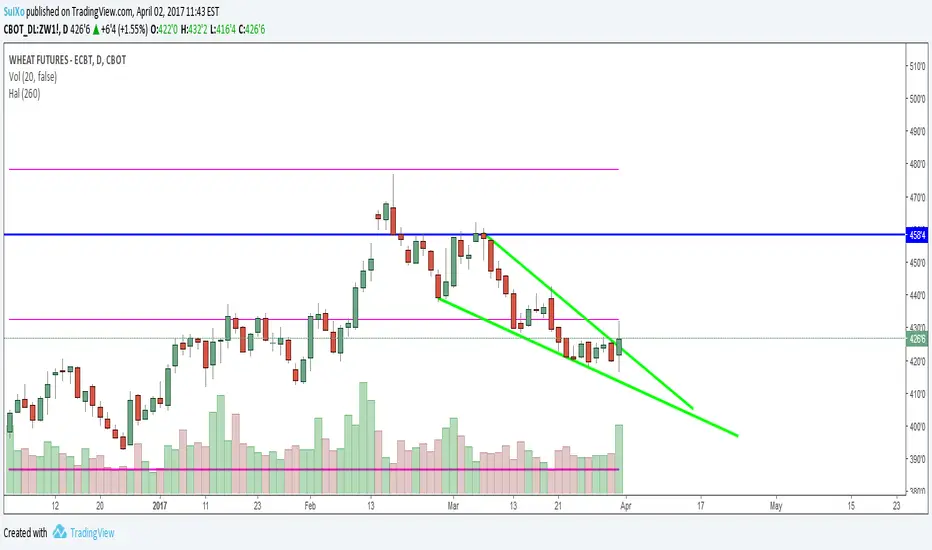
HalHighest High and Lowest Low within a given length. Default is 260 bars (approx 1 year)
Separated in 3 thirds with 2 middle lines. Lowest third, middle third and highest third.
Highest High and Lowest Low channel Backtest Highest High and Lowest Low channel Strategy
You can change long to short in the Input Settings
Please, use it only for learning or paper trading. Do not for real trading.


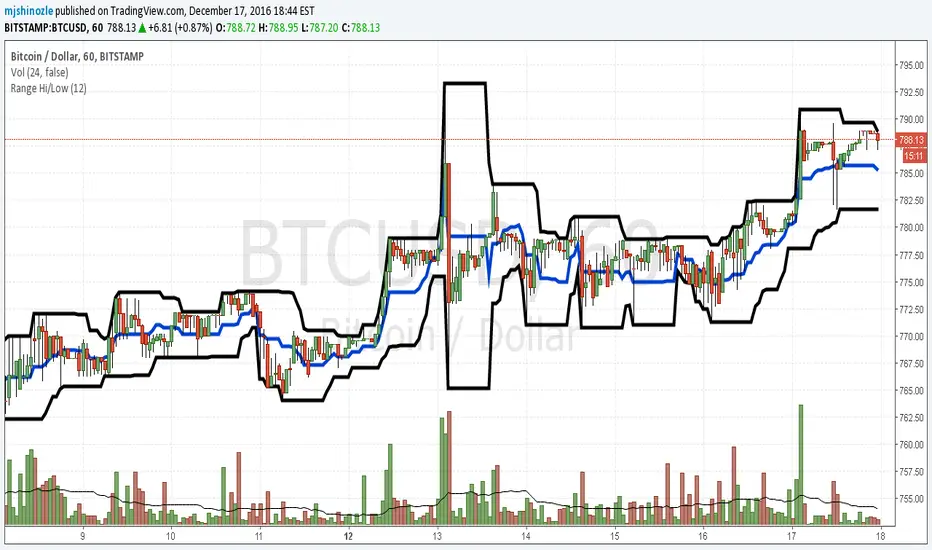
hi/low levels and fibsSlight development on previous range hi/low script. Plots highest lowest price over x periods, and the mid-point. Added to this are 2 sets of fib lines. That's it! :)

Hi Low and fibsSlight development on previous simple range hi/low script. Plots the highest and lowest of x periods, plus the mid point and 2 sets of fibs. That's it. :)

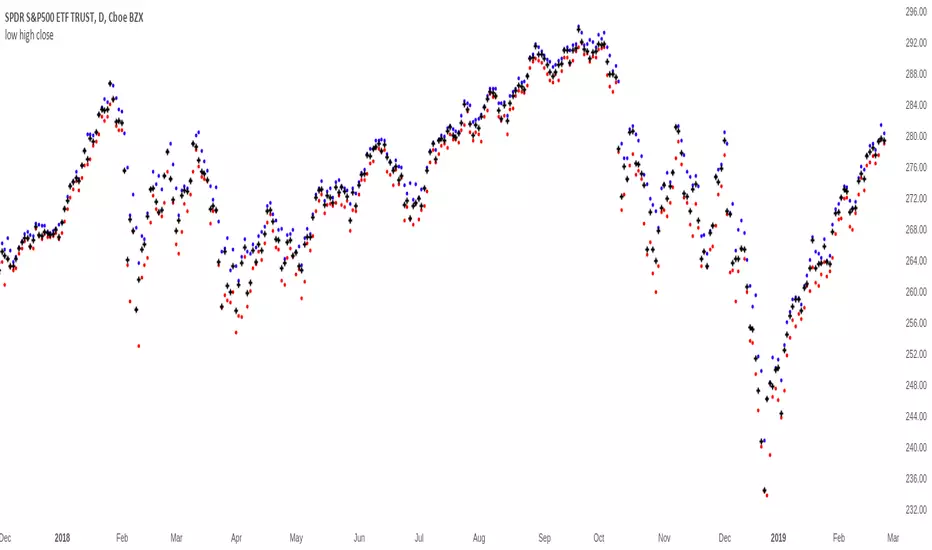
Simple Range Hi/LowSimple script and my first. Plots the high/low of x periods, and the mid-point. That's it.
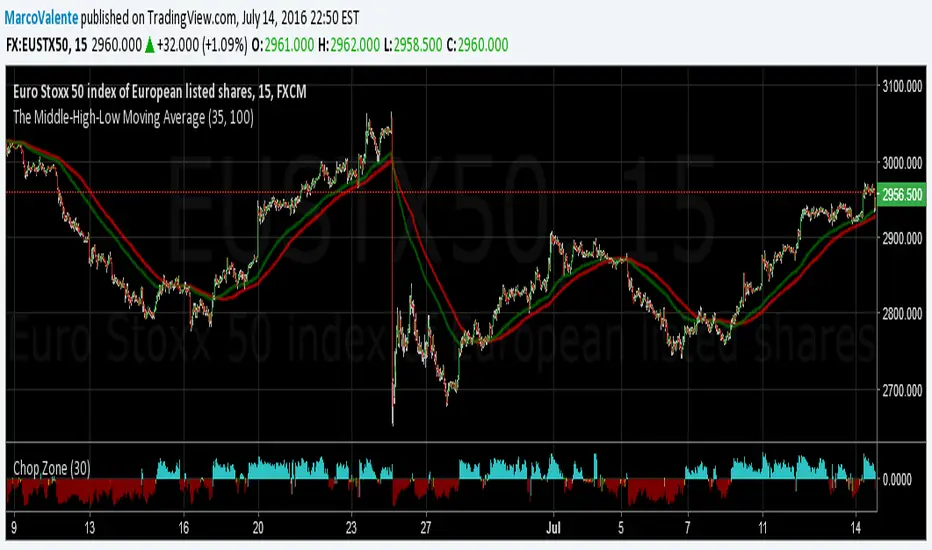
The Middle-High-Low Moving AverageA standard EMA and a Middle-High-Low EMA give a good signal when they cross
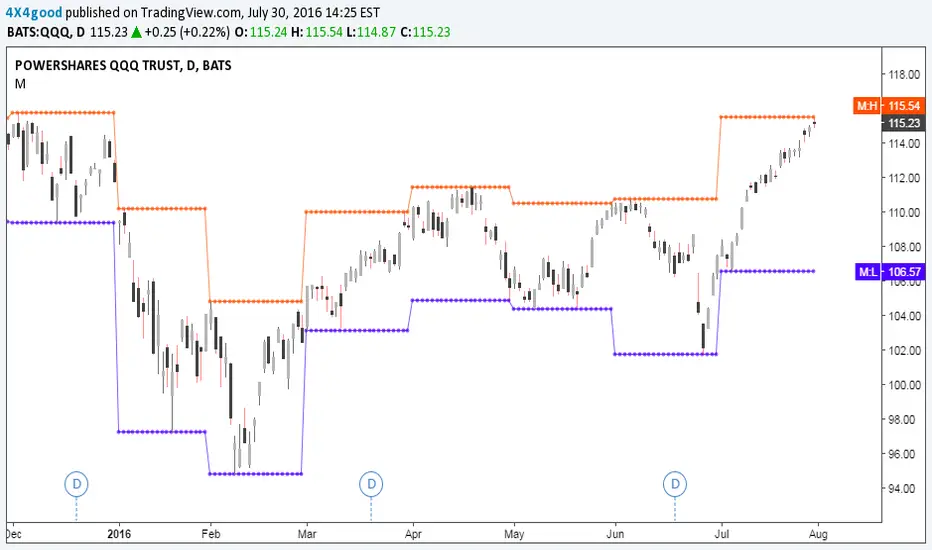
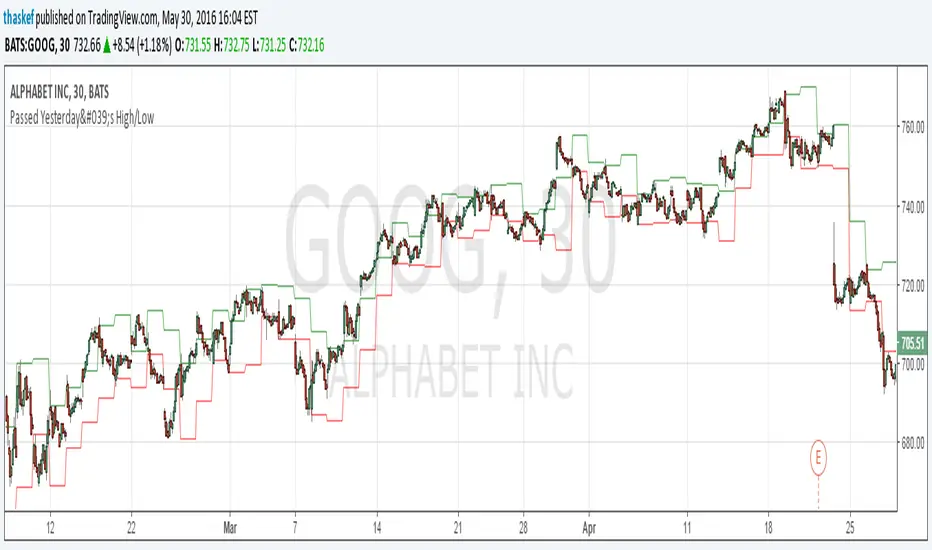
ALERT: Passed Yesterday's High/LowThis is just a simple script to show if the current price passed yesterday's high or low price. It will create an alert if so (which can be set up to notify you via email or text).
blog.tradingview.com
Kay_High_LowPrevious High low plotting.
COPIED from Chris Moody's script and adjusted it for my needs.

CD_Average Daily Range Zones- highs and lows of the dayUses daily average ranges of 5 and 10 (most used) as buy (support) and highs (resistance) areas - half ranges used in calculations for a more accurate "forecast" of the H and L . Uses open but not close, so it does not repaint - experimental

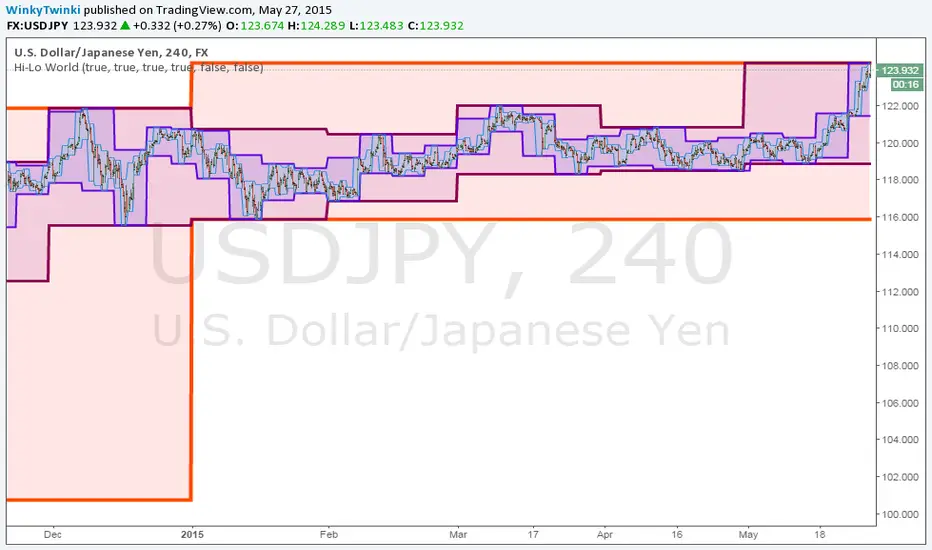
Hi-Lo WorldThis script plots the highs/lows from multiple timeframes onto the same chart to help you spot the prevailing long-term, medium-term and short-term trends .
List of timeframes included:
Year
Month
Week
Day
4 Hour
Hour
You can select which timeframes to plot by editing the inputs on the Format Object dialog.
_CM_High_Low_Open_Close_Weekly-IntradayUpdated Indicator - Plots High, Low Open, Close
For Weekly, Daily, 4 Hour, 2 Hour, 1 Hour Current and Previous Sessions Levels.
Updated Adds 4 Hour, 2 Hour, 1 Hour levels for Forex and Intra-Day Traders.


FNGAdataLow“Low prices for FNGA ETF (Dec 2018–May 2025)
The Low prices for FNGA ETF (December 2018 – May 2025) capture the lowest trading price reached during each regular U.S. market session over the entire lifespan of this leveraged exchange-traded note. Initially launched under the ticker FNGU, and later rebranded as FNGA in March 2025 before its eventual redemption, the fund was structured to deliver 3x daily leveraged exposure to the MicroSectors FANG+™ Index. This index concentrated on a small basket of leading technology and tech-enabled growth companies such as Meta (Facebook), Amazon, Apple, Netflix, and Alphabet (Google), along with a few other innovators.
The Low price is particularly important in the study of FNGA because it highlights the intraday downside extremes of a highly volatile, leveraged product. Since FNGA was designed to reset leverage daily, its lows often reflected moments of amplified market stress, when declines in the underlying FANG+™ stocks were multiplied through the 3x leverage structure.

Low volatility Buy w/ TP & SL (Coinrule)The compression of volatility usually leads to expansion. When the breakout comes, it can ignite strong trends. One way to catch a coin trading in an accumulation area is to spot three moving averages with values close to each other. The strategy uses a combination of Moving Averages to spot the best time to buy a coin before its breakout.
Buy Condition
The MA200 is greater than the MA100
The MA50 is greater than the MA100
According to backtesting results, the 1-hour time frame is the best to run this strategy.
Sell Condition
Take Profit: the price increases 8% from the entry price
Stop Loss: the price drops 4% from the entry price
The strategy has a profitability of 40-60% (depending on the market conditions). Having a ratio of two between Take profit and Stop Loss helps keeping the strategy profitable in the long term.


Sigma Trinity ModelAbstract
Sigma Trinity Model is an educational framework that studies how three layers of market behavior interact within the same trend: (1) structural momentum (Rasta), (2) internal strength (RSI), and (3) continuation/compounding structure (Pyramid). The model deliberately combines bar-close momentum logic with intrabar, wick-aware strength checks to help users see how reversals form, confirm, and extend. It is not a signal service or automation tool; it is a transparent learning instrument for chart study and backtesting.
Why this is not “just a mashup”
Many scripts merge indicators without explaining the purpose. Sigma Trinity is a coordinated, three-engine study designed for a specific learning goal:
Rasta (structure): defines when momentum actually flips using a dual-line EMA vs smoothed EMA. It gives the entry/exit framework on bar close for clean historical study.
RSI (energy): measures internal strength with wick-aware triggers. It uses RSI of LOW (for bottom touches/reclaims) and RSI of HIGH (for top touches/exhaustion) so users can see intrabar strength/weakness that the close can hide.
Pyramid (progression): demonstrates how continuation behaves once momentum and strength align. It shows the logic of adds (compounding) as a didactic layer, also on bar close to keep historical alignment consistent.
These three roles are complementary, not redundant: structure → strength → progression.
Architecture Overview
Execution model
Rasta & Pyramid: bar close only by default (historically stable, easy to audit).
RSI: per tick (realtime) with bar-close backup by default, using RSI of LOW for entries and RSI of HIGH for exits. This makes the module sensitive to intra-bar wicks while still giving a close-based safety net for backtests.
Stops (optional in strategy builds): wick-accurate: trail arms/ratchets on HIGH; stop hit checks with LOW (or Close if selected) with a small undershoot buffer to avoid micro-noise hits.
Visual model
Dual lines (EMA vs smoothed EMA) for Rasta + color fog to see direction and compression/expansion.
Rungs (small vertical lines) drawn between the two Rasta lines to visualize wave spacing and rhythm.
Clean labels for Entry/Exit/Pyramid Add/RSI events. Everything is state-locked to avoid spamming.
Module 1 — Rasta (Structural Momentum Layer)
Goal: Identify structural momentum reversals and maintain a consistent, replayable backbone for study.
Method:
Compute an EMA of a chosen price source (default Close), and a smoothed version (SMA/EMA/RMA/WMA/None selectable).
Flip points occur when the EMA line crosses the smoothed line.
Optional EMA 8/21 trend filter can gate entries (long-bias when EMA8 > EMA21). A small “adaptive on flip” option lets an entry fire when the filter itself flips to ON and the EMA is already above the smoothed line—useful for trend resumption.
Why bar close only?
Bar-close Rasta gives a stable, auditable timeline for the structure of the trend. It teaches users to separate “structure” (close-resolved) from “energy” (intrabar, via RSI).
Visuals:
Fog between the lines (green/red) to show regime.
Rungs between lines to show spread (compression vs expansion).
Optional plotting of EMA8/EMA21 so users can see the gating effect.
Module 2 — RSI (Internal Strength / Energy Layer)
Goal: Reveal the intrabar strength/weakness that often precedes or confirms structural flips.
Method:
Standard RSI with adjustable length and signal smoothing for the panel view.
Logic uses wick-aware sources:
Entry trigger: RSI of LOW (same RSI length) touching or below a lower band (default 15). Think of it as intraband reactivation from the bottom, using the candle’s deepest excursion.
Exit trigger: RSI of HIGH touching or above an upper band (default 85). Think of it as exhaustion at the top, using the candle’s highest excursion.
Realtime + Close Backup: fires intrabar on tick, but if the realtime event was missed, the close backup will note it at bar end.
Cooldown control: optional bars-between-signals to avoid rapid re-triggers on choppy sequences.
Why wick-aware RSI?
A close-only RSI can miss the true micro-extremes that cause reversals. Using LOW/HIGH for triggers captures the behavior that traders actually react to during the bar, while the bar-close backup preserves historical reproducibility.
Module 3 — Pyramid (Continuation / Compounding Layer)
Goal: Teach how continuation behaves once a trend is underway, and how adds can be structured.
Method:
Same dual-line logic as Rasta (EMA vs smoothed EMA), but only fires when already in a position (or after prior entry conditions).
Supports the same EMA 8/21 filter and optional adaptive-on-flip behavior.
Bar close only to maintain historical cohesion.
What it teaches:
Adds tend to cluster when momentum persists.
Students can experiment with add spacing and compare “one-shot entries” vs “laddered adds” during strong regimes.
How the Pieces Work Together
Rasta establishes the structural frame (when the wave flip is real enough to record at close).
RSI validates or challenges that structure by tracking intrabar energy at the extremes (low/high touches).
Pyramid shows what sustained continuation looks like once (1) and (2) align.
This produces a layered view: Structure → Energy → Progression. Users can see when all three line up (strongest phases) and when they diverge (riskier phases or transitions).
How to Use It (Step-by-Step)
Quick Start
Apply script to any symbol/timeframe.
In Strategy/Indicator Properties:
Enable On every tick (recommended).
If available, enable Using bar magnifier and choose a lower resolution (e.g., 1m) to simulate intrabar fills more realistically.
Keep On bar close unchecked if you want to observe realtime logic in live charts (strategies still place orders on close by platform design).
Default behavior: Rasta & Pyramid = bar close; RSI = per tick with close backup.
Reading the Chart
Watch for Rasta Entry/Exit labels: they define clean structural turns on close.
Watch RSI Entry (LOW touch at/below lower band) and RSI Exit (HIGH touch at/above upper band) to gauge internal energy extremes.
Pyramid Add labels reveal continuation phases once a move is already in progress.
Tuning
Rasta smoothing: choose SMA/EMA/RMA/WMA or None. Higher smoothing → later but cleaner flips; lower smoothing → earlier but choppier.
RSI bands: a common educational setting is 15/85 for strong extremes; 20/80 is a bit looser.
Cooldown: increase if you see too many RSI re-fires in chop.
EMA 8/21 filter: toggle ON to study “trend-gated” entries, OFF to study raw momentum flips.
Backtesting Notes (for Strategy Builds)
Stops (optional): trail is armed when price advances by a trigger (default D–F₀), ratchets only upward from HIGH, and hits from LOW (or Close if chosen) with a tiny undershoot buffer to avoid micro-wicks.
Order sequencing per bar (mirrors the script’s code comments):
Trail ratchet via HIGH
Intrabar stop hit via LOW/CLOSE → immediate close
If still in position at bar close: process exits (Rasta/RSI)
If still in position at bar close: process Pyramid Add
If flat at bar close: process entries (Rasta/RSI)
Platform reality: strategies place orders at bar close in historical testing; the intrabar logic improves realism for stops and event marking but final order timestamps are still close-resolved.
Inputs Reference (common)
Modules: enable/disable RSI and Pyramid learning layers.
Rasta: EMA length, smoothing type/length, EMA8/21 filter & adaptive flip, fog opacity, rungs on/off & limit.
RSI: RSI length, signal MA length (panel), Entry band (LOW), Exit band (HIGH), cooldown bars, labels.
Pyramid: EMA length, smoothing, EMA8/21 filter & adaptive adds.
Execution: toggle Bar Close Only for Rasta/Pyramid; toggle Realtime + Close Backup for RSI.
Stops (strategy): Fixed Stop % (first), Fixed Stop % (add), Trail Distance %, Trigger rule (auto D–F₀ or custom), undershoot buffer %, and hit source (LOW/CLOSE).
What to Study With It
Convergence: how often RSI-LOW entry touches precede the next Rasta flip.
Divergence: cases where RSI screams exhaustion (HIGH >= upper band) but Rasta hasn’t flipped yet—often transition zones.
Continuation: how Pyramid adds cluster in strong moves; how spacing changes with smoothing/filter choices.
Regime changes: use EMA8/21 filter toggles to see what happens at macro turns vs chop.
Limitations & Scope
This is a learning tool, not a trade copier. It does not provide financial advice or automated execution.
Intrabar results depend on data granularity; bar magnifier (when available) can help simulate lower-resolution ticks, but true tick-by-tick fills are a platform-level feature and not guaranteed across all symbols.
Suggested Publication Settings (Strategy)
Initial capital: 100
Order size: 100 USD (cash)
Pyramiding: 10
Commission: 0.25%
Slippage: 3 ticks
Recalculate: ✓ On every tick
Fill orders: ✓ Using bar magnifier (choose 1m or similar); leave On bar close unchecked for live viewing.
Educational License
Released under the Michael Culpepper Gratitude License (2025).
Use and modify freely for education and research with attribution. No resale. No promises of profitability. Purpose is understanding, not signals.
