Search in scripts for "macd"


DiNapoli MACD PredictorMACD Predictor is a useful indicator that paints dynamic support and resistance levels which are unknown to most of traders.
This version of the indicator includes the following options:
Price Projection of Next Candle
Stop Grabbers visual indication
Short Line mode to declutter the chart
Normal/Dark mode
Visual labelling of the line
Thickness of the lines
This indicator is meant to be used by a private group of traders.


MACD (Moving Average Convergence/Divergence) + Inside BarMACD (Moving Average Convergence/Divergence) + Inside Bar so that free users can have two things in same indicator.
Script is open for everyone.
Check and test the code of Inside Bar and let me know if it is correct.
Feel feel to share.

MACD CrossOver/CrossUnder Alert ScriptThe script let you know when to sell or buy around MACD indicator.

MACD for Buy & Sell signal indicatorMACD for Buy & Sell signal indicator last part of Buy and sell signal set. It was coded base on CCI source. Allow trader can read volume trade on market
1 set buy and sell signal
1- Buy & Sell signal indicator
2- RSI for Buy & Sell signal indicator
3- MACD for Buy & Sell signal indicator
*********************************************************************************************************************
Gửi anh chị trader đây là chỉ báo cuối cùng trong bộ chỉ báo tín hiệu mua bán. Là chỉ báo điều kiện sử dụng cùng với chỉ báo RSI để giúp cho nhà đầu tư đưa ra quyết định kịp thời dựa trên tổng số khối lượng gd thời điểm hiện tại

MACD Buy & Sell signalOverlayed MACD indicator shows Buy or Sell signal.
It indicates Pumping or Strong Buy signal when comparing to another time frame.
Example. 1hr time frame and 8hr(4hr) time frame in the vertical(horizontal) layout on TradingView.
MACD 지표에 따라서, 매수 / 매도 시그널을 보여줍니다.
1시간봉 및 8시간(4시간) 봉을 동시에 비교하면서 사용하세요.
레이아웃 고르기에서 수평 또는 수직으로 2등분하여 비교하시면 사용이 쉽습니다.

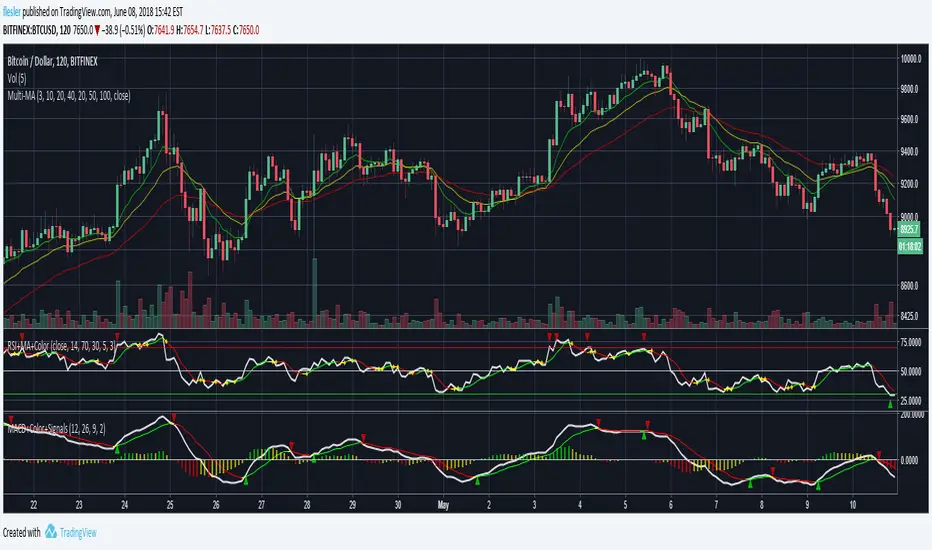
MACD + Colors + Signals
Standard MACD with signal and histogram
MACD and signal crossovers are marked with up/down triangles
Signal is colored based on its direction, can be turned to a single color
Histograms can be green, red and yellow based on their side and direction
Histograms can be switch to be green when positive and red when negative

MACD with highlighted positive and negative trendThe values used by this indicator are equal to MACD 12 26 9 (and Signal). Only changes are made to looks:
If MACD closes higher than Signal, then we are seeing green. Else, we are seeing red.
Another point is that we get a blue circle when there is a trend change from bullish to bearish or vice versa. Please note that there needs to be an offset for this. We will only see the circle, when there already WAS (instead of is) a trend change.
NeoButane Bollinger Band MACD Ribbon MACD with faster reacting parameters and Bollinger bands overlaid on it. It signals quite often so it is best to use with other indicators.
Wide ribbon: continuing trend
Ribbon pinch: reversal
Ribbon pinch outside of bands: strong reversal


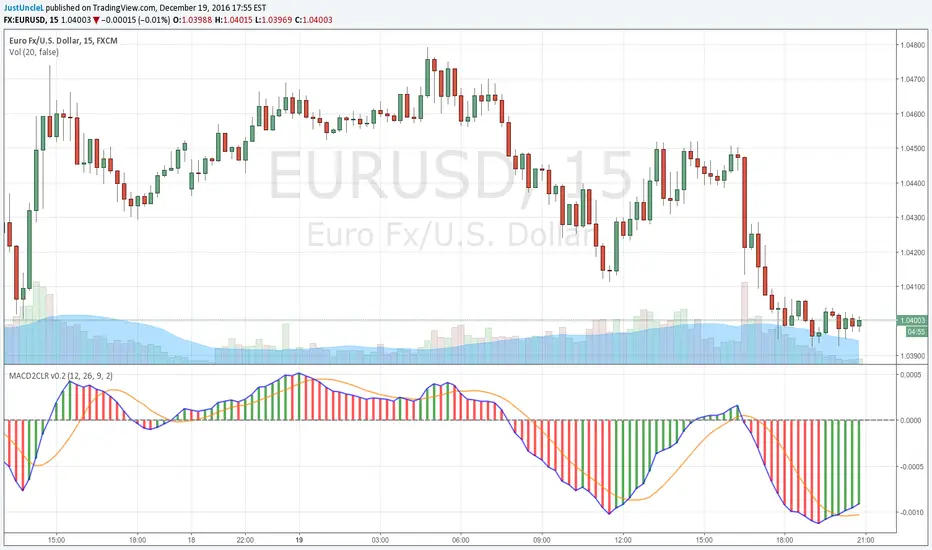
MACD DEUTER 2 colour v0.2 by JustUncleLThis is an updated version of the MACD DEUTER 2 colour indicator. This version includes the Signal line and option to change the length calculating the MACD direction change.
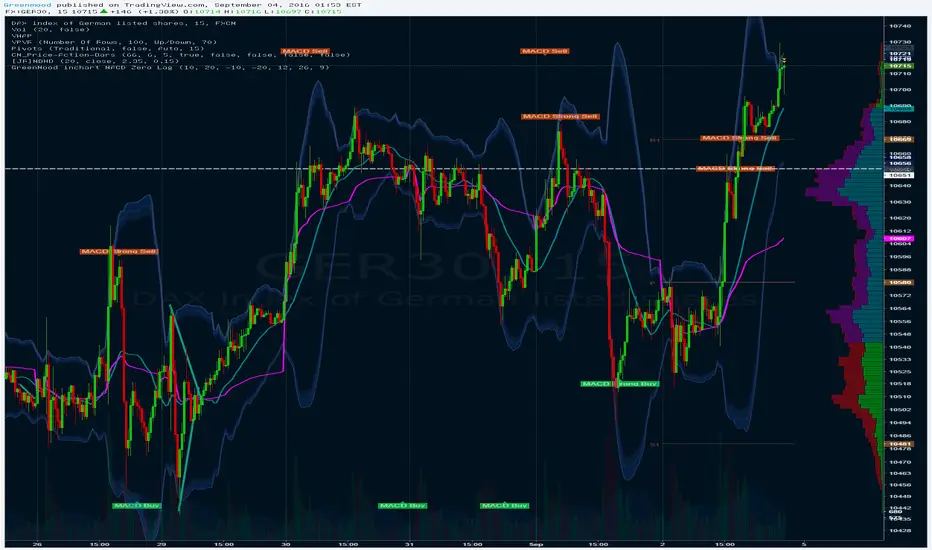
GreenMood inchart MACD Zero LagMACD Zero lag Visual inchart view.
Threshold / Settings can be changed in Format view.
Threshold to be adapted depending on timeframe.

MACD 4C4 Coloured MACD
lime = positive rising
green = positive descending
red = positive rising
maroon = positive descending
MACD 4C4 Coloured MACD
lime = positive rising
green = positive descending
red = positive rising
maroon = positive descending

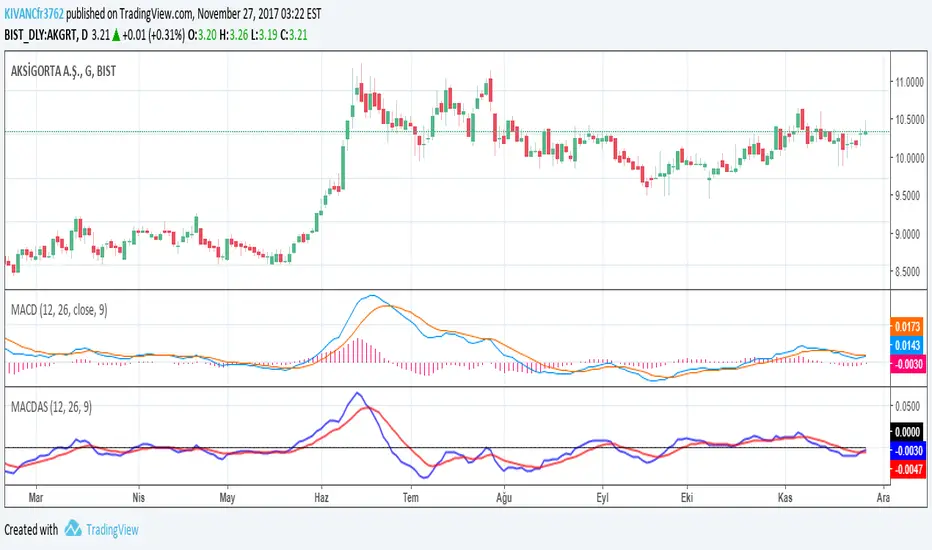
MACDASTHOMAS ASPRAY'S MACD by KIVANC @fr3762 on twitter
drive.google.com
This indicator is simply based on MACD HISTOGRAM'S 9 period EMA signal line
MACDAS = MACD HISTOGRAM= MACD - SIGNAL LINE of MACD
MACDAS SIGNAL LINE = 9 Period EMA of MACD
Note: Macd is originally calculated by using SMA but in this version both MACD and MACDAS and their signal lines are calculated by using EMA.
MACDAS provides earlier BUY / SELL signals than MACD.
TURKISH EXPLANATION:
Thomas Aspray'in bulduğu KIVANC @fr3762 tarafından yazılan versiyon
MACDnin Triggerı ile farkı (Histogram) ile bu farkın 9 günlük üssel hareketli ortalaması alınarak hesaplanmıştır
drive.google.com
Macd indikatörüne göre daha erken AL / SAT sinyalleri üretmektedir.
Kazançlı günlerde kullanmanız dileğiyle...
KıvanÇ
Normalized MACD by[@hadi_saadat]This MACD is exactly like standard MACD, but extremely stable and normalized by EMAs(200,150,100,50,30).
So you need at-least 30 candle to see the chart.
The Huge differences can be seen when the close price scale over time changes for instance go to the weekly time-frame, see the normalized MACD and Standard MACD when the BTC price was below 10k or even below 5k and compare two MACD charts (The standard one chart get almost vanished when the price was much cheaper and it doesnt scale well), then zoom in the standard MACD at that period and again compare it to The Normalized one(When you zoom in you will see surprisingly both MACDs are exactly the same form and shape, however normalized one doesn't need zoom-in and it is well scaled among the time and different prices), You will be surprised that how stable it is.
The normalizes MACDs, Signals and Histograms values are comparable to any other assets (obviously in same time-frame).

MACDeA different style of MACD indicator with different period values of WEIGHTED and EXPONENTIAL MOVING AVERAGES INSTEAD OF only EXPONENTIAL.
Default MOVING AVERAGES ARE
faster period: 8bars EMA
slower period: 13 bars EMA
signal period: 5 bars WMA
TURKISH EXPLANATION:
MACD indikatörünün sadece üssel yerine AĞIRLIKLI ve ÜSSEL hareketli ortalamalar kullanılarak daha erken sinyaller alabilmek için daha kısa periyotlarla yorumlanması
fikir @kenyaborsa on twitter
yazar: KIVANÇ @fr3762 on twitter
