Zero Lag MACD Enhanced - Version 1.1ENHANCED ZERO LAG MACD
Version 1.1
Based on ZeroLag EMA - see Technical Analysis of Stocks and Commodities, April 2000
Original version by user Glaz. Thanks !
Ideas and code from @yassotreyo version.
Tweaked by Albert Callisto (AC)
New features:
Added original signal line formula
Added optional EMA on MACD
Added filling between the MACD and signal line
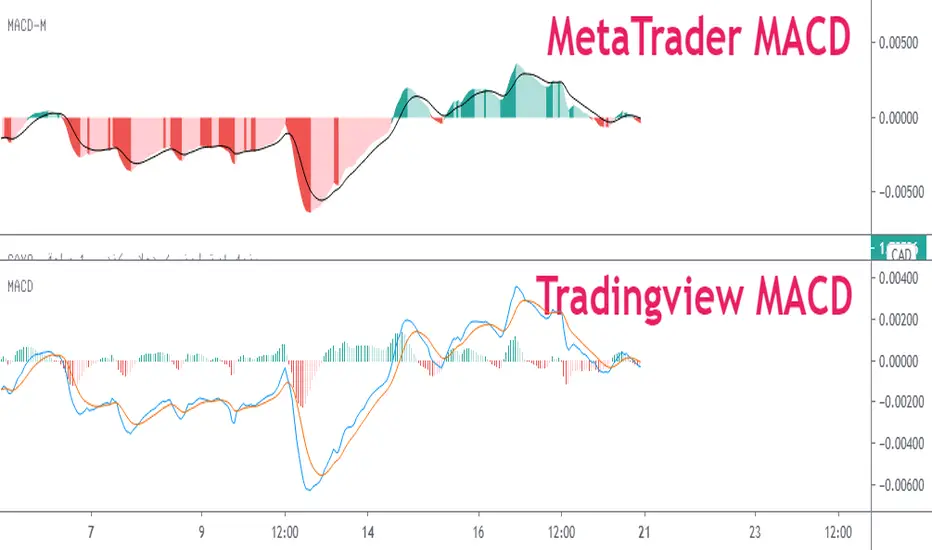
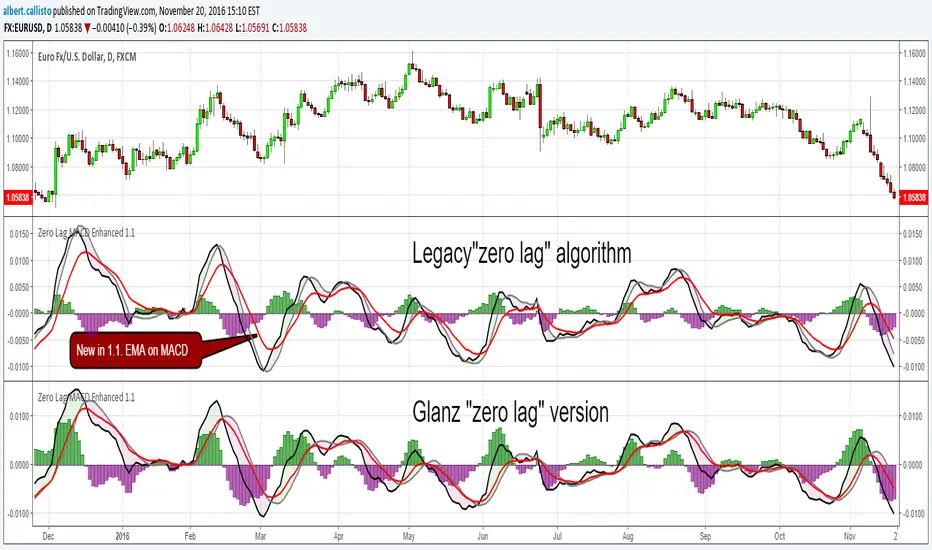
I looked at other versions of the zero lag and noticed that the histogram was slightly different. After looking at other zero lags on TV, I noticed that the algorithm implementation of Glanz generated a modified signal line. I decided to add the old version to be compliant with the original algorithm that you will find in other platforms like MT4, FXCM, etc.
So now you can choose if you want the original algorithm or Glanz version. It's up to you then to choose which one you prefer. I also added an extra EMA applied on the MACD. This is used in a system I am currently studying and can be of some interest to filter out false signals.
Search in scripts for "macd"
Stardust! v2.6 - MACD VariantBLAHBLAH. It's a MACD. Just faster than a normal MACD and more accurate by like tons. Eat cheesecake.

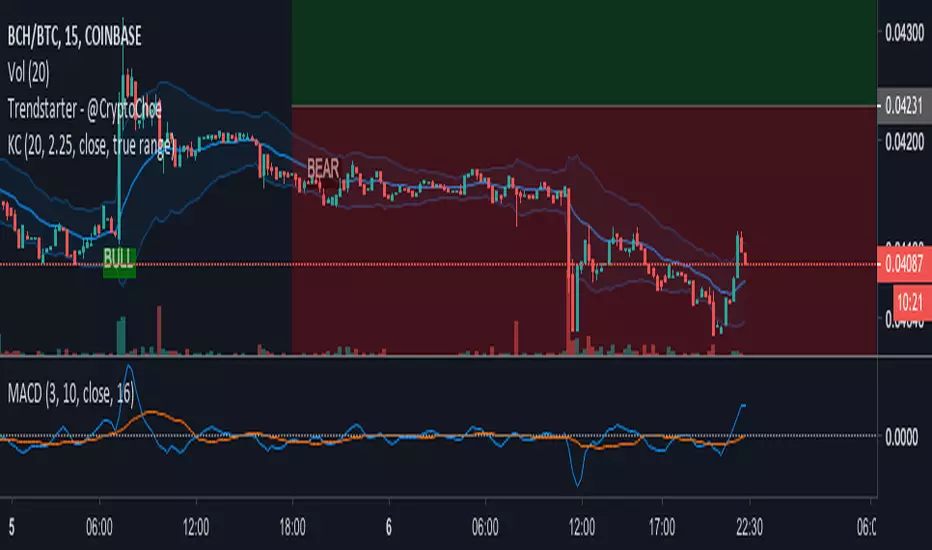
Modified MACD with Zero LineBased on Adam H. Grimes' Modified MACD. Uses a 3/10 simple MA for the fast line and a 16 for the signal line. Added a zero line.
MACD-V+MACD-V+ Indicator - Advanced Momentum Analysis
The MACD-V+ indicator is an enhanced version of the volatility-normalized MACD methodology developed by Alex Spiroglou. This approach addresses critical limitations of traditional MACD through ATR-based volatility normalization, providing comparable values across time and markets.
What is MACD-V?
MACD-V applies Average True Range (ATR) normalization to traditional MACD, creating a universal momentum indicator that works consistently across all markets and timeframes. The methodology was developed through extensive statistical research analyzing multiple markets and timeframes.
Formula: × 100
This normalization transforms MACD from price-dependent values into standardized momentum readings.
Traditional MACD Limitations
Limitation 1: Non-Comparable Values Across Time
Traditional MACD values cannot be compared across different time periods due to varying price levels. S&P 500 maximum MACD was 1.56 in 1957-1971, but reached 86.31 in 2019-2021 - not indicating 55x stronger momentum, but simply different price scales.
Solution: MACD-V provides comparable historical values where a reading of 100 today has the same mathematical meaning as 100 in any previous period.
Limitation 2: Non-Comparable Across Markets
Traditional MACD cannot compare momentum between different assets. S&P 500 MACD of 65 versus EUR/USD MACD of -0.5 reflects price differences, not relative strength.
Solution: MACD-V creates universal levels that work across all markets. The ±150 extreme levels apply consistently whether analyzing stocks, bonds, commodities, or currencies.
Limitation 3: No Objective Momentum System
Traditional MACD lacks universal overbought or oversold level definitions, making systematic analysis difficult.
Solution: MACD-V provides an objective 7-stage momentum lifecycle system with clearly defined zones and state transitions.
Limitation 4: Signal Line False Signals
In low momentum environments, traditional MACD generates multiple false signals as the line oscillates near zero.
Solution: MACD-V filters signal quality by identifying neutral zones (-50 to +50) where signal reliability is lower.
Limitation 5: Signal Line Timing Lag
During extreme momentum, traditional MACD signal line lags significantly due to large separation from the MACD line.
Solution: MACD-V anticipates timing issues in extreme momentum environments (±150) through zone-based analysis and lifecycle states.
Universal Application
MACD-V+ works across:
Individual Stocks
Forex Pairs
Commodity Futures
Cryptocurrencies
All Timeframes
Key Features
Zone System
Overbought Zone: Above +150 (extreme bullish momentum)
Rally Zone: +50 to +150 (strong bullish momentum)
Ranging Zone: -50 to +50 (neutral/low momentum)
Rebound Zone: -50 to -150 (strong bearish momentum)
Oversold Zone: Below -150 (extreme bearish momentum)
7-Stage Lifecycle States
Ranging: Neutral momentum in -50 to +50 zone
Rallying: Rally zone + MACD above Signal + rising momentum
Overbought: Extreme zone above +150
Retracing: Rally zone + MACD below Signal (pullback from overbought)
Reversing: Rebound zone + MACD below Signal + falling momentum
Oversold: Extreme zone below -150
Rebounding: Rebound zone + MACD above Signal (recovery from oversold)
Visual Status Display
Real-Time State Table: Shows current lifecycle state name
Color-Coded States: Blue (Rallying/Rebounding), Red (Overbought/Oversold), Orange (Retracing/Reversing), Gray (Ranging)
Strength Multiplier: Live histogram strength indicator (e.g., "x 1.45")
Enhanced Features (Plus)
Absolute Histogram MA: ATR-length moving average of absolute histogram values for strength measurement
Direction-Aware Display: MA line follows histogram sign (positive above 0, negative below 0)
Strength Multiplier: Current momentum vs. average strength ratio (always positive value)
Histogram Extreme Levels: Short-term overbought/oversold (±40) for pullback detection
Chart Legend - Visual Signal Guide
Lines and Histogram
🔵 Blue Line: MACD-V value (ATR-normalized momentum)
🟠 Orange Line: Signal line (9-period EMA of MACD-V)
📊 Histogram Bars: MACD-V minus Signal line (momentum differential)
Histogram Colors: Green shades (positive momentum), Red shades (negative momentum)
🟡 Yellow Line: Dynamic MA of absolute histogram values (follows histogram sign)
Background Colors
🟥 Light Red Background: Extreme overbought zone (MACD-V > +150)
🟩 Light Green Background: Extreme oversold zone (MACD-V < -150)
Horizontal Reference Lines
➖ +150 (Gray Dashed): Overbought extreme level
➖ +50 (Gray Dashed): Rally zone entry level
➖ 0 (Gray Solid): Zero line - trend separator
➖ -50 (Gray Dashed): Rebound zone entry level
➖ -150 (Gray Dashed): Oversold extreme level
Optional Histogram Levels
➖ +40 (Yellow Dashed): Histogram short-term overbought
➖ -40 (Yellow Dashed): Histogram short-term oversold
Status Table
📋 Top-Center Table: Current lifecycle state display
State Name: RANGING / RALLYING / OVERBOUGHT / RETRACING / REVERSING / OVERSOLD / REBOUNDING
Histogram Warning: Short-term overbought/oversold alerts (±40 levels)
State Label
📊 Label at MACD/Signal Midpoint: Current lifecycle state with strength analysis
State Name: RANGING / RALLYING / OVERBOUGHT / RETRACING / REVERSING / OVERSOLD / REBOUNDING
Strength Multiplier Interpretation:
- Strong acceleration (>1.75): Powerful momentum, trend continuation likely
- Moderate progression (1.25-1.75): Normal trend strength
- Trend continuation (0.75-1.25): Stable momentum near average
- Watch for reversal (0.25-0.75): Weakening momentum
- Trend exhaustion (<0.25): Very weak momentum, reversal possible
Trading Applications
1. Lifecycle State Trading
Enter Long: When state changes to "RALLYING" (strong bullish momentum established)
Enter Short: When state changes to "REVERSING" (strong bearish momentum established)
Exit/Reduce: When state reaches "OVERBOUGHT" or "OVERSOLD" (extreme levels)
Avoid Trading: When state is "RANGING" (low momentum, unreliable signals)
2. Zone-Based Trading
Rally Zone (+50 to +150): Look for pullback entries (histogram dips)
Rebound Zone (-50 to -150): Look for bounce entries (histogram rises)
Extreme Zones (±150+): Prepare for reversal or take profits
Ranging Zone (-50 to +50): Wait for breakout confirmation
3. Signal Line Crossovers
Bullish Cross: MACD-V crosses above Signal line (momentum shift up)
Bearish Cross: MACD-V crosses below Signal line (momentum shift down)
Quality Filter: Trust crossovers in Rally/Rebound zones, ignore in Ranging zone
4. Zero Line Crosses
Cross Above 0: Transition to bullish regime
Cross Below 0: Transition to bearish regime
Trend Confirmation: Strong trends keep MACD-V on same side of zero
5. Histogram Extreme Strategy
Above +40: Short-term overbought - potential pullback
Below -40: Short-term oversold - potential bounce
Use with Trend: Buy dips to -40 in uptrend, sell rallies to +40 in downtrend
6. Strength Multiplier Analysis
> 1.75: Strong acceleration - powerful momentum, trend continuation highly likely
1.25 to 1.75: Moderate progression - normal healthy trend strength
0.75 to 1.25: Trend continuation - stable momentum near average strength
0.25 to 0.75: Watch for reversal - momentum weakening significantly
< 0.25: Trend exhaustion - very weak momentum, reversal possible
Comprehensive Alert System
Lifecycle State Change Alerts
Range Entered (low momentum warning)
Rally Started (bullish momentum established)
Overbought Reached (extreme bullish level)
Overbought Exit (leaving extreme zone)
Retracing Started (pullback from overbought)
Reversal Started (bearish momentum established)
Oversold Reached (extreme bearish level)
Oversold Exit (leaving extreme zone)
Rebounding Started (recovery from oversold)
Alert Builder Integration
Binary outputs (1/0) for external alert systems:
Individual state flags for each of 7 lifecycle states
Strength multiplier value for programmatic trend assessment
Settings & Parameters
MACD Configuration
MACD Fast: Fast EMA period (default: 12)
MACD Slow: Slow EMA period (default: 26)
Signal Line: Signal smoothing period (default: 9)
Source: Price source (default: Close)
Zone Boundaries
Overbought: Extreme bullish level (default: 150)
Oversold: Extreme bearish level (default: -150)
Rally: Strong bullish zone entry (default: 50)
Rebound: Strong bearish zone entry (default: -50)
Histogram Bounds
Histogram OB: Short-term overbought (default: 40)
Histogram OS: Short-term oversold (default: -40)
Trend Filters
MA Type: Histogram strength MA calculation method (None / SMA / EMA)
Show Elder Impulse Plus: Bar color system based on EMA(13) + histogram direction
200 EMA trend: Trend Filter v1 - Bull/Bear classification (adaptive MACD-V levels)
50/200 EMA 6-stage: Trend Filter v2 - Chuck Dukas Diamond 6-stage market classification
Best Practices
Trending Markets
Focus on "RALLYING" or "REVERSING" states for entries
Use histogram pullbacks (±40) for position additions
Monitor strength multiplier - exit if drops below 0.25
Take profits in extreme zones (±150+)
Yellow MA crossing histogram warns of momentum shift
Ranging Markets
Avoid trading when state is "RANGING"
Wait for clear zone entry (Rally/Rebound zone)
Use shorter timeframes for precision
Reduce position sizes due to lower reliability
Multi-Timeframe Analysis
Higher timeframe: Identify market regime (lifecycle state)
Lower timeframe: Time precise entries (histogram pullbacks)
Alignment: Trade only when both timeframes agree on direction
Risk Management
Reduce position size in extreme zones (±150+)
Use lifecycle state changes for stop-loss placement
Scale out of positions when strength multiplier < 0.25
Avoid counter-trend trades in strong states (RALLYING/REVERSING)
Watch yellow MA - when it crosses below histogram absolute value, momentum weakening
Combining with LBR 3/10-V Indicator
MACD-V+ and LBR 3/10-V create a powerful two-timeframe momentum system for strategic direction and tactical timing.
Strategic Filter: MACD-V+ determines WHETHER to trade (market regime)
Tactical Precision: LBR 3/10-V determines WHEN to enter (timing)
Double Confirmation: Both indicators must agree on direction
Lifecycle Management: Exit when MACD-V+ state changes
Strength Validation: Use MACD-V+ multiplier for position sizing
Extreme Respect: Both hitting extremes = high reversal probability
Methodology
MACD-V methodology is based on volatility normalization using Average True Range (ATR). This approach transforms traditional MACD into a universal momentum indicator with statistically-validated zones and objectively-defined states.
The indicator implements:
ATR-based normalization for cross-market comparability
Statistical analysis for universal zone definitions (±150, ±50)
Lifecycle state system for objective trend identification
Absolute histogram MA with direction-aware visualization (ATR-length period)
Strength multiplier: ratio of current to average absolute momentum (always positive)
Dynamic status table adapting to active trend filters
MACD-V+ transforms momentum analysis from subjective interpretation into objective, quantifiable measurements. Combined with LBR 3/10-V for tactical timing, it provides a complete framework for systematic trading across all financial markets and timeframes.
This indicator is designed for educational and analytical purposes. Past performance does not guarantee future results. Always conduct thorough research and consider consulting with financial professionals before making investment decisions.

Uptrick: MACD Slope Buy/Sell SignalsThe "Uptrick: MACD Slope Buy/Sell Signals" indicator is an advanced technical analysis tool meticulously crafted to provide traders with precise buy and sell signals derived from the slope changes of the Moving Average Convergence Divergence (MACD) signal line. This indicator integrates user-defined parameters for the MACD calculation, including the fast length, slow length, and signal smoothing period. These parameters allow traders to customize the indicator according to their specific trading strategies and timeframes, ensuring adaptability across various market conditions.
The primary function of this indicator is to monitor the slope of the MACD signal line and detect significant shifts that indicate potential changes in market momentum. The indicator calculates the slope by comparing the current value of the signal line to its previous value, and further determines the change in slope to identify acceleration or deceleration in the trend. A buy signal is generated when the slope of the signal line transitions from negative to positive, signaling an upward momentum, while a sell signal is triggered when the slope moves from positive to negative, indicating a downward trend. To enhance signal accuracy, the indicator distinguishes between regular and strong signals. A strong buy signal requires the slope change to be greater than the simple moving average (SMA) of recent slope changes, whereas a strong sell signal necessitates the slope change to be less than the negative SMA of recent slope changes.
A unique feature of this indicator is its dynamic and intuitive visualization. When a strong buy or sell signal is identified, it plots labels ('B' for buy and 'S' for sell) directly on the price chart. These labels are strategically positioned below or above the respective bars to ensure clear visibility and reduce chart clutter. The indicator also includes an option to connect consecutive signals with lines, which enhances the visual tracking of signal sequences and provides a coherent view of the trend's progression. The color intensity of the plotted signals varies based on the absolute value of the slope, offering an immediate visual cue on the strength of the detected trend changes. A steeper slope results in a darker color, signaling a stronger trend.
To facilitate comprehensive analysis, the indicator also plots the MACD and signal lines on the chart, providing traders with a reference to the underlying data that drives the buy and sell signals. These lines are color-coded for easy differentiation: the MACD line is typically blue, and the signal line is orange. This visual aid ensures that traders have a clear understanding of the indicator's basis and can cross-reference the generated signals with the MACD behavior.
The calculation of this indicator is grounded in well-established technical analysis principles. It employs the MACD function to derive the MACD line and signal line based on the user-defined parameters. The slope of the signal line is then computed, followed by the calculation of the slope change. The buy and sell signals are determined by comparing the current and previous slopes, and the strong signals are filtered through an additional layer of slope change analysis relative to its moving average.
The accuracy and reliability of the "Uptrick: MACD Slope Buy/Sell Signals" indicator stem from its thorough and methodical approach to signal generation. By combining user customization, detailed slope analysis, and robust visual elements, this indicator serves as a powerful tool for traders seeking precise entry and exit points in the market. Its ability to adapt to different trading styles and market conditions, coupled with its clear visual cues, makes it a valuable addition to any trader's toolkit, enhancing decision-making and improving trading outcomes.

5 min scalp macd5 min scalp macd, 5 min scalp macd, 5 min scalp macd, 5 min scalp macd, 5 min scalp macd, 5 min scalp macd, 5 min scalp macd, 5 min scalp macd

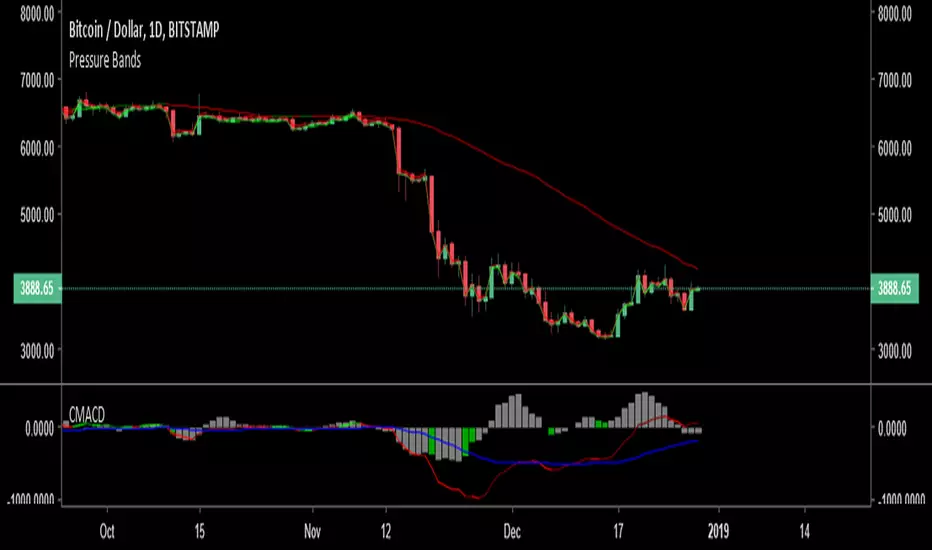
G-MACD ColorIt's just MACD and fill the color
How to use
RED : MACD < Signal line and MACD < 0
Blue : MACD > Signal line and MACD < 0
GREEN : MACD > Signal liine and MACD > 0
Yellow : MACD < Signal line and MACD < 0
Goodluck :D

Sk Macd TrendSk Macd Trend + Hidden Bullish MACD Divergence (Enhanced)
Original Author: Sujeetjeet1705
Enhanced by: Community Contribution (MACD-style Hidden Bullish Signal)
A powerful and widely respected WaveTrend-based oscillator with all the original premium features intact:
• Laguerre-smoothed WaveTrend (WT1 & WT2)
• Professional 4-color momentum histogram (strong/weak bull & bear)
• Filled MACD/Signal area for instant trend bias
• Built-in regular + hidden divergences (signal & histogram)
• Smart trailing stop system with ATR-based dynamic stops
• Clean buy/sell cross signals with overbought/oversold filtering
NEW POWERFUL ADDITION:
Hidden Bullish MACD-Style Divergence Detector
(Exactly like institutional MACD hidden bullish setups)
The indicator now highlights — with a bright blue histogram bar and a blue square below the price candle — when ALL three high-probability conditions are met simultaneously:
1. WaveTrend Histogram (wt3) is below zero (still in bearish territory)
2. Histogram is rising (wt3 > wt3 ) → momentum turning up
3. Price makes a higher low (low > low ) → bullish hidden divergence
This is one of the strongest early-reversal signals in technical analysis and often marks the exact bottom before explosive bounces.
Key Features:
• Blue square appears directly on the main chart (overlay)
• Histogram turns solid blue only on valid setups (very easy to spot)
• No repainting — 100% real-time reliable
• Works perfectly on all timeframes and assets
• All original features, colors, and logic preserved
Perfect for swing traders, reversal hunters, and anyone looking to catch major turns early.
Use with confidence — this is now one of the most complete and visually intuitive WaveTrend oscillators available on TradingView.
Enjoy the edge!

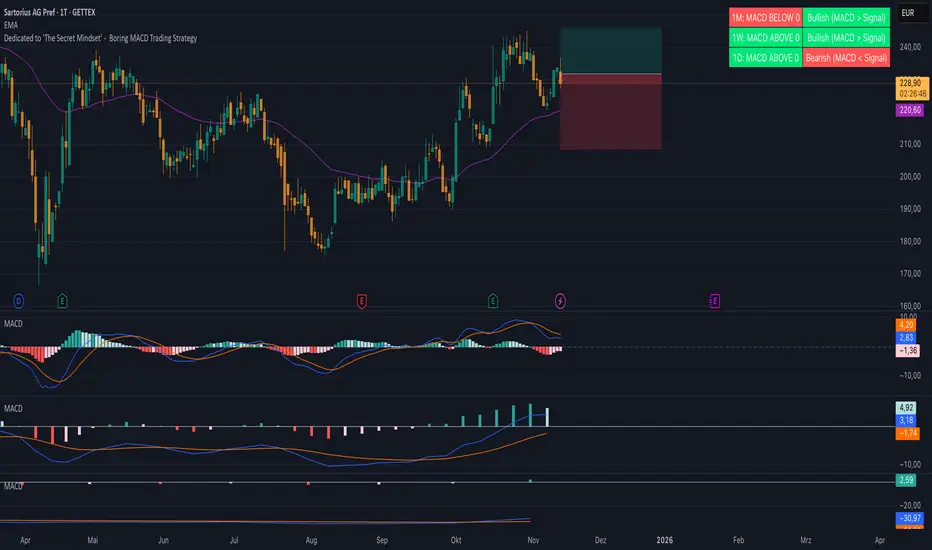
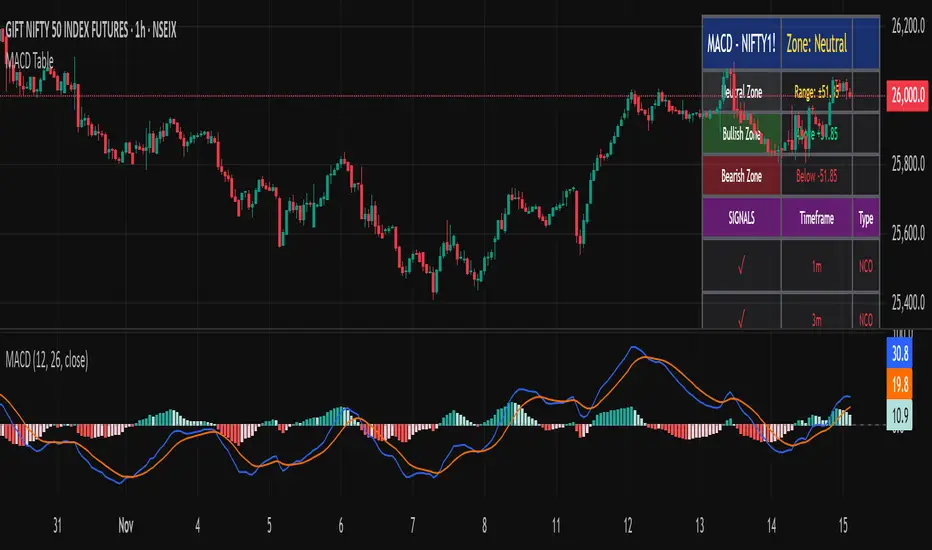
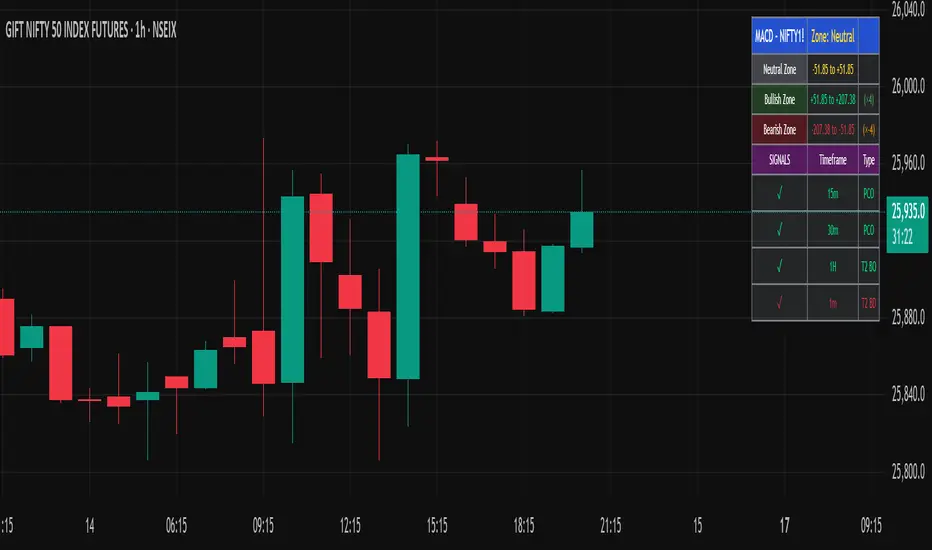
Boring MACD Trading Strategy - Dedicated to 'The Secret Mindset'This indicator displays the MACD status across three selectable timeframes, regardless of the chart timeframe you are currently viewing.
For each timeframe, it shows whether the MACD line is above or below the zero line, indicating bullish or bearish momentum.
It also shows whether the MACD line is above or below the signal line, revealing the current trend condition as bullish, bearish, or neutral.
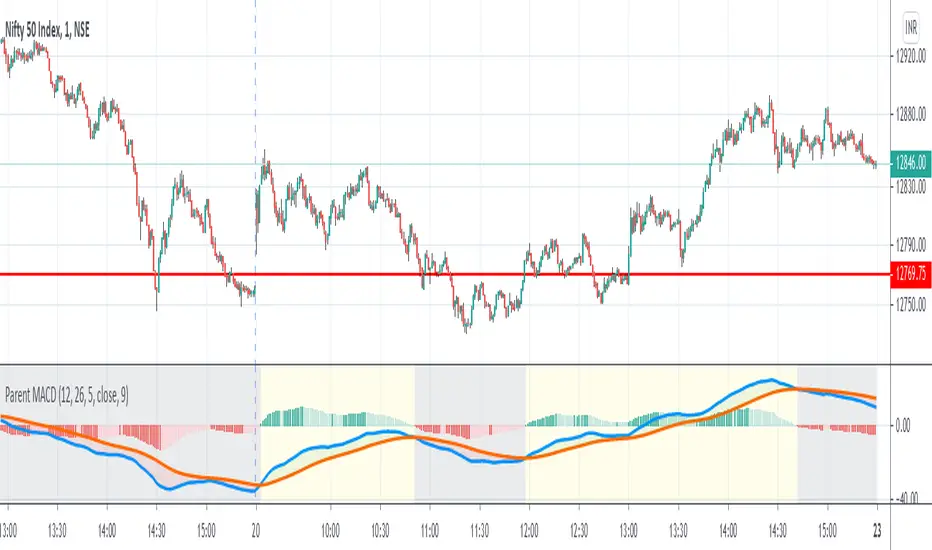
1 Parent MACDWhat is Parent MACD ?
Parent MACD is standard MACD indicator with one additional parameter of Parent. Parent MACD is designed so that you should be able to see cyclical behavior of current trend without having to switch to higher timeframe.
Why You Need This Indicator ?
Technical Analysis is defined as Art of Identifying trend in its early stages and riding on that trend until weight of evidence shows or proves the trend has finally reversed.
Technical Trading is literally 2 step process,
STEP 1 Find Direction of Trend
STEP 2 Trade in Direction of Trend
The direction of trend is taken from higher timeframe (aka parent timeframe) than your trading timeframe. The parent timeframe is 4,5 or 6 times of your trading timeframe if noise is less, if noise is extreme 6,7 or 8 is used as parent. Default Parent in this indicator is 5 and can be modified according to need of trader .
This indicator will tell you that parent timeframe is gaining momentum, if parent is gianing momentum most likely the trading time frame will also gain momentum.
How To Use This Indicator
STEP 1: Select The Time Frame You Want To Trade
STEP 2: Add the indicator on Screen
STEP 3:When you see price gaining momentum add a confirmation indicator to take trade.
Personally I use Profit Max indicator by KivancOzbilgi to confirm trade. If you are planning to use it too, don't forget to say thank you to KivancOzbilgi at in.tradingview.com
Practical Application To Trading
The indicator's most practical application is Option Trading and Trading Assets that trade 24 hours a day.
It can also be used to trade all kind of Index Options.
Indian Index Nifty
Indian Financial Index Nifty Bank
Dow Jones Industrial Average
BTC Index
IMPORTANT : The indicator only helps in trading in direction of Trend by identifying is trend regaining momentum after correction, it doesn't help you identify Trend, you have to identify trend.
Regards,
Nrupen
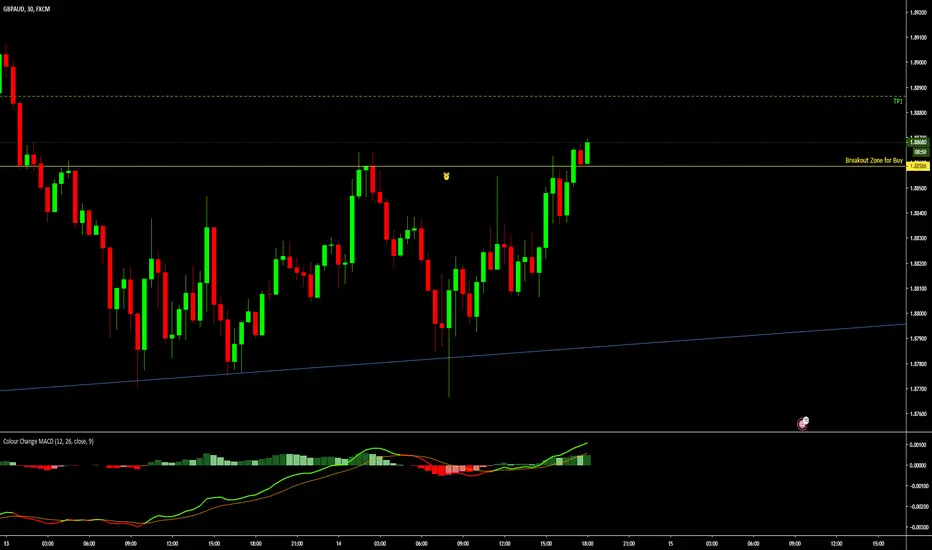
Colour Change MACDTradition MACD but the MACD Line changes colour when it crosses the Signal line
Green indicates a buyers market
Red indicates a seller's market
The ideal time to BUY is when the MACD line is GREEN heading upwards and above or crossing the Histogram
The Ideal time to sell is when the MACD line is RED heading down and Below or crossing from top to bottom of the Histogram
Adjustable MACD AlertNow u can use this script to set A-MACD long/short alert.
If u are curious about the numerical benefits of the settings, you can use the backtest version test.
Here is the backtest version link.

Custom MACDMulti indication MACD , the macd coloring indicates when the trend is aligned with the indicator direction , the macd signal line measure's market sentiment blue for bearish yellow for bullish , the histogram works off rate of change rather then the cross over and color of the histogram indicates possible bull or bear reversal of trend
Multi Color Normalized MACD + Candles (NMACD) [cI8DH]One simple indicator for volatility, divergence and relative momentum
Features:
- Normalized MACD (by slow MA)
- Candle MACD (fast MA length is set to 0 in candle mode, i.e. price minus slow MA)
- Multi color histogram
- Background coloring based on MACD direction
- Choice of different MA types (Exponential, Simple, Weighted, Smoothed, Triple EMA)
- Triple EMA smoothing
Benefits of normalization:
- Absolutely better than RSI for comparing across different periods and assets
Applications and benefits of candle visualization:
- Zero cross: most traders use MAs overlaid on the main chart and look for price distance and MA cross visually. In candle mode, this indicator measures the difference between price and the slow moving MA. When this indicator crosses zero, it means price is crossing the slow moving MA.
- Divergence: full candle visualization (OHLC) is not possible for most other indicators. Candle visualization allows measuring divergence between price high, low and close simultaneously. Some trades incorrectly measure divergence between high, low of price against indicator tops and bottoms while having the indicator input set to default (usually close). With this indicator, you don't need to worry about such complexities.
Recommended setting:
- Enjoy candle mode :)
- Source set to hlc3

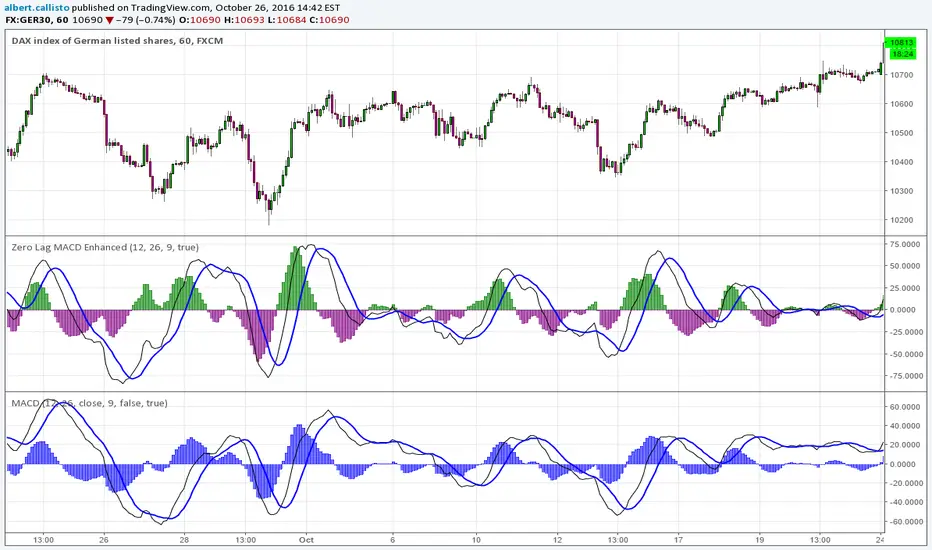
Zero Lag MACD Enhanced - Version 1.0*Zero Lag MACD indicator - Enhanced version 1.0*
Based on ZeroLag EMA - see Technical Analysis of Stocks and Commodities, April 2000
Original version by user Glaz. Thanks ! (see at the end of this description).
Tweaked by Albert Callisto
Displayed components:
Fast and slow "zero lag" moving averages
Histogram showing delta between the two moving averages
You can choose between SMA or EMA for the moving averages. They give slightly different results. Glaz had used SMA instead of EMA. Most "zero MACD" scripts are based upon EMA.
Usage is similar to the classic MACD and it can be integrated in an existing strategy, you will notice the crossing occurs earlier.
This is the original version by Glaz:
SMACD - Standardised MACDStandardised MACD - this uses the MACD indicator, but expressed as a percentage of Close price. This allows for the relative comparison between stocks which have different absolute values. MACD will give a high value to a high priced stock, whereas SMACD will represent stock performance in a standardised format, relative to the closing price of the stock. It effect it represents the MACD as a percentage of share price. An added advantage of SMACD over MACD is that since the indicator is relative to the price, later values are not inflated (assuming rising trend). Thus the scale is not linear, rather it more like a log scale, offering a truer picture of growth over time. It is for this reason the SMACD lines may slightly differ from MACD, but it is a more valid representation in my view. The difference is minor. (Developed by Des Bleakley - Melbourne)

GSC MACD by TejasThis script is based Mr. Saleel Choudhary, GSC Academy MACD Concepts. This indicator is available only for the GSC Students and No one else.
GSC MACD by TejasThis is an indicator based on Mr. Saleel Choudhary, GSC Academy MACD signals. This indicator is only and only available to GSC Students and Nobody else.
BR Cross Swing - MACD HistRawThis strategy looks at the MACD Relationship through the same logic but mainly focuses on breaking things down and the application on raw values.

Sharktank - MACD ExtendedThe MACD, but with added features. Features are:
* Different color schemes.
* Change between different MA types (EMA and SMA) for both the oscillator and the signal MA.
* Show normal bearish and bullish divergence on both the oscillator and the signal MA.
* Show hidden bearish and bullish divergence on both the oscillator MA and the signal MA.
* Change line styles.