Search in scripts for "macd"
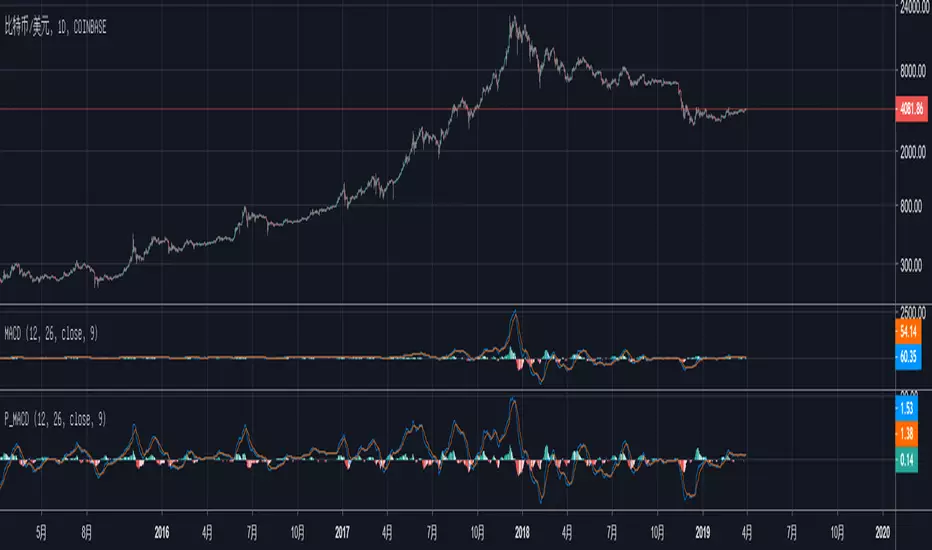
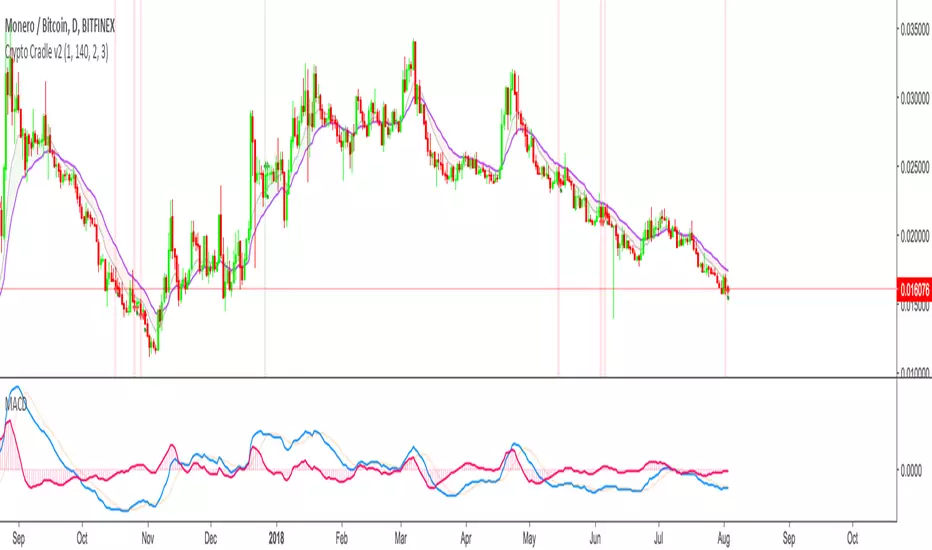
Percentage MACDPercentage MACD number range won't change with the great price change.
Convenient for log scale.
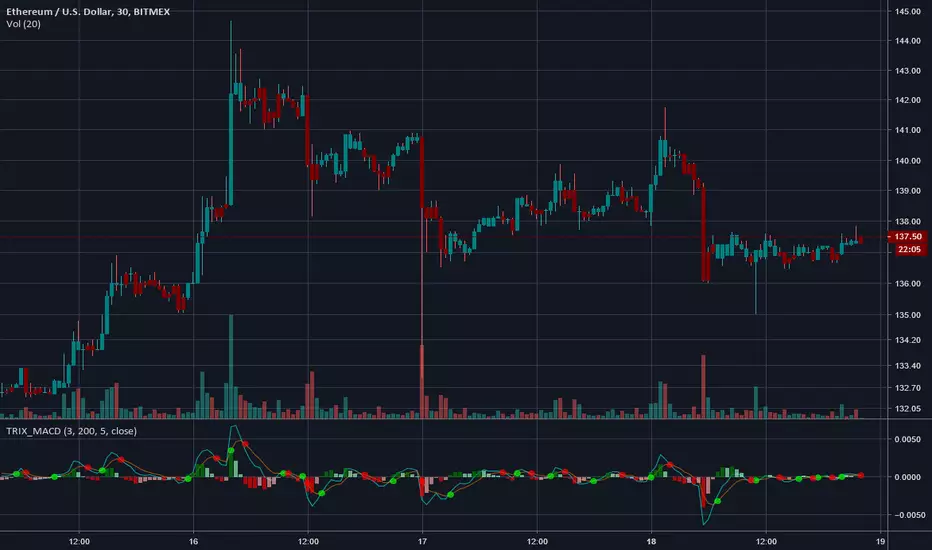
TRIX MACDAn experiment using TRIX to construct a MACD instead of the standard EMAs.
Warning - colors bars (can be disabled in settings)
Optional volume weighting.
-----------------------------------------------------------------------------------
If you find it useful please consider a tip/donation : BTC - 3BMEXEDyWJ58eXUEALYPadbn1wwWKmf6sA
Multi function MACDMulti function MACD with auto divergence marking and a colorful dif line include pink,red,green and gray which may show the trade of market
多功能MACD,自动标记背离,移植了通达信的吸拉派落到dif线


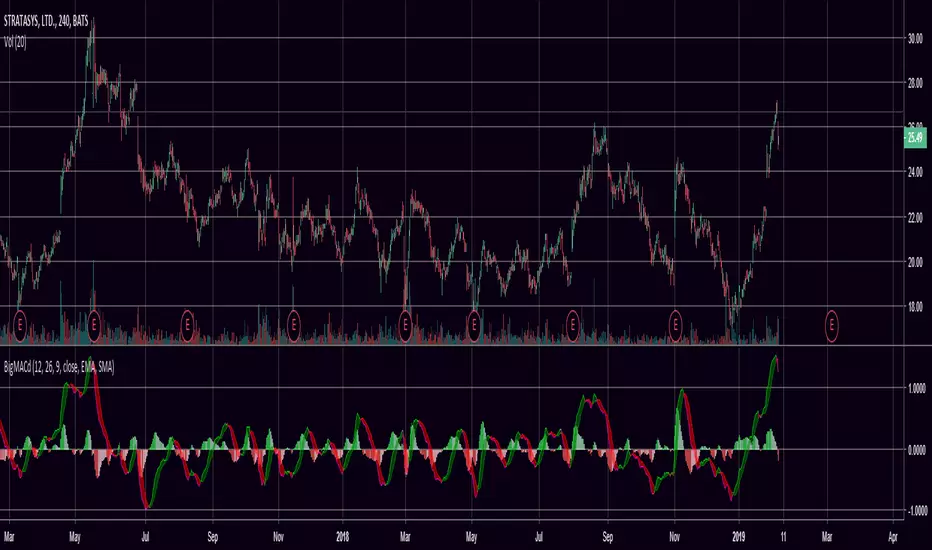
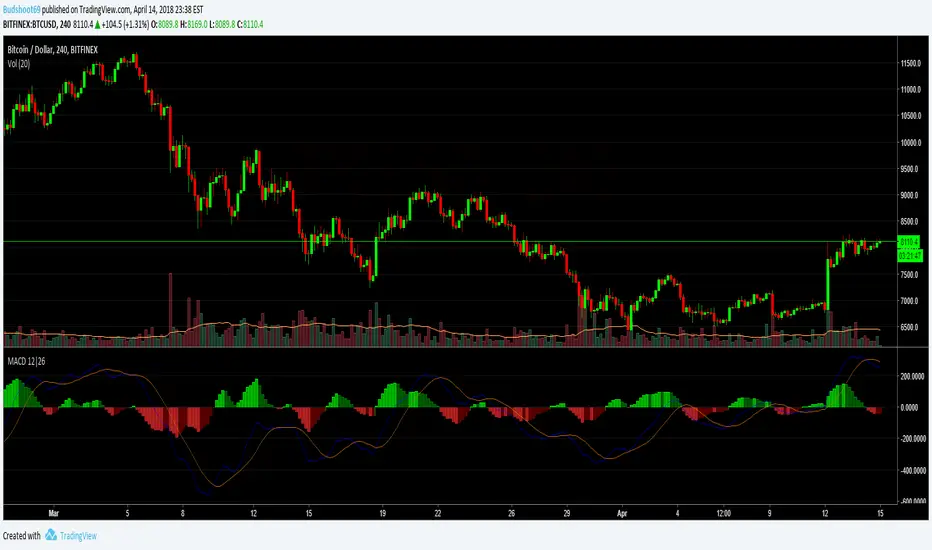
Multicolor MACD 12 & 26 periodIf you're tired of the single colored MACD indicator on TradingView, this is a good alternative. Setup with the same 12 & 26 day periods but has clear green/red histogram.
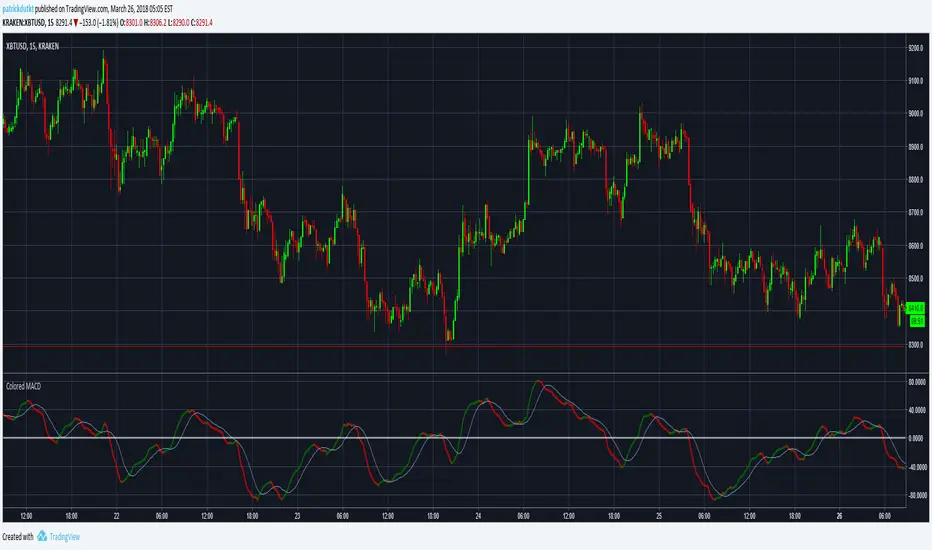
Riz Coloured MACD - StudyThis is a souped up common or garden MACD . The Histogram is coloured giving a clear visual representation of where we are UpTicking or DownTicking on the Histogram to help support trading decisions.
When colour changes from pink to green market is bullish , and visa versa.
Very useful as a supporting indicator to confirm other strategies, or even as a standalone strategy to some extent.
Backtesting of strategy is enabled by converting script from a Study to a strategy, see comments in code. This version focuses on this indicators use as a day to day study rather than a useful strategy for automated trading.

Zero Lag MACD Enhanced - Version 1.2ENHANCED ZERO LAG MACD
Version 1.2
Based on ZeroLag EMA - see Technical Analysis of Stocks and Commodities , April 0.21% 2000
Original version by user Glaz. Thanks !
Ideas and code from @yassotreyo version.
Tweaked by Albert Callisto ( AC )
New features:
On request by a user, added symbols to show the histogram crossing, can be either circles, cross symbols, a vertical bar. Colors can be chosen. You can also set the distance between the main axis and the symbols which are shown along the signal curve path.


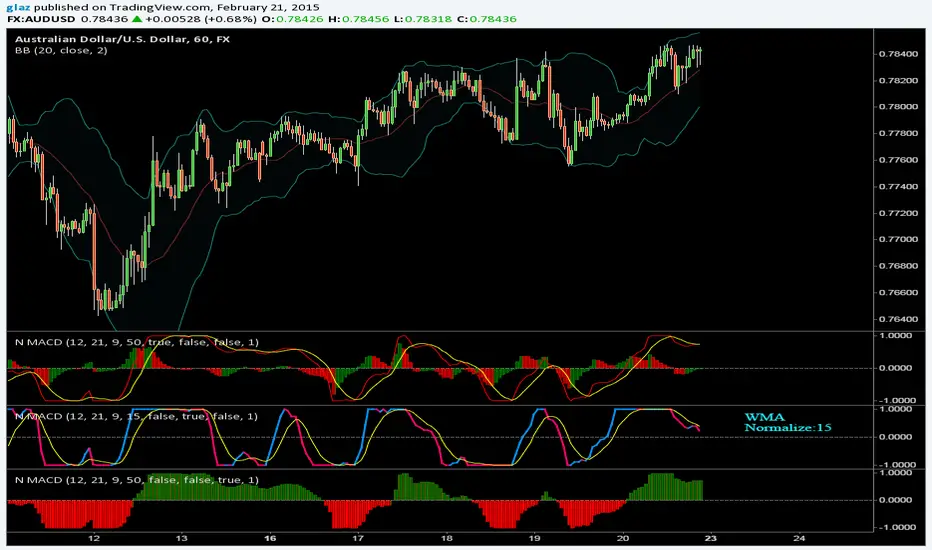
Normalized MACDNormalized MACD
There are varius options like choosing the moving average to use, sometimes i prefer the wma it is much smoother
Added also macd line to swap color and Fill that plots columns
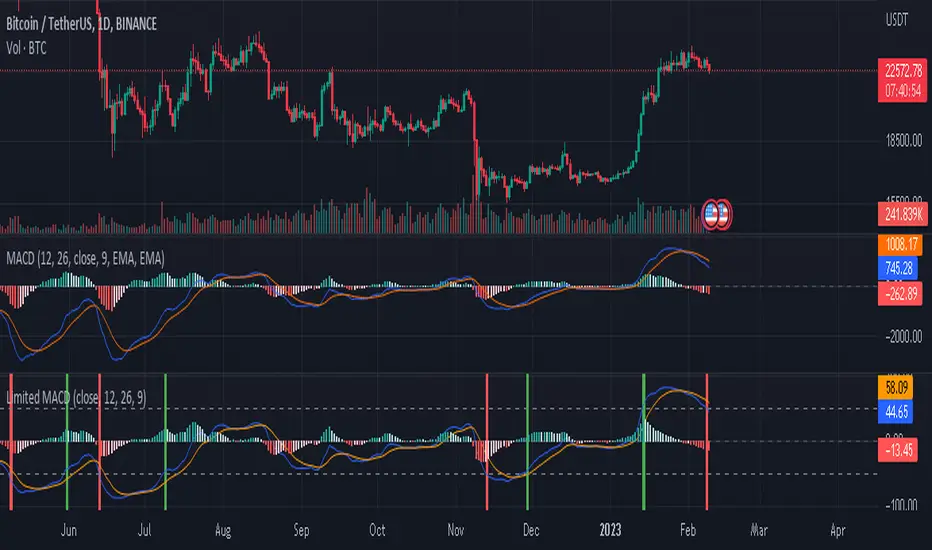
Limited MACDwhat is "Limited MACD"?
it is macd but it has some useful additional features.
what it does?
it takes limited values ??just like rsi. The highest value it can take is 100 and the lowest value is -100. this way it gets the same highs and lows for different symbols and time slots. which means we can set overbought and oversold values ??with it. he also paints candles according to their values. The closer the price is to the oversold values, the more red, and the closer to the overbought values, the greener.
how it does it?
macd values ??are limited by dividing by extreme values. The macd value is used as the variable for the color.rgb function, this is used to get a different color for each macd value.
how to use it?
The variables in the settings section are the same as standard macd.
Use the colors to identify overbought and oversold zones and to predict possible price reversal points. also the indicator will mark possible turning points. other than that, its use is similar to standard macd and its limits are up to your imagination.
four hour:
one hour:
five minute:
[SignalFI] MACD PrimeWelcome! As part of our continual process to build and enhance trusted existing indicators, we're proud to release MACD Prime to the PRIME series for those traders that rely on the popular divergence mechanics traditional MACD provides.
MACD Prime provides a default MACD structure using the popular 12,26 EMAs and a 9 lockback signal line as the core of the indicator's functionality. In this way, you will get a consistent view for what you're use to, but of course we've added additional functionality that can be used to increase the value this view provides when trading.
ADDITIONAL Functions:
1) MACD Fast and Slow EMA sources are selectable, thus allowing the user to select OHLC variants as the source input for the 12/26 trendlines.
2) Background Coloring is based on a secondary "Signal" color which be default has been set to 6. This length is configurable, and providing a leading edge to the typical "MACD Cross". Said simply, the background color will change with the trend BEFORE a default MACD cross occurs. This may provide early warning of a MACD cross, and allow for additional entry/exit signals to manifest depending on other confluence with price and trend information.
3) MACD Trend Lines. In accordance with the PRIME series MACD Prime comes bundled with Trend Line support and resistance pivots that provide additional context for how the MACD may act based on a previous and projected trend line information. By default projections are turned off, but can be enabled from within the menu options. These trendlines can be used to spot divergences as well, and can be tuned within the option to increase resolution or decrease noise provided by trend lines.
All other standard functions persist, including the typical MACD line, MACD Signal Line, and MACD Histogram.
SignalFI was created to help traders and investors to effectively analyze the market based on the Golden Mean Ratio (Fibonacci numbers), plan a trade and ultimately execute it. To help inform and educate market decisions we developed a set of Trading Indicators which are available on TradingView.
SignalFI indicators are just that, indicators. Our indicators are generally configured to use completely historical data (negating repaint), and we advise all alerts created with SignalFI indicators to be fired upon "close" of the current candle. Our indicators can provide valuable context and visualization support when performing market analysis and executing buy and sell decisions. However. we are not financial experts, and all information presented on this site or our other media outlets are for educational purposes only.

MACD Fake Filter [RH]Introducing a new indicator for the TradingView community based on the MACD indicator! This innovative tool goes beyond traditional MACD signals by analyzing positive and negative waves to determine the average height of the waves to filter false cross-over or cross-under signals during the sideways market.
There are two types of waves created by the MACD line, one is a positive wave above the "zero" line and another is a negative wave below "zero" line. Each wave has peaks. This indicator will find the average height of the positive waves' peaks and plot as a green line(by default). Vice-versa it will also find the average height of the negative waves' peaks and plot as a red line(by default).
Example :
This indicator will show labels when the MACD line crosses-under the MACD signal line above the average height of the positive waves.
Vice-versa, the indicator will show labels when the MACD line crosses-above the MACD signal line below the average height of the negative waves.
Example:
Alerts are also available for these types of cross-over and cross-under.

Ultimate MACD Super PackFor all MACD appreciators out there, I present my "Ultimate MACD Super Pack" multicator employing PSv4.0. This is one of my first combo oscillators I initially built a very long time ago with my new introduction to Pine Script. With recent improvements to Pine, I felt it was finally time to publish this. The basic list of indicators summarized is, a "quadruple MACD", a rescaled mutation of "Reverse EMA", and also what I would describe as "Moving AVERAGES Convergence/Divergence"(MAsCD) with an 's'. MAsCD doesn't use the standard MACD formula, but another mathemagical method that is inherently MACD like. All of the quadruple MACDs have short/long(fast/slow) periods that accept floating point numbers for ultimate MACD tunability. However, the signal period for MACD #1 will only accept an integer using sma (). The three faster MACDs(#2, #3, and #4) have distinct crossover/under pointers for overbought/oversold conditional states. Just so everybody knows, using 4 MACD histograms simultaneously is not what I had in mind, so there are none included in this multicator. Lastly, an enhanced version Dr . John Ehlers "Reverse EMA" is included, because it has MACD histogram like characteristics, if you haven't noticed. Instead of "Reverse EMA" using an 'alpha' decimal number as originally designed, I simply converted it to a standard period most will comprehend with ease. I also "superized" everything recently using my novel concepts I have recently discovered. All of these complimentary indicators combined, are nicely packaged into one information packed multicator. Now you may understand the title much better and why it is entitled as such. I included the maximum amount of adjustabilty I could summon within my current mind to give the user ultimate control for each indicator as an attempt to create a heavenly MACD experience. My intention is for this to become the "pinnacle" of MACD innovation.
Features List Includes:
Adjustable Transparency
Enable/disable dark background for enhanced visibility
"Source" selection with multiple time frame adjustments for indicators
All indicators shown are enable/disable capable independently
Individual enable/disable capable MACD crossover/under pointers
MACD short/long periods accept floating point numbers, yes it's true!
AND much, much more...
This is not a freely available indicator, FYI. To witness my Pine poetry in action, properly negotiated requests for unlimited access, per indicator, may ONLY be obtained by direct contact with me using TV's "Private Chats" or by "Message" hidden in my member name above. The comments section below is solely just for commenting and other remarks, ideas, compliments, etc... regarding only this indicator, not others. If you do have any questions or comments regarding this indicator, I will consider your inquiries, thoughts, and ideas presented below in the comments section, when time provides it. When my indicators achieve more prevalent use by TV members, I will implement more ideas when they present themselves as worthy additions. As always, "Like" it if you simply just like it with a proper thumbs up, and also return to my scripts list occasionally for additional postings. Have a profitable future everyone!

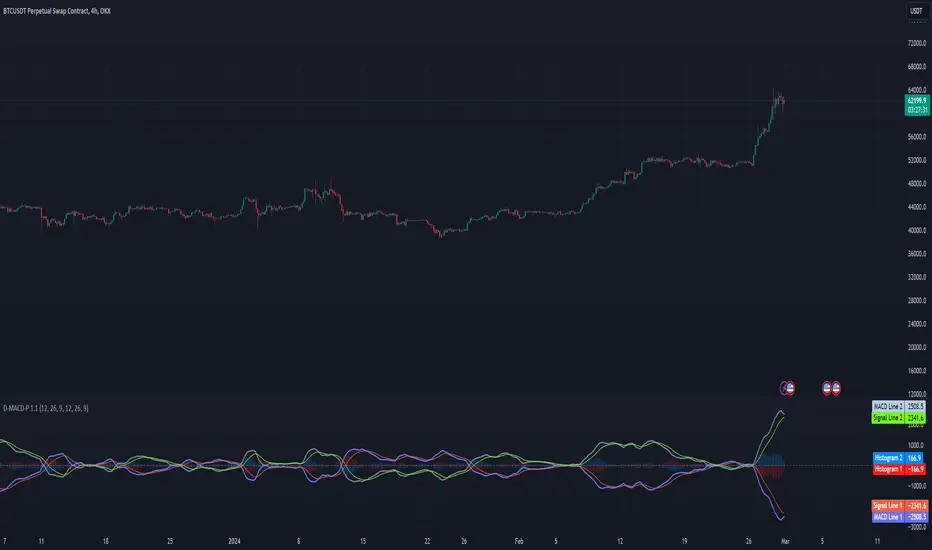
Double MACD Pattern 1.0This script is designed to assist traders in identifying potential trading signals and trends based on the MACD indicator. Users can adjust the input parameters to fine-tune the indicator to their trading preferences. When specific conditions are met, alerts are generated to notify the user of potential trading opportunities.
Indicator Description:
The script defines a custom indicator that calculates and plots two sets of Moving Average Convergence Divergence (MACD) lines along with their signal lines.
It allows users to configure various parameters for MACD calculation, such as fast and slow lengths for both MACD 1 and MACD 2, as well as signal lengths for both.
Plotting:
The script plots the MACD lines and signal lines for both MACD 1 and MACD 2 on the chart with different colors and line styles.
It also plots a middle line at zero for reference.
Alerts:
The script defines conditions for generating alerts based on MACD crossover and crossunder events for both MACD 1 and MACD 2.
Alerts are generated for the following scenarios:
A long signal is generated when MACD 1 crosses under its signal line while MACD 2 crosses over its signal line.
A short signal is generated when MACD 1 crosses over its signal line while MACD 2 crosses under its signal line.
An up trend signal is generated when MACD 2 crosses over MACD 1.
A down trend signal is generated when MACD 1 crosses over MACD 2.
Alerts are included in the script to notify users of these specific trading signals.
Please note that this script is meant for educational purposes and should be used cautiously in a real trading environment. It's important to have a thorough understanding of technical analysis and risk management when using such indicators in actual trading.
The best MACD line + MACD signal + MACD histogram DivergencesHi everyone,
Here is a script that synthesizes divergence signals from the MACD indicator, including 3 options:
- MACD divegence
- MACD signal divergence
- MACD histogram divergence
Scripts are used for learning and research purposes. THESE ARE NOT BUY/SELL SIGNALS.
If you have a better idea, share it here or contact me via msg. I will improve this script better in next version.
Settings:
Basically, you only need to care about 2 parameters:
- MACD Source: There are 3 options: macdLine, signLine and histLine.
- Lookback Level For Divs: Number of previously adjacent peak.
- Other parameters, you can research more
Feel free to use, share, comment & provide feedback.
Get indicator or strategy trading signals at yummyprofit.
Good luck!

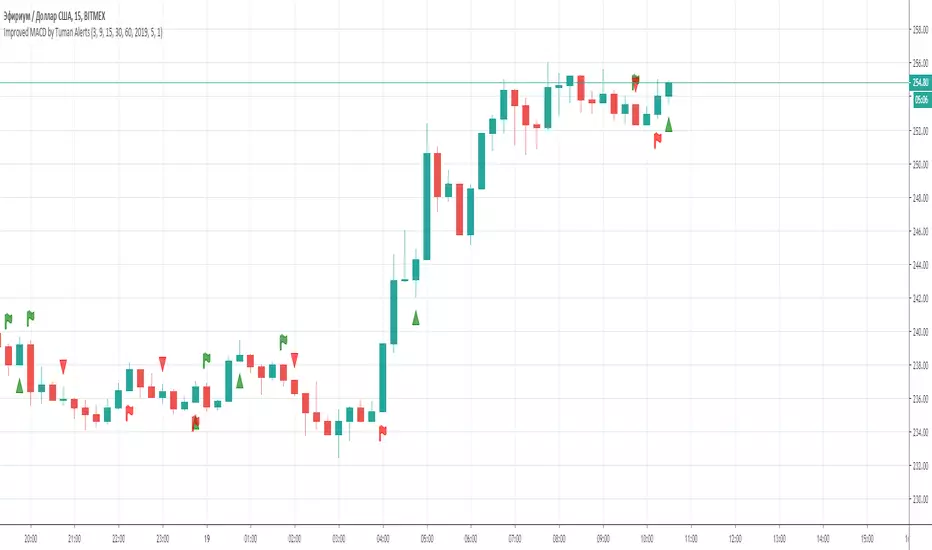
MACD Buy/Sell Labels + Barcolor👉 MACD Buy/Sell Labels + Barcolor
This advanced indicator combines the functionality of the MACD (Moving Average Convergence Divergence) with intuitive and customizable visual features, making it ideal for traders looking for an efficient tool to confirm buy and sell signals across any market.
It is based on the logical interpretation of a modified oscillator to improve its performance and simplify its usage. The indicator integrates seamlessly into the chart, offering an intuitive and easy-to-understand experience.
📍 Labels (Buy/Sell):
The signals are generated automatically by crossovers between the Fast EMA and Slow EMA of the Gaussian MACD. It comes with a default configuration designed to favor clean crossovers while avoiding false signals.
🧪 Barcolor:
The color of the candles dynamically changes according to the range of the Gaussian MACD histogram. This allows for a clear visualization of the MACD's status without needing to display the full oscillator. This feature integrates with the labels, as explained in the "Interpretation" section, to significantly increase their probability of success. Both the ranges and colors are fully customizable through the settings panel.
⚙️ Settings:
All aspects of the indicator can be customized:
1-MACD: Like a standard MACD, you can adjust the EMA lengths and the signal smoothing to adapt it to your trading style and the markets you trade.
2-Barcolor: The predefined values highlight extreme levels for proper interpretation, as explained in the "Interpretation" section. However, intermediate levels are also included in case you want to implement them in your strategy. You can adjust these values based on what you consider "overbought" or "oversold." This flexibility allows adaptation to various assets, as oscillator behavior varies across different instruments.
3-Buy/Sell Filter:
The filter settings allow you to further refine the signals. The default values of -70 (Buy Filter) and 80 (Sell Filter) work best for me, but you can adjust them as you see fit. Keep in mind:
-Higher distance from zero: More filtered signals (fewer, but higher quality).
-Closer to zero: Less filtered signals (more frequent, but with increased risk of false signals).
🤔 Interpretation:
As mentioned earlier, this follows the classic interpretation of a MACD oscillator: overbought/oversold levels combined with crossovers. However, the barcolor variable is what makes this indicator truly unique.
With barcolor, you can detect potential divergences and confirm them using the labels. When the oscillator reaches an extreme zone, barcolor provides a visual alert. Once the oscillator exits this zone, the candles revert to their normal color. This signals that the oscillator is dropping. If the price continues rising, this divergence can indicate an anomaly in the market. Waiting for confirmation from the label increases the probability of successful trades while detecting unusual market deviations without even looking at the oscillator.
Purpose:
This indicator is designed to help traders simplify the interpretation of the MACD. It can be used on any timeframe, but it was primarily tested using technical analysis concepts and basic liquidity principles. Its effectiveness improves significantly if you understand broader market dynamics.
Disclaimer:
This is purely an analytical tool and should NOT be considered as trading signals. Perform your own research and make decisions based solely on your responsibility. Thank you!

MACD crossover while RSI Oversold/OverboughtThis indicator draws signals on the chart when a Bullish MACD Crossover occurs at the same time RSI is "oversold", and also when Bearish MACD Crossover occurs at the same time RSI is "overbought"
Indicators are drawn on the chart in the following scenarios:
1. Bullish signal
a. MACD bullish crossover occurs on a single bar
b. RSI was below the Oversold threshold (29 by default) within the prior 5 bars
2. Bearish signal
a. MACD bearish crossover occurs on a singnle bar
b. RSI was above the Overbought threshold (71 by default) within the prior 5 bars
