MACD with LSME and triple EMAMACD - with each MA defined as follows:
ema(ema(ema(LSMA(src,len1),len2),len2)len2)
Search in scripts for "macd"

Exponential Moving Average Convergence/DivergenceMACD modified with exponential moving averages. Simple.

Reversal + Confirm ZonesThis script is written in Pine Script (version 5) for TradingView and creates an indicator called **"Reversal + Confirm Zones"**. It overlays visual zones on a price chart to identify potential reversal points and confirmation signals for trading. The indicator combines **Bollinger Bands** and **RSI** to detect overbought/oversold conditions (reversal zones) and uses **EMA crosses** and **MACD zero-line crosses** to confirm bullish or bearish trends. Below is a detailed explanation:
---
### **1. Purpose**
- The script highlights:
- **Reversal Zones**: Areas where the price might reverse due to being overbought (green) or oversold (red).
- **Confirmation Zones**: Areas where a trend reversal is confirmed using EMA and MACD signals (green for bullish, red for bearish).
- It provides visual backgrounds and alerts to assist traders in spotting potential trade setups.
---
### **2. Components**
The script is divided into two main parts: **Reversal Logic** and **Confirmation Logic**.
---
### **3. Reversal Logic (Red & Green Zones)**
#### **Bollinger Bands**
- **Parameters**:
- Length: 20 periods.
- Source: Closing price (`close`).
- Multiplier: 2.0 (standard deviations).
- **Calculation**:
- `basis`: 20-period Simple Moving Average (SMA).
- `dev`: 2 times the standard deviation of the price over 20 periods.
- `upper`: `basis + dev` (upper band).
- `lower`: `basis - dev` (lower band).
- **Purpose**: Identifies when the price moves outside the normal range (beyond 2 standard deviations).
#### **Relative Strength Index (RSI)**
- **Parameters**:
- Length: 14 periods.
- Low Threshold: 30 (oversold).
- High Threshold: 70 (overbought).
- **Calculation**: `rsiValue = ta.rsi(close, rsiLength)`.
- **Purpose**: Measures momentum to confirm overbought or oversold conditions.
#### **Zone Conditions**
- **Red Zone (Oversold)**:
- Condition: `close < lower` (price below lower Bollinger Band) AND `rsiValue < rsiLowThreshold` (RSI < 30).
- Visual: Light red background (`color.new(color.red, 80)`).
- Alert: "Deep Oversold Signal triggered!".
- **Green Zone (Overbought)**:
- Condition: `close > upper` (price above upper Bollinger Band) AND `rsiValue > rsiHighThreshold` (RSI > 70).
- Visual: Light green background (`color.new(color.green, 80)`).
- Alert: "Deep Overbought Signal triggered!".
#### **Interpretation**
- Red Zone: Suggests the price is oversold and may reverse upward.
- Green Zone: Suggests the price is overbought and may reverse downward.
---
### **4. Confirmation Logic (EMA and MACD Crosses)**
#### **Exponential Moving Averages (EMAs)**
- **Parameters**:
- Short EMA Length: 9 periods (user adjustable).
- Long EMA Length: 21 periods (user adjustable).
- **Calculation**:
- `emaShort = ta.ema(close, emaShortLength)`.
- `emaLong = ta.ema(close, emaLongLength)`.
- **Conditions**:
- **Bullish EMA Cross**: `emaCrossBullish = ta.crossover(emaShort, emaLong)` (9 EMA crosses above 21 EMA).
- **Bearish EMA Cross**: `emaCrossBearish = ta.crossunder(emaShort, emaLong)` (9 EMA crosses below 21 EMA).
#### **MACD**
- **Parameters**:
- Fast Length: 12 periods (user adjustable).
- Slow Length: 26 periods (user adjustable).
- Signal Smoothing: 9 periods (user adjustable).
- **Calculation**:
- ` = ta.macd(close, macdFastLength, macdSlowLength, macdSignalSmoothing)`.
- Only the MACD line and signal line are used; the histogram is ignored (`_`).
- **Conditions**:
- **Bullish MACD Cross**: `macdCrossBullish = ta.crossover(macdLine, 0)` (MACD crosses above zero).
- **Bearish MACD Cross**: `macdCrossBearish = ta.crossunder(macdLine, 0)` (MACD crosses below zero).
#### **Combined Confirmation Conditions**
- **Bullish Confirmation**:
- Condition: `bullishConfirmation = emaCrossBullish and macdCrossBullish`.
- Visual: Very light green background (`color.new(color.green, 90)`).
- Meaning: A bullish trend is confirmed when the 9 EMA crosses above the 21 EMA AND the MACD crosses above zero.
- **Bearish Confirmation**:
- Condition: `bearishConfirmation = emaCrossBearish and macdCrossBearish`.
- Visual: Very light red background (`color.new(color.red, 90)`).
- Meaning: A bearish trend is confirmed when the 9 EMA crosses below the 21 EMA AND the MACD crosses below zero.
---
### **5. Visual Outputs**
- **Reversal Zones**:
- Red background for oversold conditions.
- Green background for overbought conditions.
- **Confirmation Zones**:
- Light green background for bullish confirmation.
- Light red background for bearish confirmation.
- Note: The script does not plot the Bollinger Bands, EMAs, or MACD lines—only the background zones are visualized.
---
### **6. Alerts**
- **Deep Oversold Alert**: Triggers when the red zone condition is met.
- **Deep Overbought Alert**: Triggers when the green zone condition is met.
- No alerts are set for the confirmation zones (EMA/MACD crosses).
---
### **7. How It Works**
1. **Reversal Detection**:
- The script uses Bollinger Bands and RSI to flag extreme price levels (red for oversold, green for overbought).
- These zones suggest potential reversals but are not confirmed yet.
2. **Trend Confirmation**:
- EMA crosses (9/21) and MACD zero-line crosses provide confirmation of a trend direction.
- Bullish confirmation (green) occurs when both indicators align upward.
- Bearish confirmation (red) occurs when both indicators align downward.
3. **Trading Strategy**:
- Look for a red zone (oversold) followed by a bullish confirmation for a potential long entry.
- Look for a green zone (overbought) followed by a bearish confirmation for a potential short entry.
---
### **8. How to Use**
1. Add the script to TradingView.
2. Adjust inputs (EMA lengths, MACD settings) if desired.
3. Monitor the chart:
- Red zones indicate oversold conditions—watch for a potential upward reversal.
- Green zones indicate overbought conditions—watch for a potential downward reversal.
- Light green/red backgrounds confirm the trend direction after a reversal zone.
4. Set up alerts for oversold/overbought conditions to catch reversal signals early.
---
### **9. Key Features**
- **Dual Purpose**: Combines reversal detection (Bollinger Bands + RSI) with trend confirmation (EMA + MACD).
- **Visual Simplicity**: Uses background colors instead of plotting lines, keeping the chart clean.
- **Customizable**: Allows users to tweak EMA and MACD periods.
- **Alerts**: Notifies users of extreme conditions for timely action.
---
### **10. Limitations**
- No plotted indicators (e.g., Bollinger Bands, EMAs, MACD) for visual reference—relies entirely on background shading.
- Confirmation signals (EMA/MACD) may lag behind reversal zones, potentially missing fast reversals.
- No alerts for confirmation zones, limiting real-time notification of trend confirmation.
This script is ideal for traders who want a straightforward way to spot potential reversals and confirm them with trend-following indicators, all overlaid on the price chart.

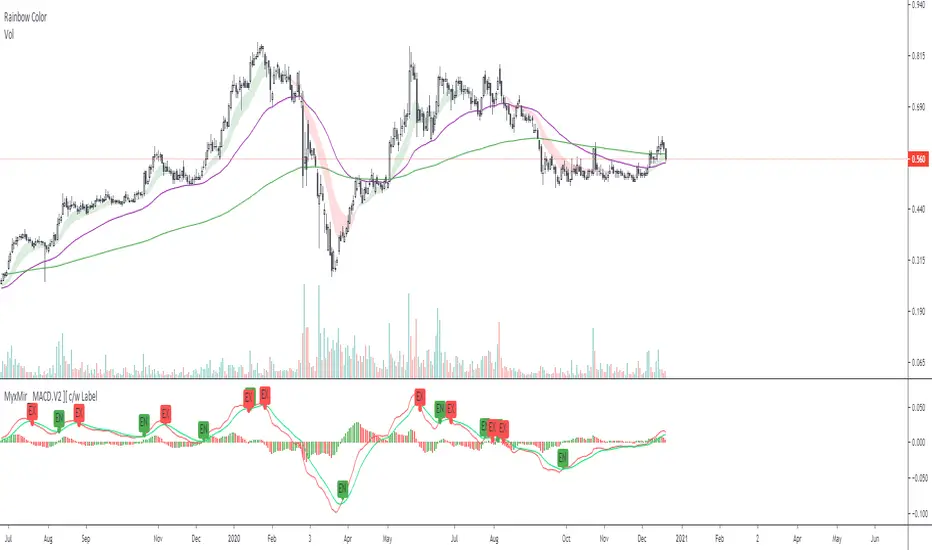
Myx.Mir_ MACD.V2 ][ c/w Hist.Color & LabelMoving average convergence divergence ( MACD ) is commonly and widely used for Technical Analysis .
// Basis- based on default setting
macdLine, signalLine, histLine = default setting
with additional "cosmetic/ Makeup"
1) for 4R1G set up Trader. Histogram color as follows:-
a) if Hist => 0 = Hist > Hist ? color.green : na, Hist < Hist ? color.red : na
b) if Hist <= 0 = Hist < Hist ? color.green : na, Hist > Hist ? color.red : na
2) crossover MACD Line, SignalLine- with label "EN" / "EX"
Do not follow the signal blindly. Trader's should be able to identify the trend whether there is uptrend, sideways and downtrend.
Entry and/or Exit are based on Trader's risk appetite.
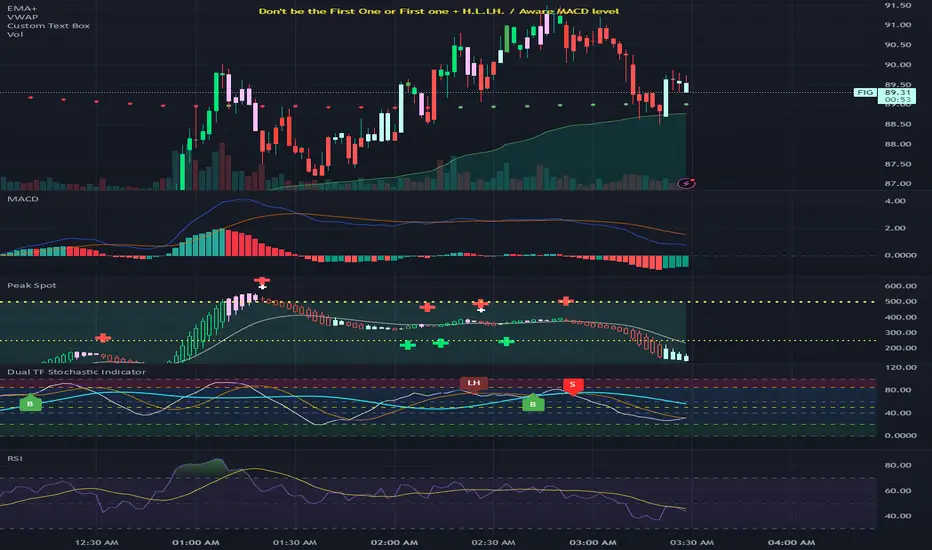
Spot the Peak & BottomCombines Heikin-Ashi candlesticks with MACD histogram analysis to identify potential market reversals and trend continuations. The script provides advanced pattern recognition with visual signals and alerts.
Core Components
1. Technical Foundation
Heikin-Ashi Candlesticks: Modified candlestick calculation that smooths price action
MACD Histogram: Custom STMC (Smooth Trend Momentum Change) oscillator
Multiple Price Sources: Support for open, high, low, close, and various averages (hl2, hlc3, ohlc4, hlcc4)
2. Pattern Detection System
Bullish Patterns:
HA D ↑ → HA ↑: Divergence resolution (Heikin-Ashi bearish but histogram strengthening, then turning bullish)
Normal Rise: HA rising + histogram strengthening/maintaining
Bottom Reversal: HA falling but histogram strengthening
Bearish Patterns:
HA U ↓ → HA ↓: Divergence resolution (Heikin-Ashi bullish but histogram weakening, then turning bearish)
Top Reversal: HA rising but histogram weakening
Strong Downtrend: HA falling + histogram weakening
Divergence Patterns:
HA D ↓: Heikin-Ashi bullish but momentum weakening
HA D ↑: Heikin-Ashi bearish but momentum strengthening
3. Signal Classification System
Bullish Signals (▲):
Bull Highlight: Higher HA close than previous signal (strongest)
Bull Normal: Normal signal within neutral range (-100 to 100)
Bull Gray: Normal signal outside neutral range
Bearish Signals (▼):
Bear Highlight: Lower HA close than previous signal (strongest)
Bear Normal: Normal signal within neutral range (-100 to 100)
Bear Gray: Normal signal outside neutral range
Transition Signals:
HA DD: Hollow green to hollow red transition
HA UU: Hollow red to hollow green transition
4. Visual Features
Color Coding:
Green/Lime: Bullish patterns and signals
Red/Orange: Bearish patterns and signals
Pink/Cyan: Divergence conditions
White: Neutral signals
Background Zones:
Upper Zone (50-500): Overbought/extreme high areas
Lower Zone (-50 to -500): Oversold/extreme low areas
Reference Lines: Do Not Short (-500), Do Not Long (500), Semi-lines (±250)
Display Modes:
Hybrid: Shows both MACD and Heikin-Ashi
MACD: MACD line and signal only
Histogram: Histogram only
5. Alert System
The script provides comprehensive alerts for:
Bull/Bear signal types (Highlight, Normal, Neutral Area)
HA DD/UU transitions
Divergence start/end conditions
6. Customization Options
MACD Settings: Fast/slow lengths, signal parameters
UI Options: Colors, display modes, background fills
Pattern Detection: Enable/disable various pattern types
Divergence Styling: Custom colors for divergence conditions
This indicator is particularly useful for traders who want to combine the smoothing benefits of Heikin-Ashi with the momentum insights of MACD for more accurate entry and exit timing.
MACDHuggingAndSeparatingThe code is meant for catching the movement of the stocks just after the MACD hugs each other n then when they start separating. As we all know this set up can be used to catch big moves.


MACD_RDMACD_RD - Moving Average Convergence Divergence (Ryan DeBraal)
This indicator plots a standard MACD along with a color-adaptive histogram and
integrated momentum-shift alerts. It preserves the normal MACD structure while
improving visual clarity and signal recognition.
FEATURES
-----------------------------------------------------------------------------
• Standard MACD Calculation
- Fast MA (12 by default)
- Slow MA (26)
- Signal line (9)
- Choice between SMA/EMA for both MACD and Signal smoothing
• Color-Changing Histogram
- Green shades for positive momentum
- Red shades for negative momentum
- Lighter/darker tones depending on whether momentum is increasing or fading
- 50% opacity for improved readability
• Crossover-Based MACD Line Coloring
- MACD line turns green on bullish cross (MACD > Signal)
- MACD line turns red on bearish cross (MACD < Signal)
- Default blue when no crossover occurs
• Momentum-Shift Alerts
- Alerts when histogram flips direction
PURPOSE
-----------------------------------------------------------------------------
This MACD version emphasizes momentum shifts and trend transitions by
highlighting subtle histogram changes and providing clean crossover visuals.
Ideal for:
• Identifying early momentum reversals
• Filtering breakout/trend setups
• Confirming trend continuation vs exhaustion

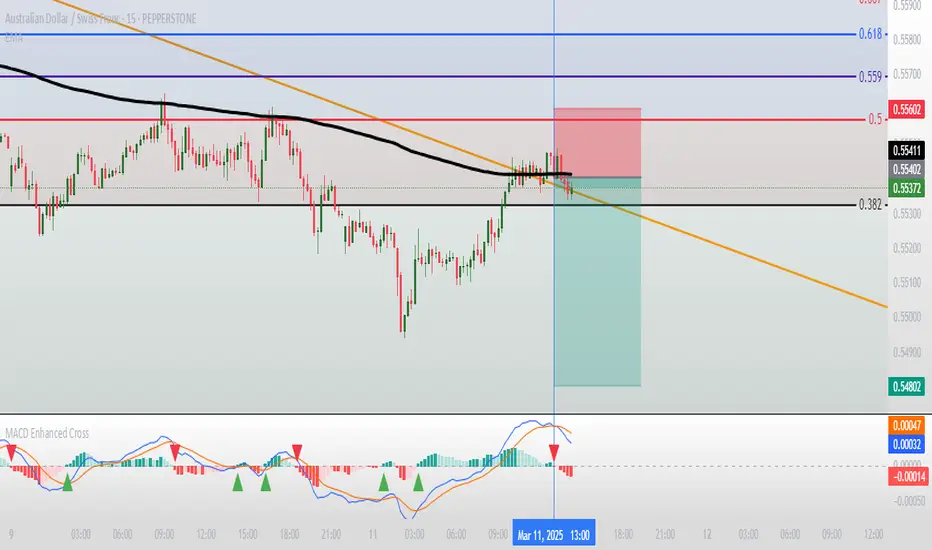
Moving Average Convergence Divergence with Enhanced Cross Alerts
Overview of Features and Settings
- Customizable Parameters:
- Fast and Slow Periods: Users can set the duration for both the fast (default 12) and slow (default 26) moving averages.
- Source Selection: The indicator uses the closing price (close) by default, though this can be modified to any other data source.
- Signal Smoothing: The smoothing period for the signal line is adjustable (default 9), and you can choose whether to use SMA or EMA for both the oscillator and the signal line calculations.
Calculation Logic
1. Calculation of Moving Averages:
- The fast and slow moving averages are computed based on the chosen moving average type (SMA or EMA) over the specified periods.
- The MACD line is then determined as the difference between these two moving averages.
2. Signal Line and Histogram:
- Signal Line: Created by smoothing the MACD line, with the option to choose between SMA and EMA.
- Histogram: Represents the difference between the MACD line and the signal line, visually indicating the divergence between the two.
Detection of Cross Events
The script identifies two specific cross events with additional filtering conditions:
- Bullish Cross:
- The MACD line **crosses above** the signal line.
- The previous value of the histogram is negative, and both the MACD and the signal line are below zero.
- This condition suggests that a cross occurring in the negative territory might indicate a potential upward trend reversal.
- **Bearish Cross:**
- The MACD line **crosses below** the signal line.
- The previous value of the histogram is positive, and both the MACD and the signal line are above zero.
- This condition indicates that a cross in the positive territory may signal a potential downward trend reversal.
For each event, there are dedicated alert conditions defined that trigger notifications when the criteria are met.
Visualization
- Displayed Elements:
- Histogram: Rendered as a column chart with colors that change based on the rate of change. For instance, a rising positive histogram uses a stronger green, whereas a declining positive histogram uses a lighter shade.
- MACD and Signal Lines: Displayed as separate lines with distinct colors to differentiate them.
- Zero Line: A horizontal line is drawn to help visually pinpoint the zero level.
- Crossing Signals:
- Optional markers in the form of arrows appear on the chart:
- **Bullish Cross: A green, upward-pointing triangle at the bottom.
- **Bearish Cross: A red, downward-pointing triangle at the top.
Summary
This indicator not only incorporates the traditional MACD components but also offers the following additional benefits:
- **Enhanced Accuracy:** Extra conditions (such as checking the previous histogram value and the position of the lines relative to zero) improve the identification of significant cross events.
- **Customization:** Users can personalize the moving average types and periods, making the indicator adaptable to different trading strategies.
- **Visual Assistance:** The combination of histogram columns, lines, and markers helps quickly pinpoint potential trend reversals, thereby aiding trading decisions.
This comprehensive description is intended to clearly demonstrate to users how the indicator works, outlining its calculations, filtering conditions, and its role in identifying cross events within technical analysis.
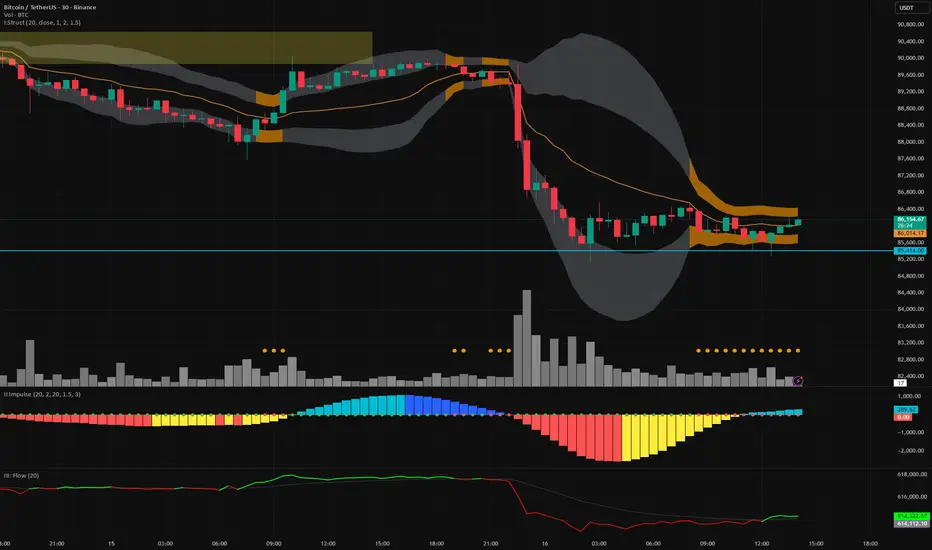
Vector Trinity indicator II: [Bottom: TTM Squeeze]**1. Introduction: The Engine of the System**
This indicator is **Part 2** of the "Vector Trinity" trading system. While Part I (Structure) defines *where* the price is, **Part II (Impulse)** defines *when* the move will happen and *how strong* it is.
It represents the **Time Dimension** of the system, focusing on momentum ignition and energy release.
* **I: Structure:** Spatial boundaries.
* **II: Impulse:** **Momentum velocity & Squeeze timing (Current Indicator).**
* **III: Flow:** Capital validation.
**2. Core Logic: Linear Regression Momentum**
Unlike standard momentum indicators (like MACD) which are based on Moving Averages and often lag significantly, **Vector Trinity II** utilizes **Linear Regression** on price deviations.
* **Math:** It calculates the distance between the price and the mean, then runs a linear regression to determine the angle of attack.
* **Benefit:** This provides a near-instantaneous reading of market "Velocity" and "Acceleration," reducing lag and allowing traders to see the turn before price fully commits.
**3. The "Squeeze" Mechanics (The Dots)**
The central line features dots that indicate the volatility state of the market:
* **🔴 Red Dot (Squeeze ON):** The Bollinger Bands have moved inside the Keltner Channels. Volatility is critically low. The market is storing energy like a compressed spring. **Action:** Wait. Do not trade yet.
* **🟢 Green Dot (Squeeze Fired):** The Bands have popped out of the Channels. The energy is releasing. **Action:** This is the "Ignition" signal. Look at the histogram color for direction.
**4. The 4-Color Momentum System**
The histogram bars are color-coded to tell the full story of the trend's lifecycle, not just direction:
* **Bullish Territory (Above 0):**
* **🟦 Cyan (Light Blue):** **Bullish Acceleration.** Buyers are aggressive. Momentum is increasing. (Best for entry).
* **🔷 Blue (Dark Blue):** **Bullish Deceleration.** Buyers are tired. Momentum is fading. (Prepare to take profit).
* **Bearish Territory (Below 0):**
* **🟥 Red:** **Bearish Acceleration.** Sellers are aggressive. Momentum is increasing. (Best for shorting).
* **🟨 Yellow:** **Bearish Deceleration.** Sellers are exhausted. Momentum is recovering towards zero. (Warning: Trend potential reversal).
**5. How to Use**
* **Step 1:** Look for **Red Dots** on the zero line. This identifies a high-potential setup building up.
* **Step 2:** Wait for the **First Green Dot**. This is the "Squeeze Fired" signal.
* **Step 3:** Confirm with the **Histogram Color**.
* If Green Dot + **Cyan Bar** = Long Signal.
* If Green Dot + **Red Bar** = Short Signal.
* **Advanced:** Use the **Yellow Bars** as an early warning to exit short positions before price actually reverses.
**Settings:**
* **Length:** 20 (Standard calculation period).
* **BB/KC Mult:** 2.0 / 1.5 (Standard ratios to define the Squeeze).
* **Smoothing:** Enabled (Default 3) to reduce noise and provide clearer color transitions.
---
### **中文说明**
**1. 简介:系统的核心引擎**
本指标是“矢量三位一体”交易系统的 **第二部分**。如果说第一部分 (Structure) 定义了价格*在哪里*,那么 **第二部分 (Impulse)** 则定义了行情*何时*启动以及力度*有多强*。
它代表了系统的 **时间维度**,专注于动能的点火与能量释放。
* **I: Structure 结构:** 空间边界。
* **II: Impulse 脉冲:** **动能速度与挤压时机(本指标)。**
* **III: Flow 流向:** 资金验证。
**2. 核心逻辑:线性回归动能**
传统的动能指标(如 MACD)通常基于移动平均线,存在显著的滞后性。**Vector Trinity II** 采用了基于价格偏离度的 **Linear Regression (线性回归)** 算法。
* **数学原理:** 它计算价格与均值的距离,并通过回归分析确定攻击的角度。
* **优势:** 这提供了几乎零滞后的市场“速度”与“加速度”读数,允许交易者在价格完全反转之前看到动能的拐点。
**3. “挤压”机制 (圆点信号)**
0轴上的圆点指示了市场的波动率状态:
* **🔴 红点 (Squeeze ON):** 布林带完全进入了肯特纳通道内部。波动率极低。市场像被压缩的弹簧一样在积蓄能量。**操作:** 等待,不要急于进场。
* **🟢 绿点 (Squeeze Fired):** 布林带扩张冲出通道。能量开始释放。**操作:** 这是“点火”信号。观察柱状图颜色以确定方向。
**4. 四色动能战术系统**
柱状图通过四种颜色讲述了趋势完整的生命周期,而不仅仅是涨跌:
* **多头区域 (0轴上方):**
* **🟦 青色 (Cyan):** **多头加速。** 买盘积极,动能增强。(最佳进场期)
* **🔷 蓝色 (Blue):** **多头减速。** 买盘疲惫,动能衰减。(准备止盈)
* **空头区域 (0轴下方):**
* **🟥 红色 (Red):** **空头加速。** 卖盘积极,动能增强。(最佳做空期)
* **🟨 黄色 (Yellow):** **空头减速。** 卖盘力竭,动能向0轴修复。(警告:趋势可能反转/抄底信号)
**5. 使用方法**
* **第一步:** 寻找0轴上的 **红点**。这标志着一个高爆发潜力的机会正在酝酿。
* **第二步:** 等待 **第一个绿点** 出现。这是“挤压释放/点火”的信号。
* **第三步:** 结合 **柱状图颜色** 确认。
* 绿点 + **青色柱** = 做多信号。
* 绿点 + **红色柱** = 做空信号。
* **进阶用法:** 利用 **黄色柱** 作为空单止盈的先行指标,往往在价格反弹之前,动能就已经变黄了。
**参数设置:**
* **Length (周期):** 20 (标准计算周期)。
* **BB/KC Mult (倍数):** 2.0 / 1.5 (定义挤压状态的标准比率)。
* **Smoothing (平滑):** 开启 (默认3) 以减少噪音,提供更平滑的颜色转换体验。
Schaff Trend Cycle (STC)The STC (Schaff Trend Cycle) indicator is a momentum oscillator that combines elements of MACD and stochastic indicators to identify market cycles and potential trend reversals.
Key features of the STC indicator:
Oscillates between 0 and 100, similar to a stochastic oscillator
Values above 75 generally indicate overbought conditions
Values below 25 generally indicate oversold conditions
Signal line crossovers (above 75 or below 25) can suggest potential entry/exit points
Faster and more responsive than traditional MACD
Designed to filter out market noise and identify cyclical trends
Traders typically use the STC indicator to:
Identify potential trend reversals
Confirm existing trends
Generate buy/sell signals when combined with other technical indicators
Filter out false signals in choppy market conditions
This STC implementation includes multiple smoothing options that act as filters:
None: Raw STC values without additional smoothing, which provides the most responsive but potentially noisier signals.
EMA Smoothing: Applies a 3-period Exponential Moving Average to reduce noise while maintaining reasonable responsiveness (default).
Sigmoid Smoothing: Transforms the STC values using a sigmoid (S-curve) function, creating more gradual transitions between signals and potentially reducing whipsaw trades.
Digital (Schmitt Trigger) Smoothing: Creates a binary output (0 or 100) with built-in hysteresis to prevent rapid switching.
The STC indicator uses dynamic color coding to visually represent momentum:
Green: When the STC value is above its 5-period EMA, indicating positive momentum
Red: When the STC value is below its 5-period EMA, indicating negative momentum
The neutral zone (25-75) is highlighted with a light gray fill to clearly distinguish between normal and extreme readings.
Alerts:
Bullish Signal Alert:
The STC has been falling
It bottoms below the 25 level
It begins to rise again
This pattern helps confirm potential uptrend starts with higher reliability.
Bearish Signal Alert:
The STC has been rising
It peaks above the 75 level
It begins to decline
This pattern helps identify potential downtrend starts.

TTMW : VWMACD V1.1Authored by Kuntanut - To The Milky Way
VWMACD Indicator :
VWMACD indicator is developed from the MACD Indicator. This indicator multiplies the Volume to the calculation of MACD, provides the faster movement, and volume of the market relation to the indicator. This indicator has benefit to support the technical analysis in many ways such as momentum divergence detection, and entry signal when the clot change.

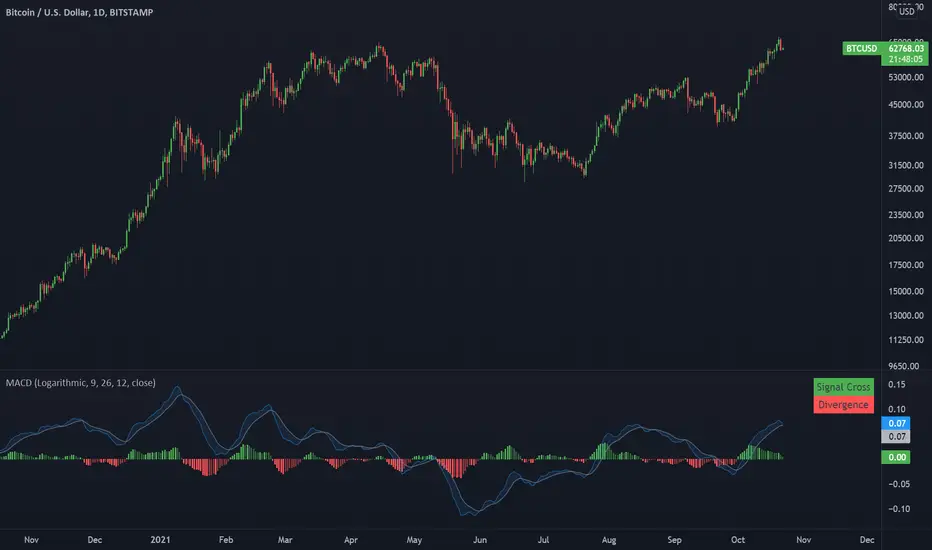
Moving Average Convergence DivergenceA MACD with option for logarithmic or regular scale.
This indicator presents bullish or bearish 'flags' based on the most recent signal cross and asset price divergence. If the price moves up and the macd continues trending down, a bearish divergence is flagged. if the price moves down and the macd continues moving up, a bullish divergence is flagged.
Yorks Mac 2This indicator fires trade entry based upon overall trend (Price above/below EMA), MACD Cross, and the MACD value being greater than or less than zero.
When all conditions are true, the signal fires.
Please PM me for access

VMACD IndicatorVolume-Weighted MACD Indicator. You can turn volume-weighted off to get "regular" MACD, and you can change the scaling of the histogram to make it stand out more.

NAKED NINJA DOUBLE MACD SUPER STOC HELL 3just eye ball it on charts and you will see how it all works dedicatated to an OG

Project 1 - Complete with CMF and All IndicatorsProject 1 – Multi-Indicator Suite
This script combines several widely-used technical indicators into a single visual framework.
It is designed to help traders track momentum, trend strength, volume behavior, and money flow without switching between multiple tools.
Included components:
• MACD with dynamic color changes
• RSI with percentage change and directional marker
• ADX with trend-strength shading and Δ% calculation
• CMF (Chaikin Money Flow) with positive/negative flow tracking
• Volume Oscillator for short–long volume pressure
• Auto-updated labels for RSI, ADX, and CMF
• Lightweight visual lines to show momentum changes
Use cases:
• Trend confirmation
• Momentum diagnostics
• Volume-based pressure analysis
• Money-flow direction and strength
• Multi-factor confluence without indicator stacking
This tool does not generate buy/sell signals and does not imply trading outcomes.
It is a visual analytics suite built for discretionary technical analysis.

MACD The MACD indicator can identify bullish crossovers above zero and bearish crossovers below zero.

Backtest optimized Smoothed Log-Space MACD [elindicador.ai]This indicator is backtest-optimized for the Daily Timeframe. Usage is straight forward as showed in the chart. Once the histogram flips to blue it signals a good change of an uptrend. If it flips to orange this suggests a likely downtrend. If you use this Indicator on the $TOTAL chart it will also show reliable buy/sell signals with a little dot.

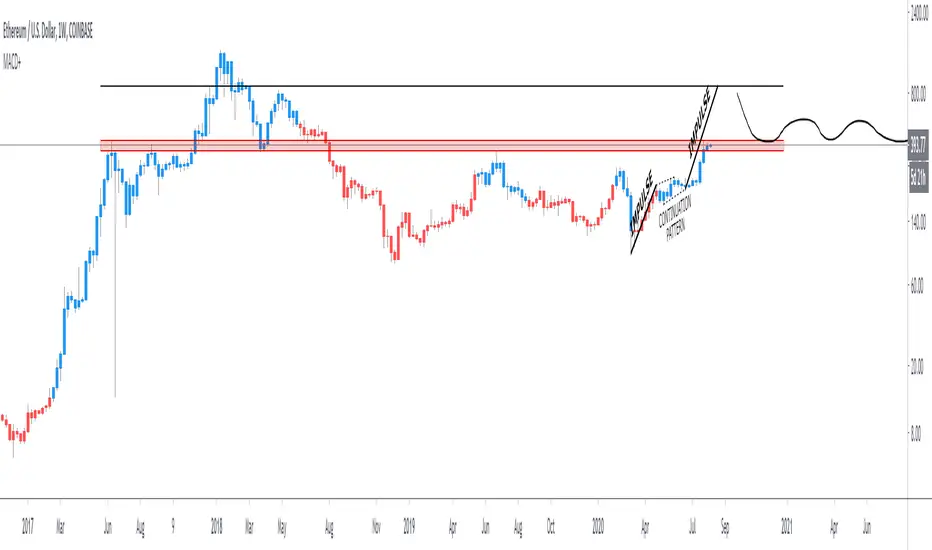
MACD+Features:
Allows for each MA to use EMA, WMA or SMA independently.
Adds a configurable fill between the MACD line and Signal lines.

Volume Weighted MACD with Named PlotsLiterally just copied VWMACD but named the plot lines to make setting alerts more clear.


MACD+The most common question I receive is what my candle color is based on. It's based on the MACD ema's 12 and 26. It reflects momentum.
I've decided to release it for free access so you no longer have to ask, you can simply use it and see what I see. I've also built in the ability to see different timeframes.
This is not an indicator meant for buys or sells. This is an integral part of my system for wave subdivision and momentum.