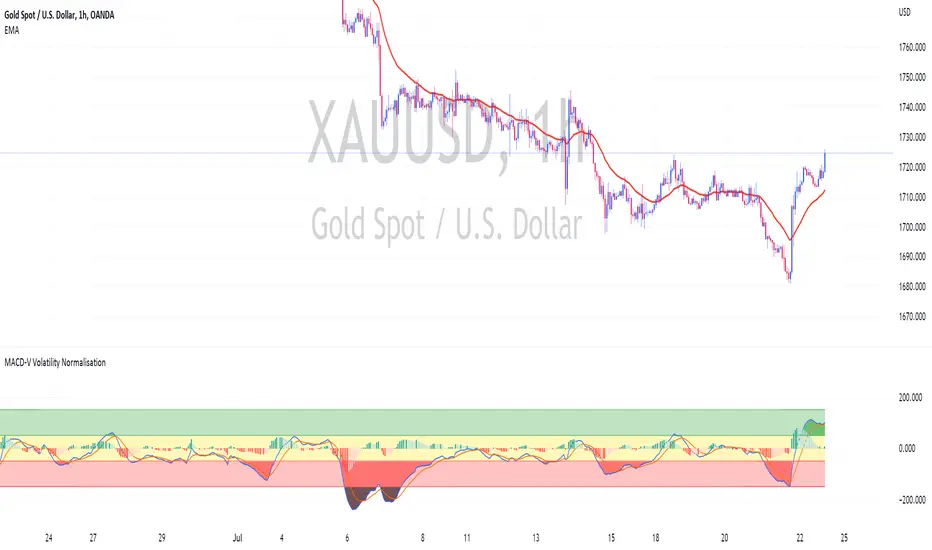
MACD-V Volatility NormalisationUsing MACD-V by Alex Spiroglou (CMT) Method
Calculation MACD-V = * 100
While
⚠️MACD-V >150 - Risk
📈MACD-V between 50 - 150 : Rallying or Retracing📈
〰️MACD-V between -50 - 50 : Ranging (Sideway) 〰️
↪️MACD-V between -150 - -50 : Rebounding or Reversing ↪️
⚠️MACD-V <150 - Risk ⚠️
Search in scripts for "macd"
(MACD-Price) Displaying MACD Indicators on Price Chartshello?
Although it is a simple indicator, I decided to disclose it because I thought it was a pretty useful (?) indicator.
** Others may have previously published indicators similar to this indicator.
** Please understand this.
** All charts or indicators disclosed are not guaranteed to result in profit or loss.
** Therefore, please use it as a reference for your own trading strategy.
(design purpose)
The MACD indicator is a secondary indicator and is located below the price chart.
Accordingly, it is not easy to check along with the price flow.
Therefore, the index has been reorganized to display important factors in interpreting the MACD index according to the price change.
(Metric Description)
- The center line of the EMA line corresponding to the MACD value and the signal value displayed in the MACD indicator is designed to receive the Close value or Open value among prices according to changes in the rise and fall.
- The color of the line displayed in the manner described above is designed to change color when the Histogram passes the zero point, so that you can check whether the current state is in an uptrend or a downtrend.
Uptrend: green
Downtrend: blue
(How to Interpret and Apply)
- Buy when the 'Buy / Sell line' of the MACD-P indicator is level and the color is green, and when it crosses the 'Buy / Sell line' upwards.
- Sell when the 'Buy / Sell line' of the MACD-P indicator is level and the color is blue, and when it crosses below the 'Buy / Sell line'.
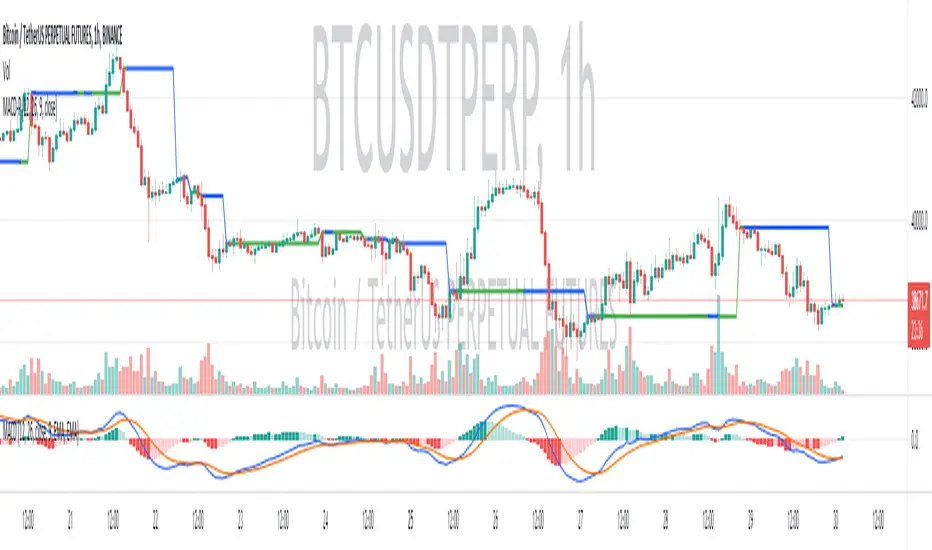
MACD Performance - TradingEDThis case study is based on a previous MACD study, but with three different counts to compare different trends. The use of this indicator is restricted to private use, and it can be used only by invitation. Different functionalities have been added to the original code, such as alerts and signals that seek to make trading much easier to interpret by any type of trading operator of any experience level , from beginner to intermediate and advanced .
Key components of the original indicator:
● The Moving Average Convergence Divergence ( MACD ) is calculated by subtracting a long period (26) Exponential Moving Average ( EMA ) from a short (12) period EMA .
● MACD triggers technical signals when it crosses above (to buy) or below (to sell) its signal line.
● The speed of crossovers is also taken as a signal of a market is overbought or oversold.
● MACD helps traders to understand whether the bullish or bearish movement in the price is strengthening or weakening.
It is a momentum indicator that follows the trend and shows the relationship between two moving averages of the price of a security. It can function as a trigger for buy and sell signals, when you cross above (to buy) or below (to sell) your signal line. It helps to understand if the movement is bullish or bearish , if it is getting stronger or weaker. The further the MACD is above or below its baseline, it indicates that the distance between the two EMAs will be growing, often shown with a histogram that graphically represents the distance between the MACD and its signal line, and It is used to identify when the bullish or bearish momentum.
Main functions of this modified indicator:
1) You can select the type of MOVING AVERAGE, among many available options ( SMA , EMA , DEMA , HMA , etc.)
2) The SOURCES for the counts can be determined by the trader (close, open, etc).
3) The MEASURE can be based on a CANDLES count if you are trading OHLC Charts from 1D onwards, or if your trading is intraday, you can also select counts by MINUTES, HOURS or DAYS, depending on your trading style.
4) LENGTH, by default it will be loaded as in the STRATEGY, but considering the previous point, you can modify it according to your convenience.
5) You have the option to hide or show the HISTOGRAM or even the MACD if you want to see one of them.
6) You have the option to hide or show a LABEL at the top of the chart, with respect to the signals: BULLISH green, BEARISH red.
Main performance functions of this modified indicator:
I) In the case of the PERFORMANCE that appears at the right of the chart, you have the option to adjust the WIDTH of each box.
II) The TEXT of the PERFORMANCE is not modifiable, but you can customize the default color. *
III) The BACKGROUND of the PERFORMANCE, you can customize the default color. *
IV) You have the option to hide or show a PERFORMANCE that appears at the right of the chart.
Main functions to customize the style of this indicator:
a) You can select the colors for the FAST LENGTH, SLOW LENGTH AND HISTOGRAM with the colors that best suit you. * **
b) For any type of SIGNAL, it is painted as a VERTICAL LINE in the graph, you can change the color that comes by default. *
c) In the case of the LABELS that appear at the top, the text is not modifiable, but you can customize both the type of label and change the default color. *
d) You can select the colors for the BACKGROUND of the indicator according to the trend, whether it is BEARISH or BULLISH, with the colors that best suit you. *
e) You can select the color for the ZERO LEVEL, with the colors that best suit you.
* By default, they are marked as red for downtrends and green for uptrends.
** By default, they are marked as orange for downtrends and blue for uptrends.

MACD Triple - Moving Average Convergence Divergence - TradingEDThis case study is based on a previous MACD study, but with three different counts to compare different trends. The use of this indicator is restricted to private use, and it can be used only by invitation. Different functionalities have been added to the original code, such as alerts and signals that seek to make trading much easier to interpret by any type of trading operator of any experience level, from beginner to intermediate and advanced.
Key components of the original indicator:
● The Moving Average Convergence Divergence (MACD) is calculated by subtracting a long period (26) Exponential Moving Average (EMA) from a short (12) period EMA.
● MACD triggers technical signals when it crosses above (to buy) or below (to sell) its signal line.
● The speed of crossovers is also taken as a signal of a market is overbought or oversold.
● MACD helps traders to understand whether the bullish or bearish movement in the price is strengthening or weakening.
It is a momentum indicator that follows the trend and shows the relationship between two moving averages of the price of a security. It can function as a trigger for buy and sell signals, when you cross above (to buy) or below (to sell) your signal line. It helps to understand if the movement is bullish or bearish, if it is getting stronger or weaker. The further the MACD is above or below its baseline, it indicates that the distance between the two EMAs will be growing, often shown with a histogram that graphically represents the distance between the MACD and its signal line, and It is used to identify when the bullish or bearish momentum.
Main functions of this modified indicator:
1) You can select the type of MOVING AVERAGE , among many available options (SMA, EMA, DEMA, HMA, etc.)
2) The SOURCES for the counts can be determined by the trader (close, open, etc).
3) The MEASURE can be based on a CANDLES count if you are trading OHLC Charts from 1D onwards , or if your trading is intraday, you can also select counts by MINUTES , HOURS or DAYS , depending on your trading style.
4) LENGTH , by default it will be loaded as in the STRATEGY , but considering the previous point, you can modify it according to your convenience.
5) You have the option to hide or show the HISTOGRAM or even the MACD if you want to see one of them.
6) You have the option to hide or show a LABEL at the top of the chart, with respect to the signals: BULLISH green, BEARISH red.
Main performance functions of this modified indicator:
I) In the case of the PERFORMANCE that appears at the right of the chart, you have the option to adjust the WIDTH of each box.
II) The TEXT of the PERFORMANCE is not modifiable, but you can customize the default color. *
III) The BACKGROUND of the PERFORMANCE , you can customize the default color. *
IV) You have the option to hide or show a PERFORMANCE that appears at the right of the chart.
Main functions to customize the style of this indicator:
a) You can select the colors for the FAST LENGTH , SLOW LENGTH AND HISTOGRAM with the colors that best suit you. * **
b) For any type of SIGNAL , it is painted as a VERTICAL LINE in the graph, you can change the color that comes by default. *
c) In the case of the LABELS that appear at the top, the text is not modifiable, but you can customize both the type of label and change the default color. *
d) You can select the colors for the BACKGROUND of the indicator according to the trend, whether it is BEARISH or BULLISH , with the colors that best suit you. *
e) You can select the color for the ZERO LEVEL , with the colors that best suit you.
* By default, they are marked as red for downtrends and green for uptrends.
** By default, they are marked as orange for downtrends and blue for uptrends.

MACD Cross AlertWhen MACD crosses Sinal line, arrows are displayed above or below the bar on main chart.
You can also set the following MACD alert with this indicator.
1. When MACD crosses the signal line upwards
2. When MACD crosses the signal line downward
3. When MACD crossed zero line upward
4. When MACD crosses zero line down
MACDのクロスが発生した事を表示します。MACDがシグナルラインを交差すると、ローソク足の上下に、矢印が表示されます。
またこのインジケーターでは以下のMACDのアラートを設定することができます。
1. MACDがシグナルラインを上に交差した時
2. MACDがシグナルラインを下に交差した時
3. MACDがゼロラインを上に交差した時
4. MACDがゼロラインを下に交差した時

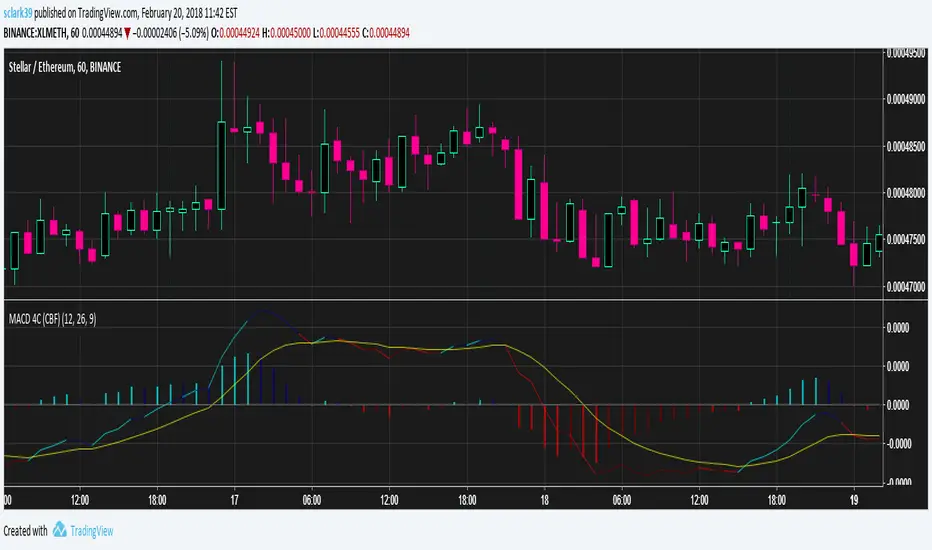
MACD (4 Color, Color-Blind Friendly)Working MACD Histogram which colors bars based on the slope from the previous. The default colors will work for both Deuteranopia and Protonopia color-blind people but can be modified.
There is a bug with 'MACD 4C' by vkno422 + signal line - squattter and 'MACD for colour blind people' by cfhrtd in that it draws the MACD line itself as a histogram, rather than drawing an MACD histogram (which is the MACD line - signal line).
Bad indicators that this should replace:
MACD Color Trawler (by ChartArt)This version of the MACD indicator is 'trawling' (checking) if the MACD histogram and the zero line crossing with the MACD line are both positive or negative. The idea behind this is to show areas with higher or lower risk.
Features:
1. Enable the bar color
2. Enable the background color
3. Change zero line value
FYI:
"The MACD-Histogram is an indicator of an indicator. In fact, MACD is also an indicator of an indicator. This means that the MACD-Histogram is the fourth derivative of price."
First derivative: 12-day EMA and 26-day EMA
Second derivative: MACD (12-day EMA less the 26-day EMA)
Third derivative: MACD signal line (9-day EMA of MACD)
Fourth derivative: MACD-Histogram (MACD less MACD signal line)
Source: stockcharts.com

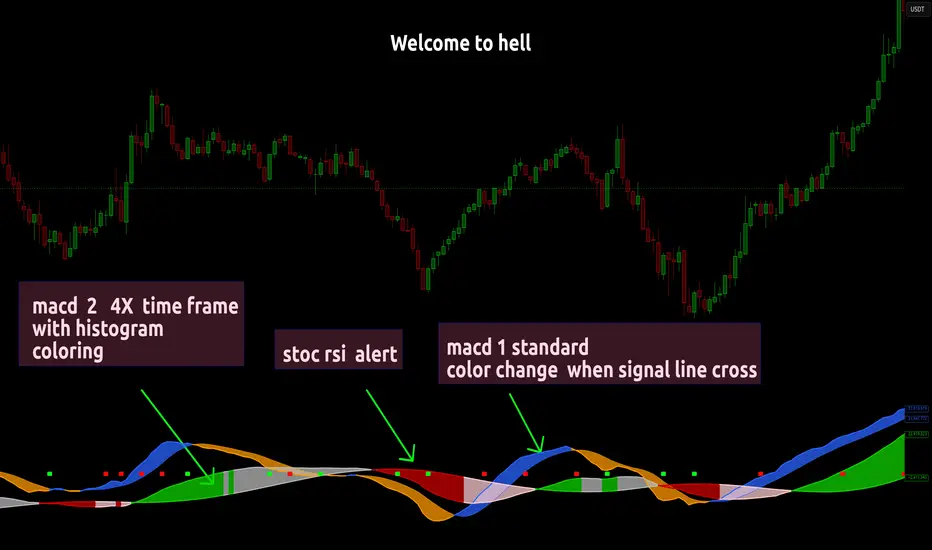
MACD FROM HELLthis is a double macd with 2 time frames macd 1 is chart macd 4 is 4X meaning the 1hr becomes the 4hr and it uses the histogram coloring for added detail ,, on top of that it has stochastic rsi Alerts set to trigger when k line goes above 99.9 or below 0.01 and exits ,, alert triggers on exit
MACD DashboardThe MACD Dashboard is an addition to my collection of various dashboards that are designed to help traders make wiser decisions.
How to Use MACD Dashboard:
Timeframe Selection: Based on your trading style and preferences, choose the relevant timeframes. In the settings, enable or disable timeframes to focus on the most relevant ones for your strategy.
Dashboard Interpretation: The MACD Dashboard displays green (🟢) and red (🔴) symbols to indicate when the MACD is in green or in the red zone. You can also leverage the MACD values on the dashboard to better interpret sentiment and its changes.
Confirmation and Strategy: Consider MACD Dashboard signals as confirmation for your trading strategy. For instance, in an uptrend, look for long opportunities when the dashboard displays consistent green symbols. Conversely, in a downtrend, focus on short opportunities when red symbols dominate.
Risk Management: As with any indicator, use the MACD Dashboard in conjunction with proper risk management techniques. Avoid trading solely based on indicator signals; instead, integrate them into a comprehensive trading plan.
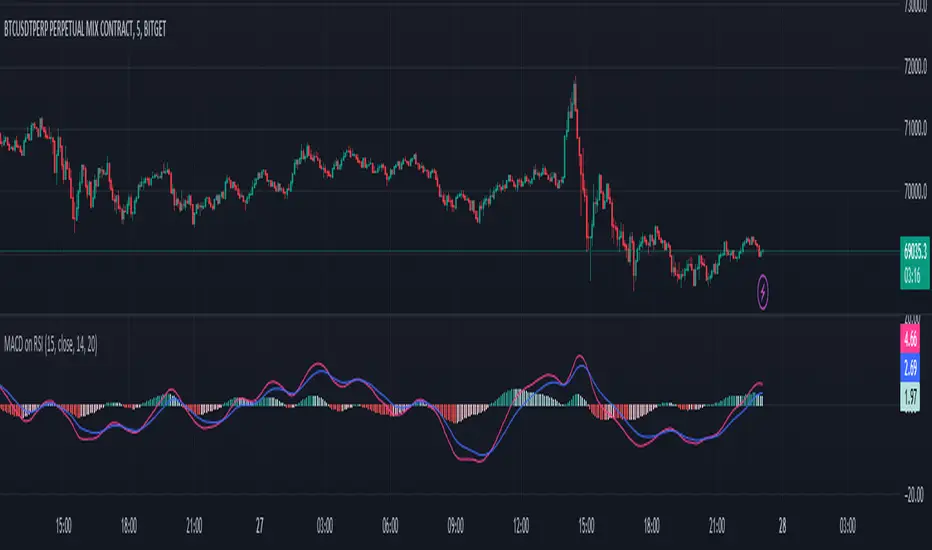
MACD on RSIThe MACD on RSI indicator combines elements of the Moving Average Convergence Divergence (MACD) and the Relative Strength Index (RSI). It calculates the RSI on a specified source with a customizable length, then applies two exponential moving averages (EMAs) to the RSI values. The difference between these EMAs forms the MACD line, visually representing the momentum of the RSI.
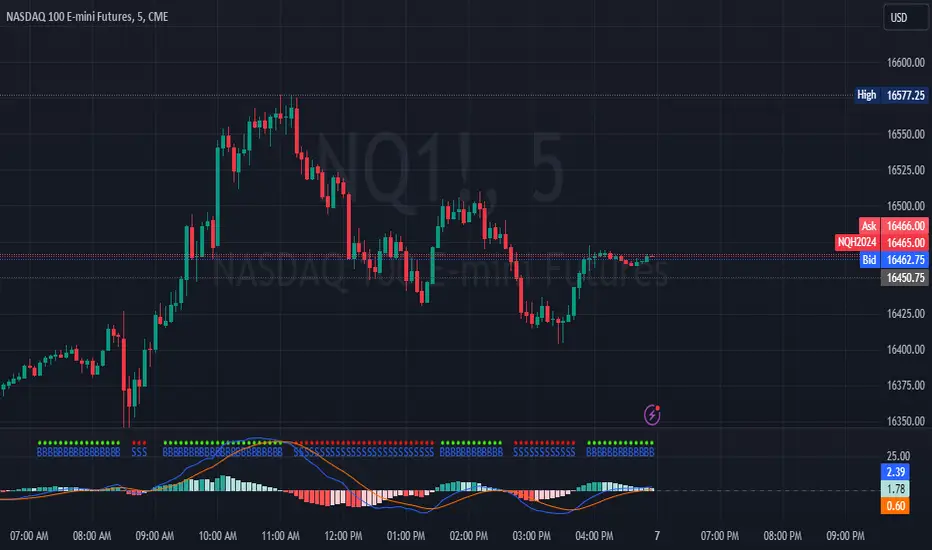
MACD Crossover with +/- FilterThis is to directly target when MACD crosses the Signal line. The purpose of this script is to target a +/- change of 3 in the MACD value after the most recent cross. It uses the value of the MACD line and holds it until a value of 3.00 + or - a crossover or crossunder happens. That's the significance of the red and green circles that appear on the chart. This is not financial advice, but I wanted to recreate what a friend of mine was doing manually and automate it for him.
The first circle that appears after MACD/SIGNAL lines cross would represent a potential trade idea. The circles after the first one match the intention of the first dot as they meet the condition of more than a value of -3 or +3 as the previous dot.
Inputs:
Standard Inputs as normal MACD (Moving Average Converging Divergence) within TradingView
Fast Length: User can change it to any value they want
Slow Length: User can change it to any value they want
Standard 12, 26, 9 as normal MACD // 9 being signal smoothing
Oscillator and Signal Line moving average type is using EMA's
Timeframe is dependent on user chart.
Circles are used for signaling the change in values. Red indicates a short-term bearish trend. Green indicates a short-term bullish trend.
Tested on lower timeframes:
1m, 3m, 5m, 15m, 60m
Not used as much on higher timeframes. Used for trading futures. This is what I use it for. It can be used for other futures than just NQ or ES, but those 2 are the ones that I've tested. Code it shown below for users to tinker with.
Style of indication symbol can be changed via settings within the indicator in the "Style" tab, as well as location of the symbol(s). Additionally, color can be changed as well, if you prefer different colors.
Not financial advice. Just trade ideas.
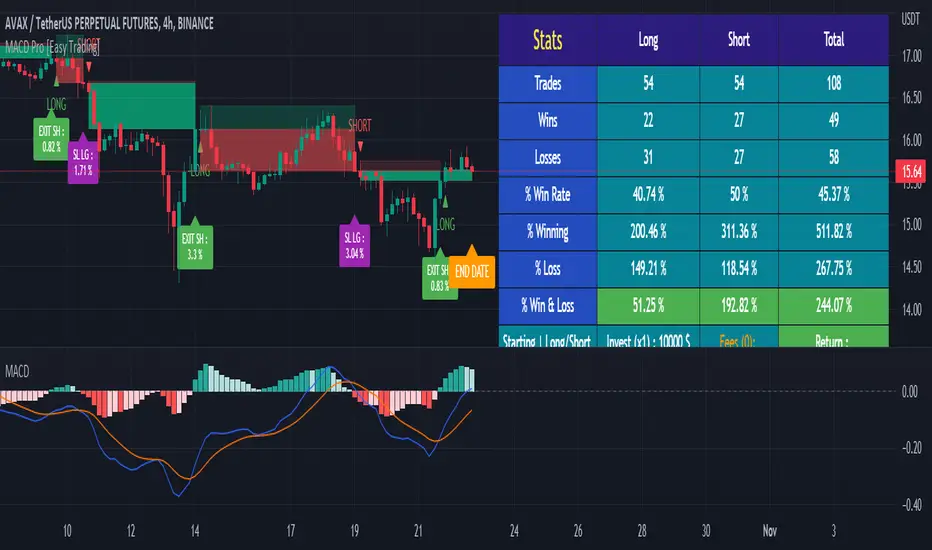
MACD Strategy - Backtest [AlgoRider]█ OVERVIEW
Hello dear Tradingviewers !
We are excited to share with you this new indicator which simulates a trading strategy based solely on the well-known technical indicator MACD . We designed it for the sole educational and analytical purposes of showing novice traders and new investors that basing a trading strategy only on one such technical indicator is not necessarily a good thing to do. We do not recommend to apply this strategy for real.
Thanks to this indicator redesigned in our own way by incorporating our simple and easy-to-use Backtest functionality, you will be able to see and report on the performance and results that such a strategy has produced in the past.
The configuration window has also been designed to be easily readable and simple to use. Our goal is to make parameter customization as easy as possible.
█ HOW THE STRATEGY WORKS
• The script will simply trigger Long entries when bullish MACD crossings appear (the Macd line crosses the Signal line upwards) and Short entries when bearish MACD crossings appear (the Macd line crosses below the signal line).
• A Short signal ends a Long trade, a Long signal ends a Short trade.
• The script also allows setting up custom TP and SL.
• An option allows you to trigger early crossings, which will influence entries and exits.
• There is no repaint, once an entry/exit symbol or drawing is displayed it doesn't change anymore. The Short and Long signals appear at the open of the candles, just after the signal was confirmed at the close of the previous candle. The custom TP and custom SL signals can appear when a candle is not yet finished, but once displayed they don't change.
█ HOW TO PROCEED
1 — Once the script is applied to your chart, it already works with its default settings. You can already see the performance of the strategy in the data table directly on the chart (in the top right corner by default).
2 — You can customize the strategy and influence the results/performance by modifying its parameters. 3 types of parameters are present and can be modified.
3 — You can use this indicator in all types of markets.
4 — You can apply the script in every timeframe.
█ PARAMETERS
• Settings For Backtesting
- Strategy : Choose from a drop-down list if the strategy should execute only Long trades or only Short trades or both. Default Both.
- Invest. : Choose the amount you want to invest in the simulation. Default 10000.
- Position : Choose the amount of the position (Size order) that will be used during the simulation. This will be the $ amount staked/involved for each trade entry.
Ex: If you put 20000 in position and 10000 in Invest. We consider that you use at least a leverage x2. Default 10000.
- Slipp. TP : Choose the amount in percentage of average slippage for Take Profits. This parameter makes it possible to predict a potential gap between the theoretical exit price for each TP (On the graph) and the real exit price on an exchange when implementing the strategy for real (slippage may be due to a time lag of a few seconds from execution time of the order on the exchange and/or due to the execution of a market order).
Ex: If a TP exit order of a Long trade, with entry $19000 (on BTCUSDT ), is carried out in theory on the chart at $20000, in practice on the exchange the script have indeed sent an exit order at 20000 , but if the true exit price is 20050, the TP slippage is then +0.25%. Default 0.
- Slipp. SL : Choose the amount in percentage of average slippage for Stop Losses. This parameter makes it possible to predict a potential gap between the theoretical exit price for each SL (On the graph) and the real exit price on an exchange when implementing the strategy for real.
Ex: If an SL exit order of a Long trade, entry $19000 (on BTCUSDT ), is carried out in theory on the chart at $18000, in practice on the exchange the script have indeed sent an exit order at 18000 $, but if the true exit price is 17950, the slippage SL is then +0.278%. Default 0.
- Fees % : Choose the percentage amount of fees applied to each trade to simulate the application of the strategy on the exchange of your choice. Applies to the entry and exit of each trade. Ex: For Binance Futures: 0.04; For Bybit futures: 0.06; For Ftx Futures: 0.075. Default 0.
- Cumulate Trades : If you check this, the Backtest will use 100% of the balance as Order Size (Position) for All or in the next X consecutive trades. Default not checked.
⚠️ Be Careful please, this option is available to show the full extent and possibilities of the algorithm when pushed to its limits thanks to the accumulation of profits (cumulative earnings ), but it is a strategy that involves great risk. If a bad trade suffers a -50% loss, 50% of the account balance is lost, if the position is liquidated, the entire account balance is lost.
- All : If you check this All trades will be accumulated. Default not checked.
- Consecutive Trades : Choose the number of trades to accumulate. After X consecutive trades, the algorithm reassigns the initial order size to the current one and starts again for X consecutive trades. Minimum Value 2, Default 2.
• Settings To Optimize Performances and Risk Management
- Fast_MA : Choose the length of the Fast Moving Average. Default 12.
- Slow_MA : Choose the length of the Slow Moving Average. Default 26.
- Enable Early Crossings : If you check this, when the algorithm will detect an early crossing wethere bullish or bearish , it will trigger the Long or Short entries. Default not checked.
- Oscillator MA Type : Choose if the Macd line should be an Exponential Moving Average or a Simple Moving Average . Default Expo.
- Signal Line MA Type : Choose if the Signal line should be an Exponential Moving Average or a Simple Moving Average . Default Expo.
- Use TP / Use SL : If you check these, the algorithm will trigger personalized trade exit signals when the price evolution has reached the amounts indicated since the trade entry. Default not Checked.
- % TP - SL : Indicate here the personalized amount in percentage that you want for your Take Profit and Stop Loss of each trade. Default 15-5.
• Settings For Appearances
- Small-size Data Table : If you check this, the data table will become smaller to free up more space on the chart to make it visually more pleasing. Default not checked.
Hide Table /
- Hide Labels / : You can check these to get a cleaner chart and focus only on what interests you in the indicator. Default not checked.
Hide Risk-Reward Areas
█ LIMITATIONS
• ⚠️ We repeat it once again, this strategy is not intended to be reproduced in real conditions, we have designed it for educational and analytical purposes only.
• Even if you see good performances when you backtest the strategy, you must take into account that these results are performed in the past and that in no case does this guarantee that these same performances will be repeated again in the future.
• When you run for real a trading strategy you must be aware of the fact that you are solely responsible for the results that you will be able to obtain and you must be aware of the possibility at all times of partial or even total losses of your invested capital.
• Keep in mind that generating profits in trading is difficult. A strategy can perform very well at one time in the past during a period that is favorable to it, then from one day to the next it can give really bad results for several months or years.
• When backtesting a trading strategy, there are many factors to consider, not just trade entries to which you add a Take Profit and sometimes a Stop Loss. You must at least take into account the size of the position in relation to the capital you want to invest, the trading fees, the slippages (which can be really important depending on the exchange on which you are trading and depending on the asset you are trading), trading frequency, risk management, momentum, volumes and even more.
The information published here on TradingView is not prohibited, doesn't constitute investment advice, and isn't created solely for qualified investors.
═════════════════════════════════════════════════════════════════════════
Important to note : our indicators with the same backtesting system are published in separate publications, because putting them together in a single script would considerably slow down the execution of the script. In addition each indicator, even when it is based on a simple technical indicator, has several options, parameters and entry/exit conditions specific to the underlying technical indicator. Finally, we want to keep the simplicity of use, configuration and understanding of our indicator by not mixing strategies that have nothing to do with each other.
MACD ModifiedIn an attempt to improve the MACD for trading, I have added an alternative way to calculate the MACD Line and Overbought/Oversold (OB/OS) lines to filter signals.
The alternate calculation I named "Modified" and put the option to select it under "MACD Calculation" in the input menu. Traditionally the MACD is calculated as fastEMA - slowEMA, for "Modified" I changed the calculation to ((fastEMA - slowEMA) / slowEMA * 100). The goal of this change is to view the difference in MA as a percent of the slow. The hope is that this will compensate for securities that have had major gains or losses in their history.
For the OB/OS lines, I coded in three different ways to calculate them. Users can select which method they prefer in the input menu. The first is through pivot points. The script records the pivot points into an array and takes the average of the array. There are two arrays, one for the OB line and one for the OS line. I also added filters so it will only record pivots above/below a specific value. The crosses on the indicator are for debugging purposes only. They mark the pivots that were recorded into the arrays. The crosses are offset by the pivot strength and do not provide timely indications. All inputs are adjustable for the pivots in the "Pivots" section of the input menu. The second method for the OB/OS lines I added is Bollinger Bands. The user can choose to put it around the Signal or MACD line. The final method added is simply using the previous high/low pivot of the MACD line.

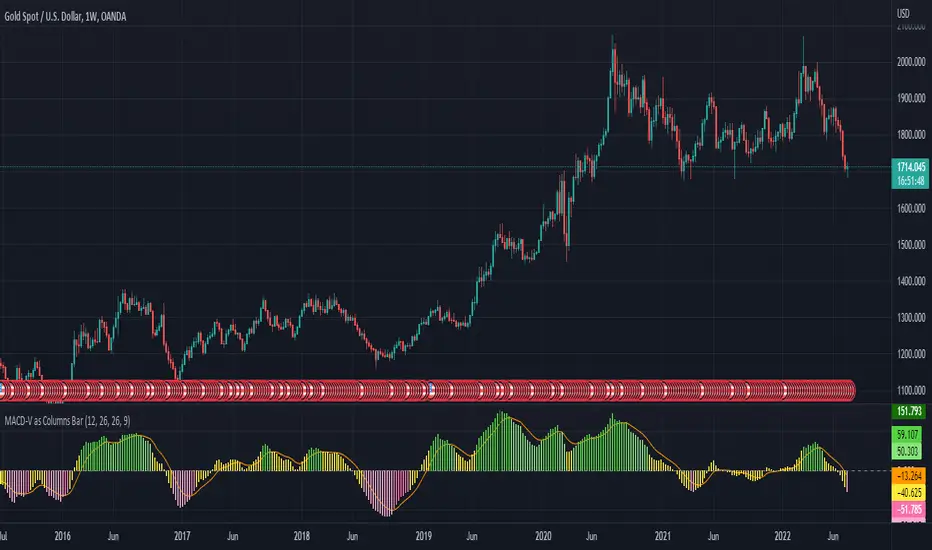
MACD-V as Columns BarI use MACD-V as Columns Bar and including the signal line
Not use MACD-V - Signal Line as Histogram
Enjoy!
MACD Scalper AnalysisThis is a scalper analysis movement designed around MACD and 200 EMA
The rules are simple:
For long we check if the close of the candle is above the ema200 and we have a crossover between macd and signal
Once this happens we analyse the next candle, if its close higher than open , we can consider it a win and if its close lower than open we consider a lose.
For short we check if the close of the candle is below the ema200 and we have a crossunder between macd and signal
Once this happens we analyse the next candle, if its close higher than open , we can consider it a loss and if its close lower than open we consider a win.
Once we have all of this we analyse the average percentage movement and establish if the specific asset or timeframe is worthy for us.
At the same time it can give a good idea if we can go with a divergence strategy, like for example we have a short entry, but we will actually go long and viceversa.
If you have any questions let me know !

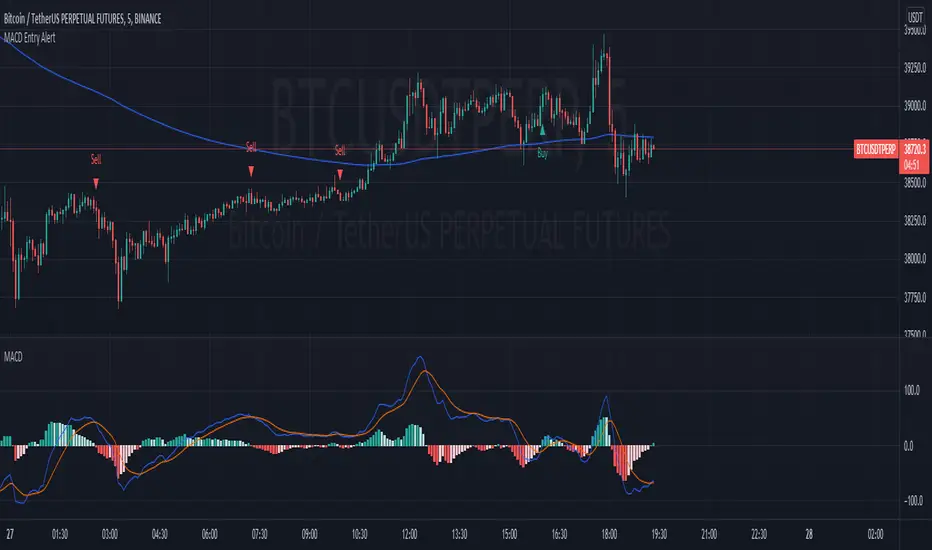
MACD Strategy AlertThis Indicator will only give you potential entry base on MACD strategy combine with a 200 EMA
-Sell when price under 200 ema and MACD is crossing the signal line above 0
-Buy when price above 200 ema and MACD is crossing the signal line under 0
-Sending Alert for each Potential Entry
MACD Linear Regression by zdmreBoth the Moving Average Convergence Divergence (MACD) and the Linear Regression (LR) rank among the most popular momentum indicators used in trading. When used in combination with other technical indicators, both MACD and LR can offer value in validating trade opportunities to optimize your risk management practices.
While they represent a similar approach to evaluating trades, the functions of both MACD and LR are distinct, which makes them useful indicators to combine in trade evaluation. Here’s a look at how to use MACD and LR as part of your trade analysis.
***Use it at your own risk
If you have new ideas to improve this indicator then let me know please.
Keep Learning, Keep Earning
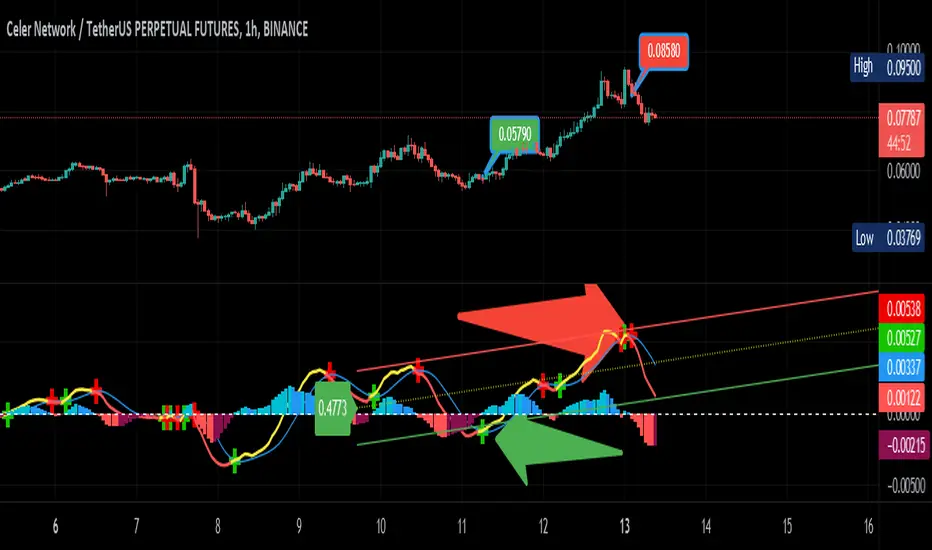
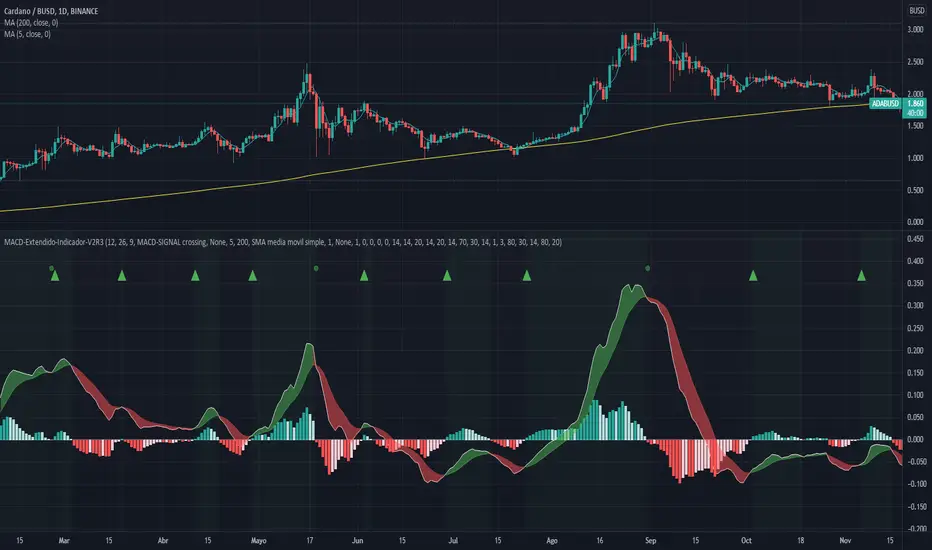
MACD-Extendido-Indicador por NeilMACD-Extendida-Estrategia
--------------------------------
DESCRIPTION
Resource that identifies entry and exit operations using the indicator
Average Convergence and Divergence Movements (MACD) and 5 strategies
INTERESTING
Novel strategies are implemented such as:
1. Overbought and oversold band to avoid horizontal movements
2. Control inputs and outputs at positions opposite the histogram line
3. Make a profit (take profit) without prior purchase orders
HOW DOES IT WORK (STRATEGIES)
1) Overbought and oversold:
Allows you to define an overbought upper band
Allows you to define an oversold ower band
Operations that occur within the band are ignored
2) Place of next operation (either side):
Indicates that the next operation can occur on either side of the histogram
3) Place of next operation (opposite side):
Indicates that the next operation must occur on the opposite side of the histogram
4) Take profit:
It allows defining the deviation in favor to execute a take profit.
It does not place a buy order at a distant point, instead it looks back and if the shift meets the expected deviation, take profit is executed
5) Loss control (stop loss):
It allows to define the deviation against to execute a stop loss.
It does not place a stop order at a distant point, instead it looks back and if the displacement meets the expected deviation the stop loss is executed
How to use it:
Press the "Indicators" option, go to the "Public Librarian" segment, write the name "MACD-Extendido-Indicador Neil", double-click on the record in question and you will have it added in your work panel, now, just It remains to be used to identify the inputs and outputs and you can do it visually or by defining the automatic notification alerts.
DESCRIPCION
Recurso que identifica operaciones de entradas y salida haciendo uso del indicador
Media Móvil de Convergencia/Divergencia (MACD) y 5 estrategias
NOVEDADES
Se implementan estrategias novedosas como:
1. Banda de sobrecompra y sobreventa para esquivar movimientos horizontales
2. Control de entradas y salidas en posiciones contrarias a la línea del histograma
3. Toma de ganancias (take profit) sin ordenes de compra previa
COMO FUNCIONA (ESTRATEGIAS)
1) Sobrecompra y Sobreventa:
Permite definir una banda superior de sobrecompra
Permite definir una banda inferior de sobreventa
Operaciones que ocurren dentro de la banda son ignoradas
2) Lugar de próxima operación (cualquier lado):
Indica que la próxima operación puede ocurrir en cualquier lado del histograma
3) Lugar de próxima operación (lado opuesto):
Indica que la próxima operación debe ocurrir en el lado opuesto del histograma
4) Toma de ganancias (take profit):
Permite definir la desviación a favor para ejecutar una toma de ganancia.
No coloca una orden de compra en un punto distante, en su lugar mira hacia atrás y si el desplazamiento cumple con la desviación esperada se ejecuta la toma de ganancia
5) Control de pérdida (stop loss):
Permite definir la desviación en contra para ejecutar una parada de pérdida.
No coloca una orden de parada en un punto distante, en su lugar mira hacia atrás y si el desplazamiento cumple con la desviación esperada se ejecuta la parada de la pérdida
Como usarlo:
Presione la opción "Indicadores", ubíquese en el segmento "Libreria Publica", escriba el nombre "MACD-Extendido-Indicador por Neil", haga doble clic sobre el registro en cuestión y lo tendrá agregado en su panel de trabajo, ahora, solo resta usarlo para identificar las entradas y salidas y puede hacerlo de forma visual o definiendo las alertas de notificación automática.
MACD + PSAR SetupThis indicator combines 3 elements:-
1. MACD which will act as a source of potential Buy Signal
2. PSAR which provides the confirmation for buy signal and for potential Buy on Dip Strategy
3. Breakout candles which provides the confirmation signal for Buy on Breakout strategy
4. The direction of the trend is provided by the Exponential Moving Average
The strategy is to have any counters which has triggered the MACD Golden Cross signal. These counters are to be out under watchlist for further confirmation.
The Buy Signal is confirmed when:-
1. Price is above EMA Direction(standard is set at 200)
2. PSAR has given the Buy Signal OR a Breakout Candle occurs.
Buy Signal is shown with a Green Diamond symbol whilst the Sell Signal is shown in Red Diamond Symbol.
The bullish and bearish condition is set via a green and red background
The MACD and PSAR codes are derived from the standard codes which is available in tradingview.

MacD Custom Indicator (updated to version 4)I updated existing script “ MacD Custom Indicator-Multiple Time Frame+All Available Options! ” originally created by ChrisMoody to Pine Script 4. version, so you can use it within your own strategy for algotrading or trading bots.

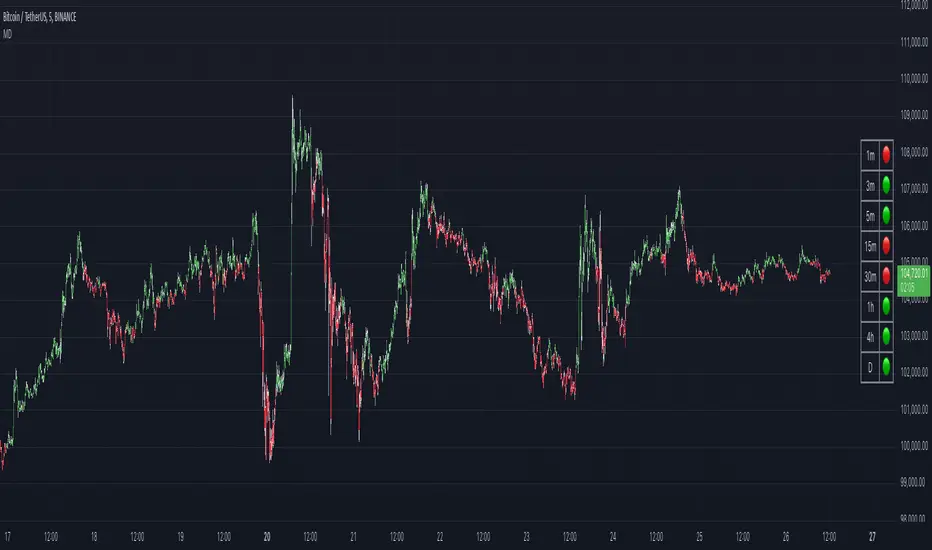
MACD BandsThis is MACD indicator on the price chart. You can read the same information as the original MACD but much more.
You can use it the same way as MACD but it won't use any space below your chart. Also you can use signal line and cloud as trend confirmation: e.g. if above them it can be a stronger uptrend.
The signal line (yellow by default) can be used as a support-resistance line.
If teal line is above maroon line, MACD is positive, otherwise it is negative
MACD value is the width of the cloud
Cloud color is green when MACD histogram is positive, red if negative
You can change MA types
MACD and histogram values can be seen in Data Window

MACD Seasons by Dr Ken Longthis specific Moving Average Divergence Convergence Seasons Indicator is made by Dr Ken Long Tortoise Capital brings a unique way of the flow of the market, the 4 seasons are used to describe the areas of the MACD so for example when the area is below zero and hasn't crossed the EMA 5 we call that winter which is very bear bias, once you get support in winter and crosses above the EMA 5 we call that fall which is the first indication of support for price and some weakness toward the downside. if the MACD is above the zero line we call that summer which is a very bull bias valued area, and once it crosses below the EMA 5 then that's where we call fall mode showing us weakness and very slight indication of a possible reversal. the MACD can be both used for swing trade and day trading, it provides a unique insight to the markets showing the layers of a trend using seasons.

MACD with Lines - ChartWhat is MACD with Lines - Chart and why do you need it?
I use it for chart analysis to identify key macd /signal levels from which bullish / bearish market structure continues to develop.
Chart means that every Macd /Signal cross above/below the signal lines will be notified on your Chart and not on your MACD Indicator. To see them on your chart please choose "MACD with Lines - Default" in my library.
Once Signal, Macd or the Histogramm cross over or under your upper or lower signal line you will see background colors which you can adjust in the settings menu.
This small indicator is for a larger project which will be uploaded in several days/weeks.
