tvbot Trend Following with Mean Reversion algoDefault settings are for the ETHUSDT 5 min Binance Chart regular candles.
Back test Default settings are 10,000 usd to start, Commission 0.075%, capital deployment per position is 10%, slippage value of 1.
This algo uses the EMA to set the trend line . You are also able to turn the trend line into a range instead of just a static line. The algo uses the VWMA to set the base entry parameters. When a candle closes above or below the VWMA it will record that price and then wait for the VWMA to meet the candle close price. When that happens the Base entry condition is met. (it causes the vwma to create a hook like structure. essentially tell you that the momentum has changed directions.)
The algo will always check to see if the trend line has either breached or has been tested and held. If this condition has been met it will then go to the base entry condition to check to see if the momentum has changed.
There is a mean reversion component in this algo as well. When the price has moved away from the mean(set by user) by a certain amount the algo will start to look for a top or bottom. Once that condition has been met it will then use the base entry condition to look for a change in momentum, but the mean reversion base entry condition uses the HMA to check for a change in momentum.
This algo effectively looks like a hamburger. Mean reversion being the tops and bottoms(bun) and the trend following(beef patty)
Search in scripts for "momentum"

IPB_JPMUPS_2022Introduction :
This indicator serves two purposes
a) It is a multi dimensional floor pivot indicator, which takes its concepts from Secrets of Pivot Boss book of Frank Ochoa. Most of the indicators suggested in the book are packed in one indicator.
b) It also has an inbuilt intraday strategy which identifies trend, direction and momentum based on CPR (Central Pivot Range) concepts and accordingly comes up with trading signals.
How this indicator is different from the published ones :
A). Role as an indicator
This indicator has all the CPR (Central Pivot Range) indicators packed together which provides a ready made solution for CPR based trading. The following are the salient features of this indicator :
1) This indicator plots daily CPR using previous day high, low and close. It also plots Support and Resistance levels based on floor pivots formula.
Moreover, it also plots developing CPR which is based on current day's high, low and close. Apart from that it also plots CPR for next day session as well which is useful for EOD analysis.
2) This indicator plots weekly CPR using previous week high, low and close. It also plots developing CPR which is based on current week's high, low and close.
3) This indicator plots monthly CPR using previous month high, low and close. It also plots developing CPR which is based on current month's high, low and close.
4) This indicator plots pivot EMA which is called PEMA. It uses three different EMAs which are customisable and uses them to plot a moving average web based on pivot points of each candle, which is called as PEMA. This also facilitates PEMA plotting for higher time frame (daily time frame) as well.
5) This indicator plots daily time frame moving average in intraday chart which can be used as a key zone during trading. The period is customisable.
B) Role as a strategy
This indicator also functions as an intraday trading strategy called JPMUPS (JP stands for author's nickname. MUPS stands for Manoj Ultimate Pivot Strategy). This strategy attempts to identify trend, direction and momentum and when all these three align together it gives buy and sell signals. The concepts are as under:
Trend identification :
Whenever a trend is established, the developing CPR starts to widen. Hence this strategy uses the width of the developing CPR and compares it with the MA of the width to identify the trend. If the width of the developing CPR crosses the 34 period MA (can be customised), it assumes a trend is developing.
Direction identification:
Whenever a direction is established, the CPR components, namely BC and TC shifts its position. Hence this strategy uses this concept to identify the direction. It computes MACD sort of histogram of the BC and TC difference and whenever the histogram slops upwards, it assumes bullish direction and vice versa.
Momentum identification :
Whenever momentum is established, the developing CPR starts sloping upwards. Hence this strategy uses this concept to identify the momentum. It computes RSI of the developing CPR and if the RSI is above the 34 period MA (can be customised) of RSI , it assumes momentum is establishing and vice versa.
When all the above are aligned together, it gives buy or sell signals suitably.
How to use it :
a) Indicator usage :
1) CPR zones are key zones which predominantly acts as support and resistance zones. Looking at the price action at these zones, one can look for trading opportunities in live market.
2) Developing CPR acts as pull back zones and is very useful in live trading and also EOD analysis for spotting opportunities by combining price action.
b) Strategy usage :
1). Strategy signals are only indicative. Users are strongly advised not to use the strategy blindly. Users are advised to go though the CPR concepts thoroughly and use this strategy signals only as a supplement for further decision making / analysis.
Markets meant for :
1). This indicator and Strategy is predominantly designed for I ndian stock markets . However it can be customised for other markets as well by changing the timings of the markets in the parameters.
Market conditions meant for :
1). This indicator is meant for all types of market conditions as its predominant role is to plot the key support and resistance zones using CPR concepts.
2). The strategy is mainly found to be effective in trending markets and predominantly indices like Nifty and Bank Nifty . Hence Users are advised to use this only as an indicative feature and not blindly trade based on signals. The strategy is found to be less effective in lower time frames like 1min / 3min, etc. 15 min time frame provides fair performance. However it doesnt mean that it will continue to perform in the same manner in the future.

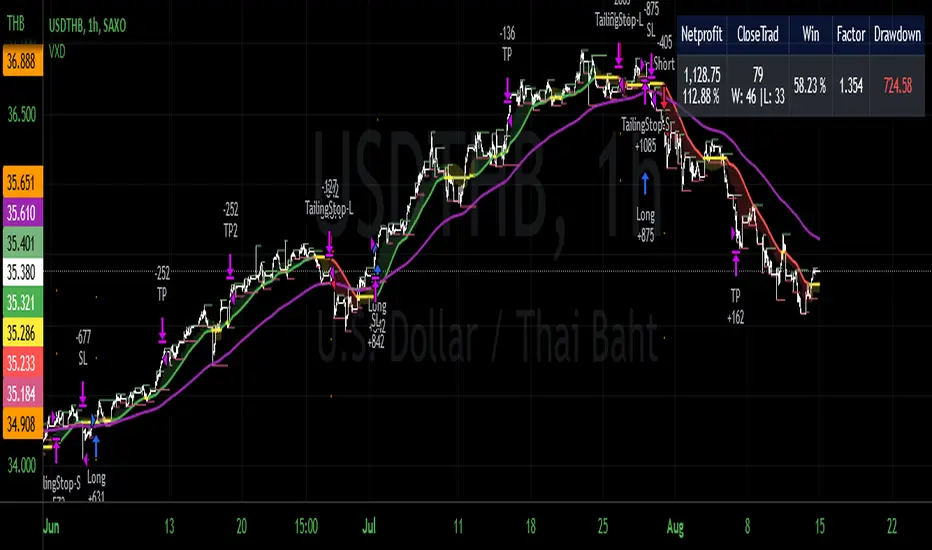
VXD Cloud EditionVXD Cloud Edition.
to overcome sideways market conditions this cloud configured for low timeframe.
every TA is same as VXD Supercycle but show as cloud.
Symbols on chart show Premium and Discount Prices
X-Cross = Engulfing Candle with weak volume .
O-circle - Engulfing Candle with strong volume .
Pivot point and Rejected Block
Pivot show last High and low of a price in past bars
Rejected Block show when that High or Low price are important level to determined if it's Hidden Divergence or Divergence (with RSI)
Setting
Momentum: RSI = 25 , RSI MA = 14
Trend: Rolling VWAP and ATR and Subhag (Everthing show as a cloud)
Trailing STOP: ATR 12 x 2.4
Highlight Bars color when volume is above SMA 6
SMA200 act as TP Line
Risk:Reward Calculation
if Buy your Stoploss will be previous Pivot low
if Sell your Stoploss will be previous Pivot high
and TP line will be calculated form there, then show in Orange color line
Buy condition : Close is above Cloud and close above pivot high
Sell condition : Close is below Cloud and close below pivot low
Trip : add this to alerts setting.
Order {{strategy.order.action}} filled on {{ticker}} @ {{strategy.order.price}} {{strategy.order.alert_message}}.
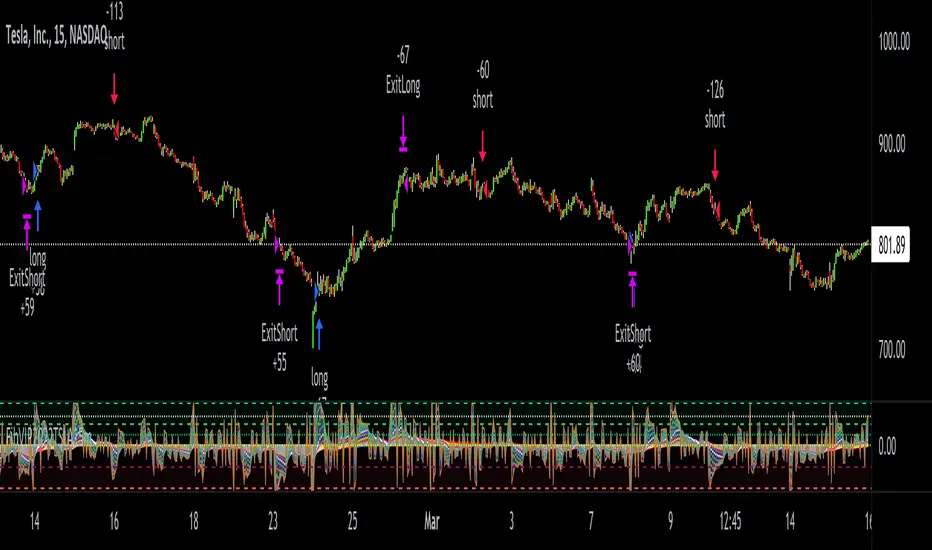
FibVIP2022TSLAThis is version 1.0 FibVIP2022TSLA Strategy. This has only been back tested for the ticker "TSLA" for the year 2022. And I real time capital tested it personally. The reason I isolated this strategy to 2022 is because Tesla's chart patterns have changed from the previous 2 years. So, I wanted to develop an indicator-based strategy that was consistent with current market conditions. The default setting for percent of equity is set to 5% risk. I will adjust any variables that make this FibVIP2022TSLA Strategy more accurate in the future as more 2022 data comes out.
It's based on my Fibonacci VIP indicator script. Fibonacci VIP (Fibonacci Volume Indicator Precision) is a volume indicator that I made to help me have precise entry and exit timing. It's based on the well-known Fibonacci sequence 1, 2, 3, 5, 8, 13, 21, 34, 55, 89, 144, 233. The default colors I like to use can be changed to whatever you want. The numbers inputted are based on volume ema.
Bullish momentum in ascending order is 21 = white, 13 = blue, 8 = green.
Bearish momentum descending order is 89 = red, 55 = yellow, 34 = purple.
Immediate momentum 1 = orange, 2 = blue, 3 = neon green, 5 = lime.
Long term momentum 144 = lime, 233 = teal.
Four high, mid high, mid low & low dashed channel lines with transparent fill colors lime, green, maroon & red. Also, there's a gray zero static line & white dynamic horizontal dotted line ema1 & ema8 to help keep momentum in perspective. The most bullish signal is when all colors are in a top-down order 1, 2, 3, 5, 8, 13, 21, 34, 55, 89, 144, 233. The most bearish signal is when all colors are reversed and have a bottom-up order of 233, 144, 89, 55, 34, 21, 13, 8, 5, 3, 2, 1.
A crossover, cross-under, divergence or convergence of these colors, help signal the future price action. For example, green crossing over red is bullish, but green crossing under red is bearish. If colors are low / below the zero line that's bearish and if they are above the zero line, that's bullish. The FibVIP works great as a leading indicator to confirm future price action of the underlying security momentum.
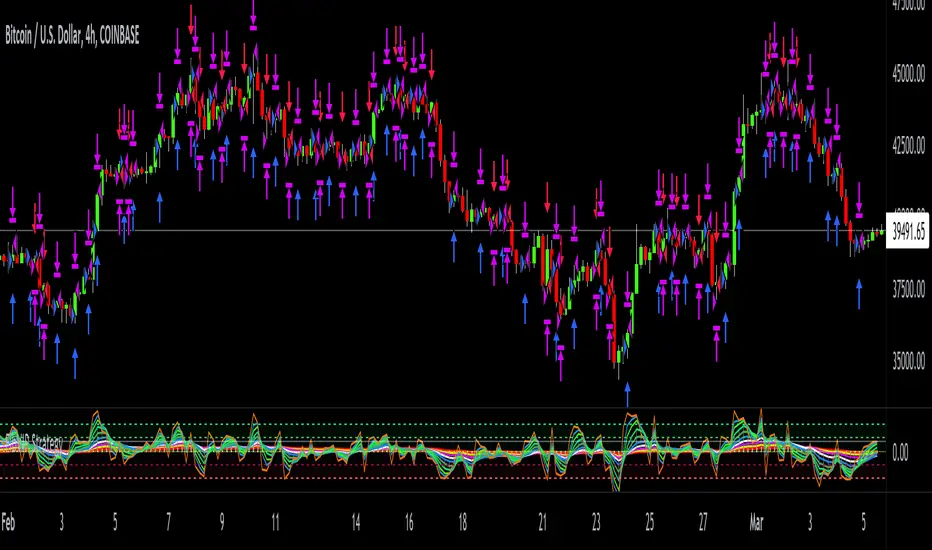
FibVIP StrategyThis is version 1.0 FibVIP Strategy. It's based on my Fibonacci VIP indicator script. Fibonacci VIP (Fibonacci Volume Indicator Precision) is a volume indicator that I made to help me have precise entry and exit timing. It's based on the well-known Fibonacci sequence 1, 2, 3, 5, 8, 13, 21, 34, 55, 89...
The default colors I like to use can be changed to whatever you want. The numbers inputted are based on volume.
Bullish momentum in ascending order is 21 = white, 13 = blue, 8 = green.
Bearish momentum descending order is 89 = red, 55 = yellow, 34 = purple.
Immediate momentum 1 = orange, 2 = blue, 3 = neon green, 5 = lime.
Four high, mid high, mid low & low dashed channel lines with transparent fill colors lime, green, maroon & red.
Also, there's a gray zero line & white dynamic horizontal dotted line to help keep momentum in perspective.
The most bullish signal is when all colors are in a top-down order 1, 2, 3, 5, 8, 13, 21, 34, 55, 89. The most bearish signal is when all colors are reversed and have a bottom-up order of 89, 55, 34, 21, 13, 8, 5, 3, 2, 1.
A crossover, cross-under, divergence or convergence of these colors, help signal the future price action. For example, green crossing over red is bullish, but green crossing under red is bearish.
If colors are low / below the zero line that's bearish and if they are above the zero line, that's bullish.
The FibVIP works great as a leading indicator to confirm future price action of the underlying security momentum.
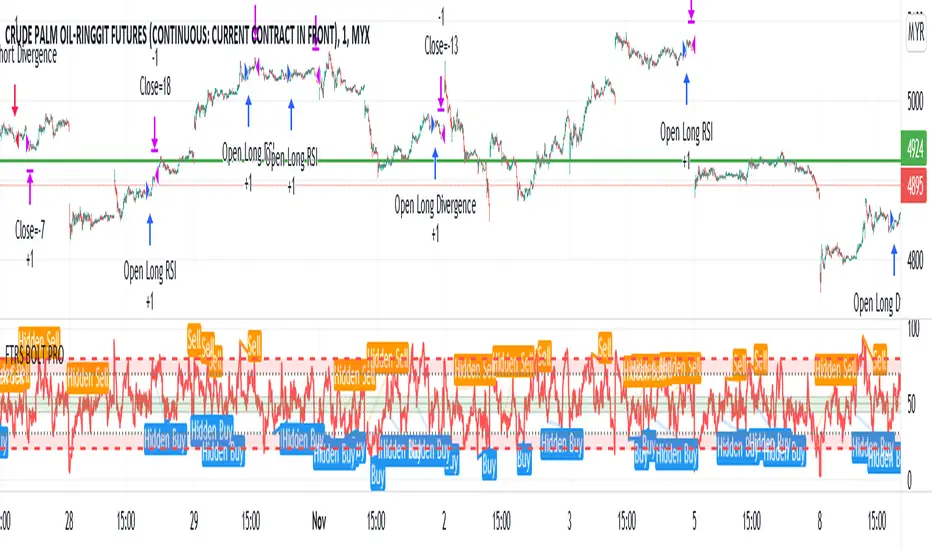
FTRS BOLT PRO
The script uses RSI as major trend identification and supported by RSI divergence for take profit, and also counter trend in certain cases.
Uses EMA 200 for major trend identification to filter false signals, Average Volume as confirmation and faster signal detection to the change of trend.
The indicator detects immediate change of trend and immediately opens position for the major trend.
User can enjoy the RSI with labels of divergence to do manual judgement.
Existing risk to reward ratio based on amount of money instead of ticks count. The currency is depending on the chart's trading currency.
This strategy mainly built for FCPO and its for 1 min settings only. User can toggle the sessions as per users preferences
The default risk to reward ratio is 1:1.5. However, there is a risk management using RSI levels to
CryptoEQ SignalAbout the signal:
CryptoEQ™ provides real-time trading signals to help traders and investors with excellent entry and exit points. The CryptoEQ™ has an easy to understand signal that helps traders -along with their own research- determine if a crypto assets price is overbought or oversold. CryptoEQ™ uses proprietary algorithms that take into consideration popular momentum indicators in trading, including, but not limited to Relative Strength Index (RSI) , Stochastic Oscillator (SO) , and Stochastic Relative Strength Index (SRSI) to produce their trading signals.
About momentum indicators:
Momentum indicators help traders and analysts identify where the market will reverse after moving in a direction. The direction changes are identified through divergence between price and momentum.
Using the signal:
Using the signal is straightforward. If a “BUY” signal is triggered it indicates an oversold condition, if a “PULL BACK” signal is triggered it indicates an overbought condition.
About CryptoEQ™:
CryptoEQ™ helps investors and traders make informed investment decisions by providing comprehensive, accurate, and up-to-date research and analysis on crypto-projects. They abide by strict principles and ethics to provide honest information while actively seeking to identify scams, low quality, and nefarious projects. All signals are available at cryptoeq.io. You can find additional content on our social media platforms, which include Instagram, Twitter, Telegram, and LinkedIn.

multi Stoch + MACD + CCI strategy (J)The Stochastic Oscillator (STOCH) is a range bound momentum oscillator. The Stochastic indicator is designed to display the location of the close compared to the high/low range over a user defined number of periods. Typically, the Stochastic Oscillator is used for three things; Identifying overbought and oversold levels, spotting divergences and also identifying bull and bear set ups or signals.
www.tradingview.com(STOCH)
MACD is an extremely popular indicator used in technical analysis. MACD can be used to identify aspects of a security's overall trend. Most notably these aspects are momentum, as well as trend direction and duration. What makes MACD so informative is that it is actually the combination of two different types of indicators. First, MACD employs two Moving Averages of varying lengths (which are lagging indicators) to identify trend direction and duration. Then, MACD takes the difference in values between those two Moving Averages (MACD Line) and an EMA of those Moving Averages (Signal Line) and plots that difference between the two lines as a histogram which oscillates above and below a center Zero Line. The histogram is used as a good indication of a security's momentum.
www.tradingview.com(Moving_Average_Convergence/Divergence)
The Commodity Channel Index (CCI) is a momentum oscillator used in technical analysis primarily to identify overbought and oversold levels by measuring an instrument's variations away from its statistical mean. CCI is a very well-known and widely-used indicator that has gained level of popularity in no small part of its versatility. Besides overbought/oversold levels, CCI is often used to find reversals as well as divergences. Originally, the indicator was designed to be used for identifying trends in commodities, however it is now used in a wide range of financial instruments.
www.tradingview.com(CCI)

Gyspy Bot Trade Engine - V1.2B - Strategy 12-7-25 - SignalLynxGypsy Bot Trade Engine (MK6 V1.2B) - Ultimate Strategy & Backtest
Brought to you by Signal Lynx | Automation for the Night-Shift Nation 🌙
1. Executive Summary & Architecture
Gypsy Bot (MK6 V1.2B) is not merely a strategy; it is a massive, modular Trade Engine built specifically for the TradingView Pine Script environment. While most strategies rely on a single dominant indicator (like an RSI cross or a MACD flip) to generate signals, Gypsy Bot functions as a sophisticated Consensus Algorithm.
The engine calculates data from up to 12 distinct Technical Analysis Modules simultaneously on every bar closing. It aggregates these signals into a "Vote Count" and only executes a trade entry when a user-defined threshold of concurring signals is met. This "Voting System" acts as a noise filter, requiring multiple independent mathematical models—ranging from volume flow and momentum to cyclical harmonics and trend strength—to agree on market direction before capital is committed.
Beyond entries, Gypsy Bot features a proprietary Risk Management suite called the Dump Protection Team (DPT). This logic layer operates independently of the entry modules, specifically scanning for "Moon" (Parabolic) or "Nuke" (Crash) volatility events to force-exit positions, overriding standard stops to preserve capital during Black Swan events.
2. ⚠️ The Philosophy of "Curve Fitting" (Must Read)
One must be careful when applying Gypsy Bot to new pairs or charts.
To be fully transparent: Gypsy Bot is, by definition, a very advanced curve-fitting engine. Because it grants the user granular control over 12 modules, dozens of thresholds, and specific voting requirements, it is extremely easy to "over-fit" the data. You can easily toggle switches until the backtest shows a 100% win rate, only to have the strategy fail immediately in live markets because it was tuned to historical noise rather than market structure.
To use this engine successfully, you must adopt a specific optimization mindset:
Ignore Raw Net Profit: Do not tune for the highest dollar amount. A strategy that makes $1M in the backtest but has a 40% drawdown is useless.
Prioritize Stability: Look for a high Profit Factor (1.5+), a high Percent Profitable, and a smooth equity curve.
Regular Maintenance is Mandatory: Markets shift regimes (e.g., from Bull Trend to Crab Range). Parameters that worked perfectly in 2021 may fail in 2024. Gypsy Bot settings should be reviewed and adjusted at regular intervals (e.g., quarterly) to ensure the voting logic remains aligned with current market volatility.
Timeframe Recommendations:
Gypsy Bot is optimized for High Time Frame (HTF) trend following. It generally produces the most reliable results on charts ranging from 1-Hour to 12-Hours, with the 4-Hour timeframe historically serving as the "sweet spot" for most major cryptocurrency assets.
3. The Voting Mechanism: How Entries Are Generated
The heart of the Gypsy Bot engine is the ActivateOrders input (found in the "Order Signal Modifier" settings).
The engine constantly monitors the output of all enabled Modules.
Long Votes: GoLongCount
Short Votes: GoShortCount
If you have 10 Modules enabled, and you set ActivateOrders to 7:
The engine will ONLY trigger a Buy Entry if 7 or more modules return a valid "Buy" signal on the same closed candle.
If only 6 modules agree, the trade is rejected.
This allows you to mix "Leading" indicators (Oscillators) with "Lagging" indicators (Moving Averages) to create a high-probability entry signal that requires momentum, volume, and trend to all be in alignment.
4. Technical Deep Dive: The 12 Modules
Gypsy Bot allows you to toggle the following modules On/Off individually to suit the asset you are trading.
Module 1: Modified Slope Angle (MSA)
Logic: Calculates the geometric angle of a moving average relative to the timeline.
Function: It filters out "lazy" trends. A trend is only considered valid if the slope exceeds a specific steepness threshold. This helps avoid entering trades during weak drifts that often precede a reversal.
Module 2: Correlation Trend Indicator (CTI)
Logic: Based on John Ehlers' work, this measures how closely the current price action correlates to a straight line (a perfect trend).
Function: It outputs a confidence score (-1 to 1). Gypsy Bot uses this to ensure that we are not just moving up, but moving up with high statistical correlation, reducing fake-outs.
Module 3: Ehlers Roofing Filter
Logic: A sophisticated spectral filter that combines a High-Pass filter (to remove long-term drift) with a Super Smoother (to remove high-frequency noise).
Function: It attempts to isolate the "Roof" of the price action. It is excellent at catching cyclical turning points before standard moving averages react.
Module 4: Forecast Oscillator
Logic: Uses Linear Regression forecasting to predict where price "should" be relative to where it is.
Function: When the Forecast Oscillator crosses its zero line, it indicates that the regression trend has flipped. We offer both "Aggressive" and "Conservative" calculation modes for this module.
Module 5: Chandelier ATR Stop
Logic: A volatility-based trend follower that hangs a "leash" (ATR multiple) from the highest high (for longs) or lowest low (for shorts).
Function: Used here as an entry filter. If price is above the Chandelier line, the trend is Bullish. It also includes a "Bull/Bear Qualifier" check to ensure structural support.
Module 6: Crypto Market Breadth (CMB)
Logic: This is a macro-filter. It pulls data from multiple major tickers (BTC, ETH, and Perpetual Contracts) across different exchanges.
Function: It calculates a "Market Health" percentage. If Bitcoin is rising but the rest of the market is dumping, this module can veto a trade, ensuring you don't buy into a "fake" rally driven by a single asset.
Module 7: Directional Index Convergence (DIC)
Logic: Analyzes the convergence/divergence between Fast and Slow Directional Movement indices.
Function: Identifies when trend strength is expanding. A buy signal is generated only when the positive directional movement overpowers the negative movement with expanding momentum.
Module 8: Market Thrust Indicator (MTI)
Logic: A volume-weighted breadth indicator. It uses Advance/Decline data and Up/Down Volume data.
Function: This is one of the most powerful modules. It confirms that price movement is supported by actual volume flow. We recommend using the "SSMA" (Super Smoother) MA Type for the cleanest signals on the 4H chart.
Module 9: Simple Ichimoku Cloud
Logic: Traditional Japanese trend analysis using the Tenkan-sen and Kijun-sen.
Function: Checks for a "Kumo Breakout." Price must be fully above the Cloud (for longs) or below it (for shorts). This is a classic "trend confirmation" module.
Module 10: Simple Harmonic Oscillator
Logic: Analyzes the harmonic wave properties of price action to detect cyclical tops and bottoms.
Function: Serves as a counter-trend or early-reversal detector. It tries to identify when a cycle has bottomed out (for buys) or topped out (for sells) before the main trend indicators catch up.
Module 11: HSRS Compression / Super AO
Logic: Two options in one.
HSRS: Hirashima Sugita Resistance Support. Detects volatility compression (squeezes) relative to dynamic support/resistance bands.
Super AO: A combination of the Awesome Oscillator and SuperTrend logic.
Function: Great for catching explosive moves that result from periods of low volatility (consolidation).
Module 12: Fisher Transform (MTF)
Logic: Converts price data into a Gaussian normal distribution.
Function: Identifies extreme price deviations. This module uses Multi-Timeframe (MTF) logic to look at higher-timeframe trends (e.g., looking at the Daily Fisher while trading the 4H chart) to ensure you aren't trading against the major trend.
5. Global Inhibitors (The Veto Power)
Even if 12 out of 12 modules vote "Buy," Gypsy Bot performs a final safety check using Global Inhibitors. If any of these are triggered, the trade is blocked.
Bitcoin Halving Logic:
Hardcoded dates for past and projected future Bitcoin halvings (up to 2040).
Trading is inhibited or restricted during the chaotic weeks immediately surrounding a Halving event to avoid volatility crushes.
Miner Capitulation:
Uses Hash Rate Ribbons (Moving averages of Hash Rate).
If miners are capitulating (Shutting down rigs due to unprofitability), the engine flags a "Bearish" regime and can flip logic to Short-only or flat.
ADX Filter (Flat Market Protocol):
If the Average Directional Index (ADX) is below a specific threshold (e.g., 20), the market is deemed "Flat/Choppy." The bot will refuse to open trend-following trades in a flat market.
CryptoCap Trend:
Checks the total Crypto Market Cap chart. If the broad market is in a downtrend, it can inhibit Long entries on individual altcoins.
6. Risk Management & The Dump Protection Team (DPT)
Gypsy Bot separates "Entry Logic" from "Risk Management Logic."
Dump Protection Team (DPT)
This is a specialized logic branch designed to save the account during Black Swan events.
Nuke Protection: If the DPT detects a volatility signature consistent with a flash crash, it overrides all other logic and forces an immediate exit.
Moon Protection: If a parabolic pump is detected that violates statistical probability (Bollinger deviations), DPT can force a profit take before the inevitable correction.
Advanced Adaptive Trailing Stop (AATS)
Unlike a static trailing stop (e.g., "trail by 5%"), AATS is dynamic.
Penthouse Level: If price is at the top of the HSRS channel (High Volatility), the stop loosens to allow for wicks.
Dungeon Level: If price is compressed at the bottom, the stop tightens to protect capital.
Staged Take Profits
TP1: Scalp a portion (e.g., 10%) to cover fees and secure a win.
TP2: Take the bulk of profit.
TP3: Leave a "Runner" position with a loose trailing stop to catch "Moon" moves.
7. Recommended Setup Guide
When applying Gypsy Bot to a new chart, follow this sequence:
Set Timeframe: 4 Hours (4H).
Reset: Turn OFF Trailing Stop, Stop Loss, and Take Profits. (We want to see raw entry performance first).
Tune DPT: Adjust "Dump/Moon Protection" inputs first. These have the highest impact on net performance.
Tune Module 8 (MTI): This module is a heavy filter. Experiment with the MA Type (SSMA is recommended).
Select Modules: Enable/Disable modules 1-12 based on the asset's personality (Trending vs. Ranging).
Voting Threshold: Adjust ActivateOrders. A lower number = More Trades (Aggressive). A higher number = Fewer, higher conviction trades (Conservative).
Final Polish: Re-enable Stop Losses, Trailing Stops, and Staged Take Profits to smooth the equity curve and define your max risk per trade.
8. Technical Specs
Engine Version: Pine Script V6
Repainting: This strategy uses Closed Candle data for all Risk Management and Entry decisions. This ensures that Backtest results align closely with real-time behavior (no repainting of historical signals).
Alerts: This script generates Strategy alerts. If you require visual-only alerts, see the source code header for instructions on switching to "Study" (Indicator) mode.
Disclaimer:
This script is a complex algorithmic tool for market analysis. Past performance is not indicative of future results. Use this tool to assist your own decision-making, not to replace it.
9. About Signal Lynx
Automation for the Night-Shift Nation 🌙
Signal Lynx focuses on helping traders and developers bridge the gap between indicator logic and real-world automation. The same RM engine you see here powers multiple internal systems and templates, including other public scripts like the Super-AO Strategy with Advanced Risk Management.
We provide this code open source under the Mozilla Public License 2.0 (MPL-2.0) to:
Demonstrate how Adaptive Logic and structured Risk Management can outperform static, one-layer indicators
Give Pine Script users a battle-tested RM backbone they can reuse, remix, and extend
If you are looking to automate your TradingView strategies, route signals to exchanges, or simply want safer, smarter strategy structures, please keep Signal Lynx in your search.
License: Mozilla Public License 2.0 (Open Source).
If you make beneficial modifications, please consider releasing them back to the community so everyone can benefit.

Trilok saini EMA Pullback + MACD + ADX Strategy📌 HA Double EMA Pullback + MACD + ADX Strategy — Description
This strategy combines Heikin Ashi candles, Double EMA pullbacks, MACD momentum filtering, and ADX trend-strength confirmation to generate high-probability trend-continuation signals.
It is designed to avoid choppy markets and focus only on strong trending conditions.
🔥 Key Features
1️⃣ Heikin Ashi Trend Analysis
Heikin Ashi candles are calculated on the selected timeframe.
They smooth out market noise to highlight clear bullish or bearish trends.
Trend direction is displayed in a live info table.
2️⃣ Double EMA Pullback Logic
The main signal engine of this strategy:
Buy conditions
Price crosses above EMA 20
EMA 20 > EMA 50 (confirming uptrend)
A pullback is detected using the back-step (price was above EMA earlier)
MACD + ADX filters approve the trade
Sell conditions
Price crosses below EMA 20
EMA 20 < EMA 50 (confirming downtrend)
Pullback confirmation based on earlier price action
MACD + ADX filters approve the trade
This logic focuses on trend continuation instead of reversal setups.
3️⃣ MACD Momentum Filter
Buy signals appear only when MACD histogram is positive (green).
Sell signals appear only when MACD histogram is negative (red).
Prevents entries during weak or directionless momentum.
4️⃣ ADX Trend Strength Filter
Signals are blocked when ADX is below the selected threshold.
Ensures trades happen only in strong trending markets, reducing false signals.
5️⃣ Visual Enhancements
Clean Heikin Ashi candles with customizable colors
Optional regular candles for comparison
EMA overlays on HA candles
Buy/Sell labels with customizable text
Info table showing:
Trend direction
HA close
Regular close
EMA values
ADX reading
Active filters
🎯 Ideal Use Cases
Trend-following traders
Swing traders
Intraday traders who want filtered signals
Anyone wanting fewer false signals in sideways markets
⚠️ Disclaimer
This script is for educational and research purposes only.
Past performance does not guarantee future results. Always backtest and use proper risk management.

CDC BACKTEST (MACD) FIX AMOUNT $200k per trade This strategy implements an Exponential Moving Average (EMA) Crossover System designed for backtesting and performance evaluation. EMA 12,26 (MACD)
The trading logic is based on the crossover between two EMAs — a short-term EMA (12) and a long-term EMA (26) — which serves as a momentum-based signal for trend identification.
Buy Condition:
A long (buy) position is entered when the 12-period EMA crosses above the 26-period EMA, indicating a potential upward trend or bullish momentum.
Sell Condition:
A position is closed, or a short (sell) position is opened, when the 12-period EMA crosses below the 26-period EMA, signaling a potential downward trend or bearish momentum.
Position Sizing:
Each trade with a fixed position size of 200,000 USD (default), while the starting account balance is set at 400,000 (USD).
Both the fixed trade amount and the initial balance are user-adjustable parameters, allowing flexibility for different risk preferences and portfolio sizes.

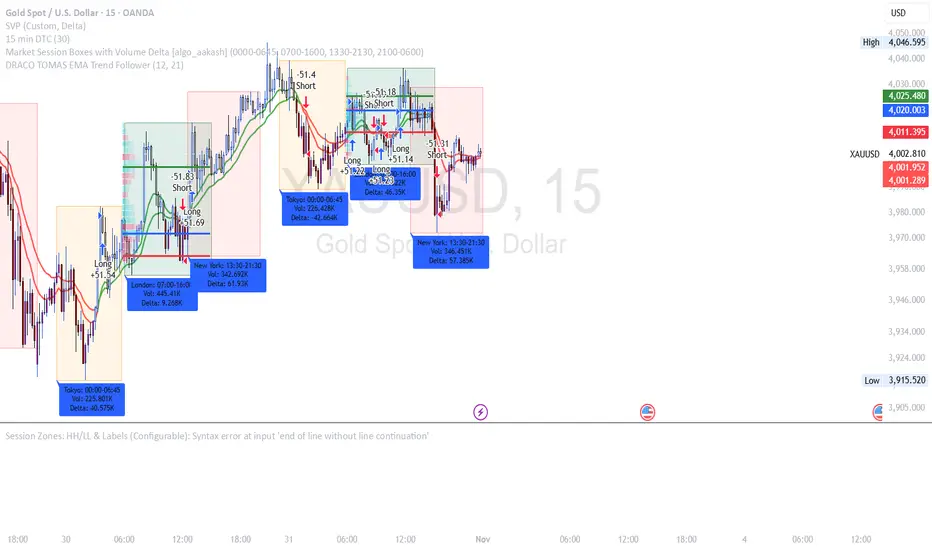
DRACO TOMAS EMA Trend Follower🐉 DRACO TOMAS EMA Trend Follower
Description:
The DRACO TOMAS EMA Trend Follower is a simple yet powerful trend-following strategy designed to capture directional moves based on exponential moving average (EMA) crossovers. It automatically detects trend changes and manages positions dynamically.
Core Logic:
The strategy uses two EMAs — a Fast EMA (default 12) and a Slow EMA (default 21) — to identify the market trend.
When the Fast EMA crosses above the Slow EMA, the strategy opens a long position, signaling bullish momentum.
When the Fast EMA crosses below the Slow EMA, the strategy opens a short position, signaling bearish momentum.
The color of the EMAs changes dynamically: green for uptrends, red for downtrends.
Exit rules:
Longs are closed when the EMAs turn red (trend reversal to bearish).
Shorts are closed when the EMAs turn green (trend reversal to bullish).
Position Sizing:
The system uses 10% of equity per trade by default, allowing flexible risk management and compounding.
Purpose:
Designed for traders who want a clean and efficient EMA crossover system to follow trends automatically on any timeframe or asset.
Best Used For:
Swing trading and trend confirmation
Identifying major directional shifts
Testing EMA-based momentum systems
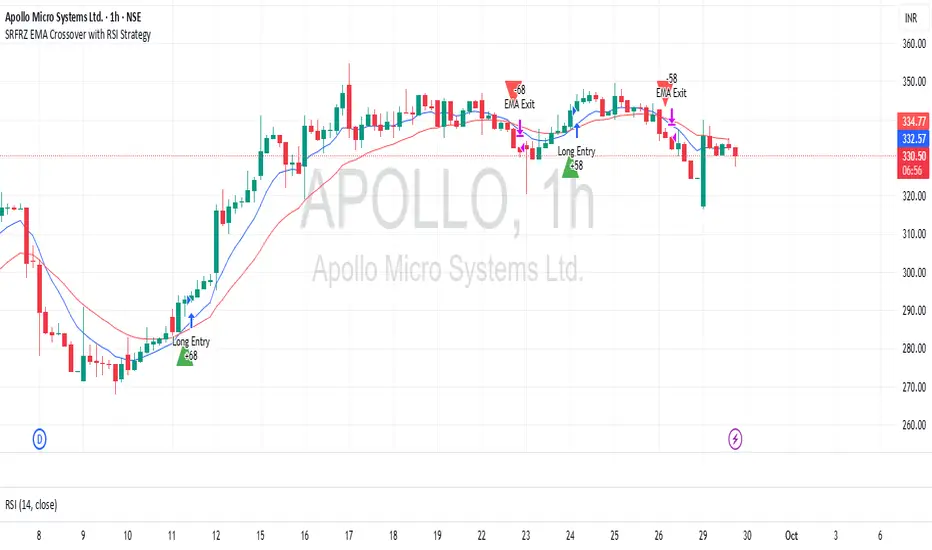
SRFRZ EMA Crossover with RSI StrategySRFRZ EMA Crossover with RSI Strategy
1. Overview
Strategy Name: SRFRZ EMA Crossover with RSI Strategy
Summary: A trend-following strategy designed for Indian stock and index markets, operating on any timeframe (optimized for 1H or 4H charts). It combines a 9-period and 21-period EMA crossover with RSI confirmation to identify high-probability long entries during the Indian trading session (9:15 AM–3:25 PM IST). Backtested with a fixed 20% capital allocation per trade, 3% stop loss, and 50% take profit, it aims for consistent returns in trending markets.
Intended Audience: Intermediate traders familiar with EMA and RSI, seeking automated signals for Indian markets.
2. How It Works (Core Logic)
Entry Conditions (Long/Buy Signal):
Primary Trigger: A "Golden Cross" occurs when the 9-period EMA crosses above the 21-period EMA, signaling bullish momentum.
RSI Confirmation: RSI (14-period) must be above 55, or cross above 55, to confirm strong momentum.
Trend Filter: The 9-period EMA must remain above the 21-period EMA for delayed RSI-triggered entries.
Session Filter: Trades are only executed during the Indian market session (9:15 AM–3:25 PM IST, Monday–Friday).
Exit Conditions:
Take Profit (TP): Fixed at 50% above the entry price (e.g., entry at ₹100, TP at ₹150).
Stop Loss (SL): Fixed at 3% below the entry price (e.g., entry at ₹100, SL at ₹97).
Indicator-Based Exit: Close the position if a "Death Cross" occurs (21-period EMA crosses above 9-period EMA).
Position Sizing: Allocates 20% of initial capital (₹100,000 default) per trade, calculated as (initial_capital * 0.20) / entry_price.
3. Key Indicators & Parameters
Primary Indicators:
EMA (9-period): Fast-moving average to capture short-term trends (plotted in blue).
EMA (21-period): Slower-moving average for trend confirmation (plotted in red).
RSI (14-period): Measures momentum, with a threshold of 55 for bullish confirmation (plotted in purple).
Customizable Settings in Pine Script:
initial_capital: Default ₹100,000 (adjust based on your account size).
qty_percent: Default 20% of capital per trade (adjust for risk tolerance).
sl_percent: Default 3% stop loss (adjust for volatility).
tp_percent: Default 50% take profit (adjust for reward targets).
session_time: Default "0915-1525:1234567" (Indian session, adjustable for other markets).
Default Values: Optimized for Indian stocks/indices (e.g., NIFTY 50) on 1H or 4H charts.
Risk Management:
Always use the built-in 3% stop loss.
Avoid trading during major news events (e.g., RBI announcements), as Pine Script cannot filter these.
Risk only 20% of capital per trade to diversify exposure.
Pro Tips:
Combine with support/resistance levels for manual confirmation.
Test on a demo account to validate performance on your chosen asset.
Monitor RSI for overbought conditions (>70) to anticipate reversals.
4. Visuals on Chart
Plotted Indicators:
Blue line: 9-period EMA.
Red line: 21-period EMA.
Purple line: RSI (14-period) in a separate pane.
Trade Signals:
Green triangle (below bar): Long entry.
Red triangle (above bar): Long exit (via TP, SL, or Death Cross).
5. Disclaimer & Notes
Risk Warning: Past performance is not indicative of future results. Trading involves significant risk. This strategy is for educational purposes only and is not financial advice.
Customization: The script is open-source (modify freely). Fork it to add short-selling logic or additional filters.
Note: The strategy avoids trades during non-session hours but cannot filter news events. Manually check economic calendars.
Add the script to your chart and adjust inputs (e.g., capital, TP/SL percentages).
Enable alerts for "Long Entry" and "Long Exit TP/SL" or "EMA Exit" to automate signals.
Optionally, connect to a broker via webhooks for auto-trading (consult your broker’s API).
KD The ScalperWe have to take the trade when all three EMAs are pointing in the same direction (no criss-cross, no up/down, sideways). All 3 EMAs should be cleanly separated from each other with strong spacing between them; they are not tangled, sideways, or messy. This is our first filter before entering the trade. Are the EMAs stacked neatly, and is the price outside of the 25 EMA? If price pulls back and closes near or below the 25 or 50 EMA and breaks the 100 EMA, we don't trade. Use the 100 EMA as a safety net and refrain from trading if the price touches or falls below the 100 EMA.
1. Confirm the trend- All 3 EMAs must align, and they must spread
2. Watch price pull back to the 25th or the 50 EMA
3. Wait for the price to bounce - And re-approach the 25 EMA
Why is this powerful?
Removes 80% of the low-probability Trades
It keeps you out of choppy markets
Avoids Reversal Traps
Anchors us to momentum
We take the entry when the price moves up again and touches the 25 EMA from below, and then when it breaks above the 25 EMA, or even better, when a lovely green bullish candle forms. A bullish candle indicates good momentum. When a bullish candle closes in green, it means the momentum has increased significantly. This is when we enter a long trade, with the stop-loss just below the 50 EMA and the profit target being 1.5 times the stop-loss.
The same rule applies to the bearish trade.

Trend Strength Index Long Strategy📈 Trend Strength Index Long Strategy
This strategy combines the Trend Strength Index (TSI) with a Volume-Weighted Moving Average (VWMA) to identify high-probability long entries based on trend momentum and price confirmation.
📊 TSI Calculation : Measures correlation between price and time (bar index) over a user-defined period. Strong TSI values indicate trend momentum.
📏 VWMA Filter : Confirms bullish bias when price is above the VWMA.
🚀 Entry Condition : Long position is triggered when TSI crosses above -0.65 and price is above VWMA.
🔒 Exit Condition : Position is closed when TSI crosses above 0.65.
🎨 Visuals : Gradient fills highlight bullish and bearish zones. VWMA is plotted for trend context.
🧮 TSI Length: Adjustable (default 14)
📐 VWMA Length: Adjustable (default 55)
💸 Commission: 0.1% per trade
📊 Position Size: 75% of equity
⚙️ Slippage: 10 ticks
✅ Best used in trending markets with steady momentum.
⚠️ Avoid in choppy or range-bound conditions.

ROPSON AI Ultra 3.27 How It Takes a Long (Buy) Position
The code will only enter a long position when two conditions are met simultaneously. Both must be true for a buy signal to be generated:
The current candle's close price crosses above the previous candle's high. This is the breakout signal. It indicates strong upward momentum.
The current candle's close price is above the 200 EMA. This is the trend filter. The 200 EMA (Exponential Moving Average) is a widely used indicator for long-term trend. If the price is above it, the market is considered to be in an uptrend.
By requiring both conditions, the strategy aims to enter trades that have both short-term momentum (the breakout) and long-term trend confirmation (the EMA filter).
How It Takes a Short (Sell) Position
Similarly, a short position is only entered when both of these conditions are true at the same time:
The current candle's close price crosses below the previous candle's low. This is the breakdown signal, indicating strong downward momentum.
The current candle's close price is below the 200 EMA. This confirms that the market is in a downtrend.

Ultimate Scalping Strategy v2Strategy Overview
This is a versatile scalping strategy designed primarily for low timeframes (like 1-min, 3-min, or 5-min charts). Its core logic is based on a classic EMA (Exponential Moving Average) crossover system, which is then filtered by the VWAP (Volume-Weighted Average Price) to confirm the trade's direction in alignment with the market's current intraday sentiment.
The strategy is highly customizable, allowing traders to add layers of confirmation, control trade direction, and manage exits with precision.
Core Strategy Logic
The strategy's entry signals are generated when two primary conditions are met simultaneously:
Momentum Shift (EMA Crossover): It looks for a crossover between a fast EMA (default length 9) and a slow EMA (default length 21).
Buy Signal: The fast EMA crosses above the slow EMA, indicating a potential shift to bullish momentum.
Sell Signal: The fast EMA crosses below the slow EMA, indicating a potential shift to bearish momentum.
Trend/Sentiment Filter (VWAP): The crossover signal is only considered valid if the price is on the "correct" side of the VWAP.
For a Buy Signal: The price must be trading above the VWAP. This confirms that, on average, buyers are in control for the day.
For a Sell Signal: The price must be trading below the VWAP. This confirms that sellers are generally in control.
Confirmation Filters (Optional)
To increase the reliability of the signals and reduce false entries, the strategy includes two optional confirmation filters:
Price Action Filter (Engulfing Candle): If enabled (Use Price Action), the entry signal is only valid if the crossover candle is also an "engulfing" candle.
A Bullish Engulfing candle is a large green candle that completely "engulfs" the body of the previous smaller red candle, signaling strong buying pressure.
A Bearish Engulfing candle is a large red candle that engulfs the previous smaller green candle, signaling strong selling pressure.
Volume Filter (Volume Spike): If enabled (Use Volume Confirmation), the entry signal must be accompanied by a surge in volume. This is confirmed if the volume of the entry candle is greater than its recent moving average (default 20 periods). This ensures the move has strong participation behind it.
Exit Strategy
A position can be closed in one of three ways, creating a comprehensive exit plan:
Stop Loss (SL): A fixed stop loss is set at a level determined by a multiple of the Average True Range (ATR). For example, a 1.5 multiplier places the stop 1.5 times the current ATR value away from the entry price. This makes the stop dynamic, adapting to market volatility.
Take Profit (TP): A fixed take profit is also set using an ATR multiplier. By setting the TP multiplier higher than the SL multiplier (e.g., 2.0 for TP vs. 1.5 for SL), the strategy aims for a positive risk-to-reward ratio on each trade.
Exit on Opposite Signal (Reversal): If enabled, an open position will be closed automatically if a valid entry signal in the opposite direction appears. For example, if you are in a long trade and a valid short signal occurs, the strategy will exit the long position immediately. This feature turns the strategy into more of a reversal system.
Key Features & Customization
Trade Direction Control: You can enable or disable long and short trades independently using the Allow Longs and Allow Shorts toggles. This is useful for trading in harmony with a higher-timeframe trend (e.g., only allowing longs in a bull market).
Visual Plots: The strategy plots the Fast EMA, Slow EMA, and VWAP on the chart for easy visualization of the setup. It also plots up/down arrows to mark where valid buy and sell signals occurred.
Dynamic SL/TP Line Plotting: A standout feature is that the strategy automatically draws the exact Stop Loss and Take Profit price lines on the chart for every active trade. These lines appear when a trade is entered and disappear as soon as it is closed, providing a clear visual of your risk and reward targets.
Alerts: The script includes built-in alertcondition calls. This allows you to create alerts in TradingView that can notify you on your phone or execute trades automatically via a webhook when a long or short signal is generated.

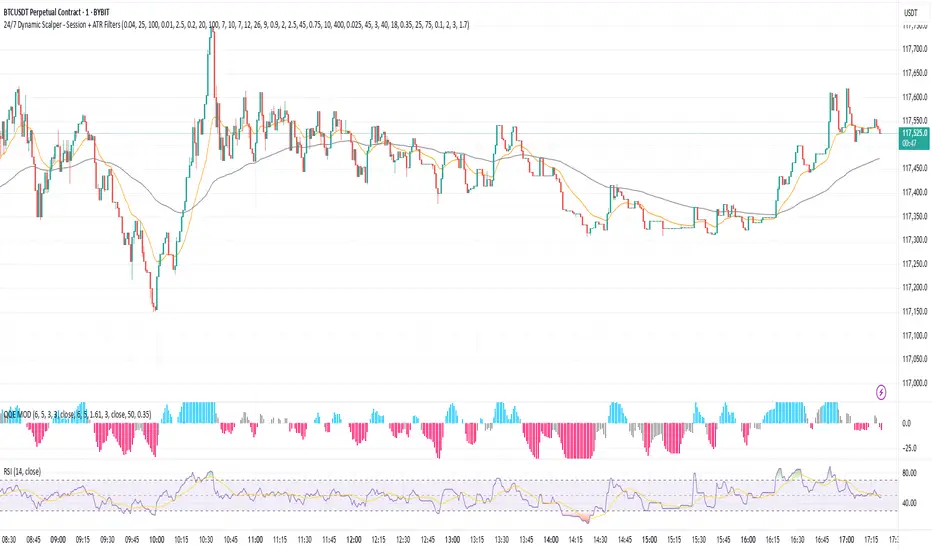
24/7 Dynamic Scalper - Session + ATR Filters24/7 Dynamic Scalper — Session + ATR Filters
The only scalping strategy you’ll need for non-stop, high-precision trading — engineered for automation and hands-off profits!
Session Filtering: Trade only during the hottest market hours (Asia Open & EU Session) — fully automatic.
ATR Stability & Dynamic Risk: Filters out chop and volatility spikes for cleaner, higher-probability entries.
Momentum & Exhaustion Protection: Built-in RSI & MACD logic blocks overbought/oversold traps and weak signals.
Time-in-Trade Auto-Exit: No more stale trades — get capped exposure for every position.
Auto Alerts: Sends structured, ready-to-automate alerts (BUY/SELL/EXIT) — perfect for webhook and bot traders.
Optional Volume/TP Filters: Toggle volume spikes, dynamic ATR-based TP, and even “big candle” protection.
Fully Customizable: Fine-tune everything from leverage to max stop loss (in USDT), bar/range filters, and much more.
Best for: Fast scalpers, algo traders, automation junkies, and anyone who wants a robust, hands-off approach to perpetual futures.
👇 How it Works (Feature Breakdown):
Session Filters: Restricts signals to the highest liquidity hours (Asia/EU), or trade 24/7 — your choice!
ATR + Range Filters: Ensures every entry has real volatility and avoids dangerous chop.
Momentum Logic: Combines EMA, MACD slope, and RSI direction to hunt for real breakouts only.
Exhaustion Safeguards: Avoids classic scalp reversals by blocking overbought/oversold and exhausted MACD/RSI momentum.
Drawdown Defense: Detects “big candle” traps, ATR surges, and lets you cap stop-loss by percent or by max USDT.
Hands-Off Management: All exits (TP/SL/trailing) are managed by your backend/bot via structured alerts — the script keeps charts clean and exits only by time cap (so no backend/strategy overlap).
Ready for Webhook Automation: Clean JSON alerts for BUY, SELL, and CLOSE — drop them straight into your bot for instant auto-trading.
No repaint, no nonsense — just cold, fast, high-frequency scalping with robust, smart filters.
🚀 Plug, Play, Automate.
Copy to your chart, tweak your session/ATR/settings, and wire up your alert to your favorite webhook bot.
Perfect for Bybit, MEXC, Binance, and anywhere you can automate.
Options Strategy V1.3📈 Options Strategy V1.3 — EMA Crossover + RSI + ATR + Opening Range
Overview:
This strategy is designed for short-term directional trades on large-cap stocks or ETFs, especially when trading options. It combines classic trend-following signals with momentum confirmation, volatility-based risk management, and session timing filters to help identify high-probability entries with predefined stop-loss and profit targets.
🔍 Strategy Components:
EMA Crossover (Fast/Slow)
Entry signals are triggered by the crossover of a short EMA above or below a long EMA — a traditional trend-following method to detect shifts in momentum.
RSI Filter
RSI confirms the signal by avoiding entries in overbought/oversold zones unless certain momentum conditions are met.
Long entry requires RSI ≥ Long Threshold
Short entry requires RSI ≤ Short Threshold
ATR-Based SL & TP
Stop-loss is set dynamically as a multiple of ATR below (long) or above (short) the entry price.
Take-profit is placed as a ratio (TP/SL) of the stop distance, ensuring consistent reward/risk structure.
Opening Range Filter (Optional)
If enabled, the strategy only triggers trades after price breaks out of the 09:30–09:45 EST range, ensuring participation in directional moves.
Session Filters
No trades from 04:00 to 09:30 and from 16:00 to 20:00 EST, avoiding low-liquidity periods.
All open trades are closed at 15:55 EST, to avoid overnight risk or expiration issues for options.
⚙️ Built-in Presets:
You can choose one of the built-in ticker-specific presets for optimal conditions:
Ticker EMAs RSI (Long/Short) ATR SL×ATR TP/SL
SPY 8/28 56 / 26 14 1.4× 4.0×
TSLA 23/27 56 / 33 13 1.4× 3.6×
AAPL 6/13 61 / 26 23 1.4× 2.1×
MSFT 25/32 54 / 26 14 1.2× 2.2×
META 25/32 53 / 26 17 1.8× 2.3×
AMZN 28/32 55 / 25 16 1.8× 2.3×
You can also choose "Custom" to fully configure all parameters to your own market and strategy preferences.
📌 Best Use Case:
This strategy is especially suited for intraday options trading, where timing and risk control are critical. It works best on liquid tickers with strong trends or clear breakout behavior.

RCI Strategy [PineIndicators]RCI Strategy
This strategy leverages the Rank Correlation Index (RCI) — a statistical oscillator that measures the relationship between time and price rank — combined with a configurable moving average filter. It offers clean, rule-based entries and exits, and visually enhanced trade tracking via labeled markers and boxes on the chart.
The RCI Strategy is well-suited for momentum traders looking to capture directional shifts with confirmation through RCI smoothing.
Core Logic
1. Rank Correlation Index (RCI)
Measures how closely price changes correlate with time rankings.
Values range between -100 and +100.
Thresholds at ±80 help identify potential reversals or extremes.
2. RCI Smoothing via Moving Average
A moving average (MA) is applied to the RCI to smooth out fluctuations.
Supported MA types:
SMA
EMA
SMMA (RMA)
WMA
VWMA
Users can disable the smoothing by selecting "None".
Trade Entry Logic
Long Entry: RCI crosses above the selected moving average.
Short Entry: RCI crosses below the moving average.
Entries are restricted by trade direction settings:
Long Only
Short Only
Long & Short
Visual Features
RCI Panel Display
Plots RCI line and its moving average in a separate pane.
Horizontal guide lines at 0, +80, and -80 help visualize signal zones.
Trade Labels on Chart
Buy Label: Plotted when a long entry is executed.
Close Label: Plotted when any position is closed.
Triangle markers for visual emphasis on direction change.
Trade Visualization Boxes
A colored box is drawn between entry and exit prices.
Green = profitable trade; Red = losing trade.
Two horizontal lines connect entry and exit prices for reference.
Customization Parameters
RCI Source: Select input price for the RCI (default: close).
RCI Length: Set sensitivity of the oscillator.
MA Type and Length: Choose and configure the smoothing filter.
Trade Direction Mode: Define whether to allow Long, Short, or both.
Use Cases
Swing traders who want to trade directional reversals with statistical backing.
Traders seeking a clean and visual strategy based on rank momentum.
Environments where both trend and range dynamics occur.
Conclusion
The RCI Strategy is a non-repainting, rule-based trading model that combines rank correlation momentum with smoothed trend logic. Its clean visual markers, labeled trades, and flexible MA filters make it a valuable tool for discretionary and systematic traders alike.

SwingTrade VWAP Strategy[TiamatCrypto]V1.1This Pine Script® code creates a trading strategy called "SwingTrade VWAP Strategy V1.1." This strategy incorporates various trading tools, such as VWAP (Volume Weighted Average Price), ADX (Average Directional Index), and volume signals. Below is an explanation of the components and logic within the script:
### Overview of Features
- **VWAP:** A volume-weighted moving average that assesses price trends relative to the VWAP level.
- **ADX:** A trend strength indicator that helps confirm the strength of bullish or bearish trends.
- **Volume Analysis:** Leverages volume data to gauge momentum and identify volume-weighted buy/sell conditions.
- **Dynamic Entry/Exit Signals:** Combines the above indicators to produce actionable buy/sell or exit signals.
- **Customizable Inputs:** Inputs for tuning parameters like VWAP period, ADX thresholds, and volume sensitivity.
---
### **Code Breakdown**
#### **Input Parameters**
The script begins by defining several user-configurable variables under groups. These include indicators' on/off switches (`showVWAP`, `enableADX`, `enableVolume`) and input parameters for VWAP, ADX thresholds, and volume sensitivity:
- **VWAP Period and Threshold:** Controls sensitivity for VWAP signal generation.
- **ADX Settings:** Allows users to configure the ADX period and strength threshold.
- **Volume Ratio:** Detects bullish/bearish conditions based on relative volume patterns.
---
#### **VWAP Calculation**
The script calculates VWAP using the formula:
\
Where `P` is the typical price (`(high + low + close)/3`) and `V` is the volume.
- It resets cumulative values (`sumPV` and `sumV`) at the start of each day.
- Delta percentage (`deltaPercent`) is calculated as the percentage difference between the close price and the VWAP.
---
#### **Indicators and Signals**
1. **VWAP Trend Signals:**
- Identifies bullish/bearish conditions based on price movement (`aboveVWAP`, `belowVWAP`) and whether the price is crossing the VWAP level (`crossingUp`, `crossingDown`).
- Also detects rising/falling delta changes based on the VWAP threshold.
2. **ADX Calculation:**
- Calculates the directional movement (`PlusDM`, `MinusDM`) and smoothed values for `PlusDI`, `MinusDI`, and `ADX`.
- Confirms strong bullish/bearish trends when ADX crosses the defined threshold.
3. **Volume-Based Signals:**
- Evaluates the ratio of bullish volume (when `close > VWAP`) to bearish volume (when `close < VWAP`) over a specified lookback period.
---
#### **Trade Signals**
The buy and sell signals are determined by combining conditions from the VWAP, ADX, and volume signals:
- **Buy Signal:** Triggered when price upward crossover VWAP, delta rises above the threshold, ADX indicates a strong bullish trend, and volume confirms bullish momentum.
- **Sell Signal:** Triggered under inverse conditions.
- Additionally, exit conditions (`exitLong` and `exitShort`) are based on VWAP crossovers combined with the reversal of delta values.
---
#### **Plotting and Display**
The strategy plots VWAP on the chart and adds signal markers for:
- **Buy/Long Entry:** Green triangle below bars.
- **Sell/Short Entry:** Red triangle above bars.
- **Exit Signals:** Lime or orange "X" shapes for exits from long/short positions.
- Additionally, optional text labels are displayed to indicate the type of signal.
---
#### **Trading Logic**
The script's trading logic executes as follows:
- **Entries:**
- Executes long trades when the `buySignal` condition is true.
- Executes short trades when the `sellSignal` condition is true.
- **Exits:**
- Closes long positions upon `exitLong` conditions.
- Closes short positions upon `exitShort` conditions.
- The strategy calculates profits and visualizes the trade entry, exit, and running profit within the chart.
---
#### **Alerts**
Alerts are set up to notify traders via custom signals for buy and sell trades.
---
### **Use Case**
This script is suitable for day traders, swing traders, or algorithmic traders who rely on confluence signals from VWAP, ADX, and volume momentum. Its modular structure (e.g., the ability to enable/disable specific indicators) makes it highly customizable for various trading styles and financial instruments.
#### **Customizability**
- Adjust VWAP, ADX, and volume sensitivity levels to fit unique market conditions or asset classes.
- Turn off specific criteria to focus only on VWAP or ADX signals if desired.
#### **Caution**
As with all trading strategies, this script should be used for backtesting and analysis before live implementation. It's essential to validate its performance on historical data while considering factors like slippage and transaction costs.

30-70 RSI Strategy with Colored BarThis script colors price bars based on Relative Strength Index (RSI) levels, giving traders a quick and visual way to assess overbought or oversold market conditions directly on the chart.
📈 Key Features:
✅ RSI-Based Bar Coloring:
Green bars when RSI is above the upper threshold (default 70) – suggests bullish momentum.
Red bars when RSI is below the lower threshold (default 30) – indicates bearish pressure.
Bars remain uncolored when RSI is between thresholds – a neutral zone.
🔧 Customizable RSI Settings:
Adjustable RSI length (default: 14 periods)
Adjustable overbought/oversold levels (default: 70/30)
🧠 Helps traders:
Quickly spot potential reversals or trend continuations
Visually align price action with momentum
🛠️ Usage:
Ideal for trend-following, reversal, and momentum strategies.
Works across any timeframe (1m, 5m, 1h, daily, etc.).

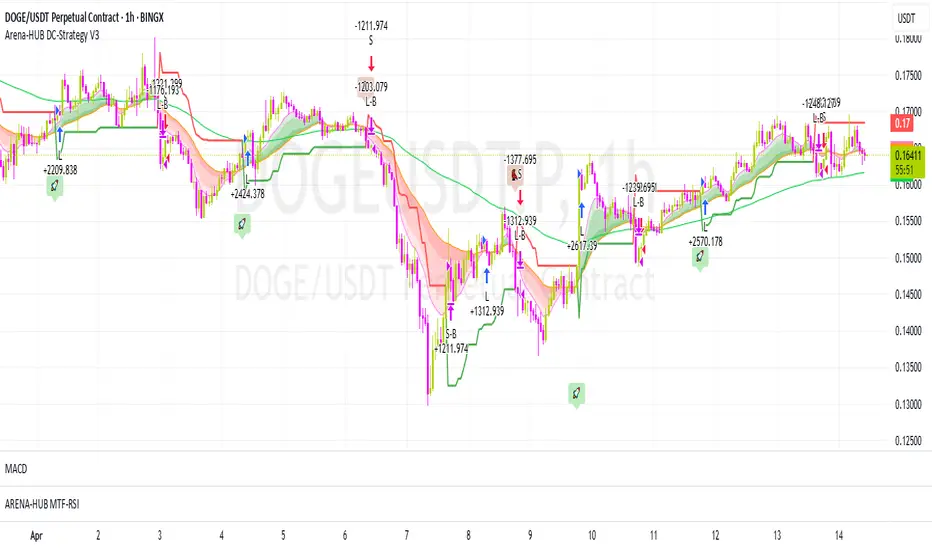
Arena-Hub-DC-Strategy V3.1This script must be individually configured for each cryptocurrency. After monitoring several coins, I’ve realized that each one requires its own unique setup. There's no “one-size-fits-all” — and different timeframes require different configurations as well.
⚠️ Risk management is essential.
If you're not familiar with proper risk management, please do not use this script. Make sure to configure your commission and slippage settings appropriately, as these are critical for realistic backtesting results. The Stop Loss and Take Profit levels are not automated — they must be adjusted by the user.
This script is not a financial advisor. It won't make risk or profit-related decisions for you. It's a tool designed to help identify potential entries, trends, and exit opportunities — but all final decisions must be made by the trader.
The default settings are only examples. You’ll need to customize them for each crypto asset and timeframe to make the strategy truly work for your style and market conditions.
The script evaluates:
The positioning of two RSIs relative to each other
Their alignment with a customizable RSI-EMA
The values of EMAs and the ATR (volatility)
A custom weighting system using ADR and VOLUME, which strongly affects trade signals. The weights can be adjusted in 0.1 increments, and even small changes can have a big impact — so fine-tuning is important!
These indicators were chosen because they complement each other:
RSI and its EMA help identify momentum shifts
ATR gauges volatility to confirm market conditions
ADR and VOLUME help filter weak signals and fine-tune entries and exits
🔍 Important: Only use this script if you understand how RSI, EMA, ATR, ADR, and VOLUME indicators work, and are comfortable making your own trading decisions.
The backtest results are based on historical data — the script cannot see the future, not even guess it. Please use it responsibly.
This script is an advanced trend-following strategy that dynamically combines RSI, SMA, EMA, ATR, ADX, and volume indicators using a unique weighting and filtering mechanism. Instead of simply combining traditional indicators, it applies them in a unique way:
✅ Dual RSI Comparison: The strategy utilizes two RSI indicators, analyzing their relative movement to filter out false signals and provide more precise entry points.
✅ Custom Entry and Exit Rules: EMA crossovers alone do not generate signals; instead, they go through a dynamic RSI filter that takes market volatility into account using ATR and ADX.
✅ Intelligent Trend Identification: Instead of standard moving averages, a uniquely weighted SMA/EMA system is used to assess trend strength and stability.
✅ ATR, ADX & Volume-Based Weighting: The EMA length is dynamically adjusted based on ATR, ADX, and volume, allowing moving averages to react faster in strong trends while smoothing out in choppy markets.
Advanced Dynamic EMA Zone
This is not your typical EMA indicator. It's an enhanced, dynamically adaptive trend zone that:
✅ Applies gradient shading – The zone between EMAs is divided into four layers, highlighting trend strength through smooth color transitions.
✅ Visualizes trend intensity – The strongest trends appear in the darkest shades, while weaker moves fade into lighter tones.
✅ Brings moving averages to life – Instead of static lines, it creates a visually intuitive trend channel.
✅ Differentiates bullish & bearish phases – The cloud fades from dark green to light green during an uptrend and from dark red to light red in a downtrend.
✅ Filters out market noise – Weakening trends appear more transparent, instantly revealing when momentum starts to fade.
✅ Enhances decision-making – Crossovers alone are not trading signals, but the visual representation helps identify market conditions at a glance.
➡️ What makes it unique?
Traditional moving average indicators rely on basic lines, but this is a full-fledged trend visualization system, helping traders filter noise and better understand price momentum.
🔄 Improved Custom EMA Smoothing Control
We’ve enhanced the weighting factor input for better user control! Previously, the EMA smoothing factor (ema1_smooth_factor) had a fixed step size that limited precision. Now, users can fine-tune it in 0.1 increments for greater flexibility.
✅ What’s new?
More precise control over EMA smoothing with adjustable step size (step=0.1).
Better adaptability to different market conditions.
Smoother trend visualization for traders who prefer fine-tuned settings.
This update ensures our custom EMA visualization remains superior to standard indicators. 🎯🔥