DSL Synthetic MomentumThis indicator combines 5 running moving averages of different periods, calculate their momentum and synthesize the result into 1 single curve.
Dynamic levels made of the discontinued signal lines function are added to create pseudo overbought and oversold levels.
Search in scripts for "momentum"

Chande Momentum OscillatorChande Momentum Oscillator script.
This indicator was developed and described by Tushar S. Chande and Stanley Kroll in their book "The New Technical Trader" (1994, Chapter 5: New Momentum Oscillators).

Missile RSI (RSI of momentum w/ Dominant Cycle length + Fisher)This is a predictive indicator that looks for explosions in momentum of the cycles in price and large shifts in Momentum (Fisher turns the Bimodal PDF into Guassian like) as statistically unlikely events, showing points to exit or reverse positions.
You can adjust the lowpass frequency cuttoff (Aka what cycles you want to remove from the calculations through the super smoother filter).
To be honest you can monkey trade the direction of the Signal if you'd like but the Divergences and Maxing of the values is whats most useful.
Let me know if you guys want me to add anything else.

Mean Reversion and Momentum - Updated with gaussiana smoothingMean Reversion and Momentum
Interpretation:
- Divergence means trend reversal
- Parallel movement means trend continuation
Squares above serve as a confirming signal

Mean Reversion and Momentum - Indicator versionMean Reversion and Momentum
Interpretation:
- Divergence means trend reversal
- Parallel movement means trend continuation
Squares above serve as a confirming signal
Stoch Momentum Index* Original code from UCSgears.
* Added circles for when Stoch MI and signal line crosses.

Grimes Modified MACD + Highest / Lowest Momentum IndicatorModified MACD without histogram, using SMA instead of EMA and a higher and lower band to make it easy to compare the current momentum push to the last momentum push.
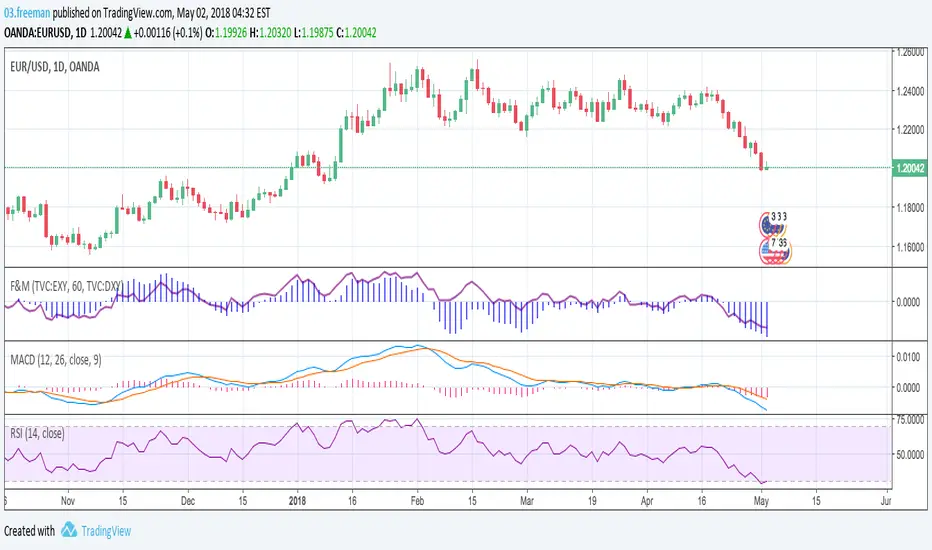
Strenght and MomentumThe scope of this script is to measure momentum and strenght of EURO and DOLLAR using their indexes.
Forza (line) above 0 means EURO is stonger than DOLLAR
Momento (histogram) above 0 means EURO has a positive momentum against DOLLAR
The added value to see MACD and RSI directly on EURUSD chart is that indexes consider also other pairs so their RSI and MACD has a larger view on forex markets.
Script has also an option for multi timeframes.
I think that could be used as filters for LONG or SHORT positions in lower time frames.
Tick Line Momentum OscillatorTick Line Momentum Oscillator indicator script. This indicator was originally developed by Daniel E. Downing (Stocks & Commodities, V.12:1 (42-44): Using The Tick In A Short-Term Indicator).


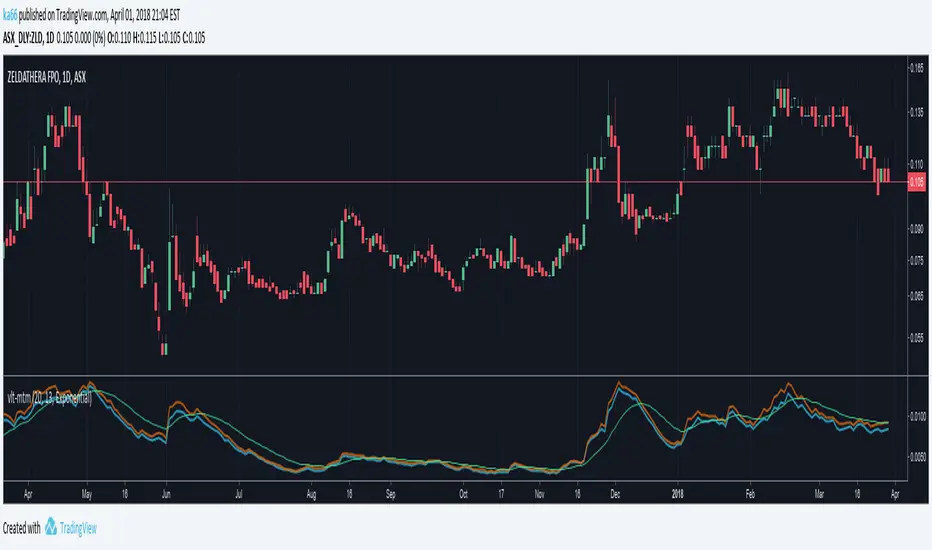
ka66: Volatility MomentumThis is a 'monitoring' indicator to see if an instrument is viable enough to be traded, by virtue of volatility (or lack of volatility in context may lead to a break out), or may become so. It shows the following information:
Price Range (high - low) averaged across a set of bars: Useful gauging potential trading profits. This was its initial goal, to not measure bars manually!
ATR : As a comparison point for the price range above. Divergence between true range (TR) and plain price range might signal volatility changes occurring in the instrument.
Signal volatility line : a moving average of the larger of the average price range and ATR. This takes inspiration from other indicators like MACD and Stochastic, and is a way of comparing change in recent volatility --- this achieves the momentum part. The larger was chosen to keep things simple, and not have a signal line per range!
avgRange = movingAvg(high - low, avgPeriod)
atr = movingAvg(trueRange, avgPeriod)
signal = movingAvg(max(avgRange, atr), avgPeriod)
Configurable periods and averaging mechanism.


Double RSI Momentum2 RSI , one is 14 period and the second 5 period (adjustable). The Momentum is the difference of the 2 rsi. It s moves around the zero line, and when there is a peak out , inversion should come soon. You can adjuste the lower and upper bands.

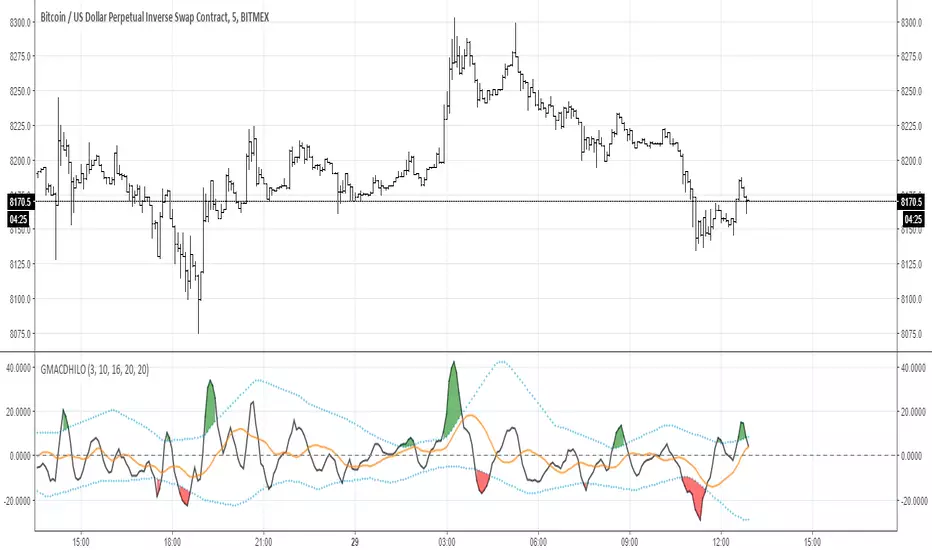
Squeeze Momentum Indicator [LazyBear] Version2 by KıvanÇ fr3762Modified version of Squeeze Momentum Indicator including line graph of the main indicator instead of using a Histogram and a second Signal line (5 bars SMA of the original line) to provide visual BUY/SELL signals
BUY when Blue crosses ABOVE the RED signal line
SELL when Blue crosses BELOW the RED signal line
author: LazyBear
modified by: KıvanÇ @fr3762 on twitter (tweets are only in TURKISH)
TURKISH EXPLANATION:
Orijinal indikatördeki histogram yerine çizgi grafiği alınarak bu grafiğin 5 barlık basit hareketli ortalaması sinyal çizgisi olarak eklendi.
Al Koşulu: Mavi çizginin Kırmızıyı yukarı kesmesi
Sat koşulu: Kırmızı çizginin Maviyi yukarı kesmesi

Inverse Fisher Transform on SMI (Stochastic Momentum Index)Inverse Fisher Transform on SMI (Stochastic Momentum Index)
About John EHLERS:
From California, USA, John is a veteran trader. With 35 years trading experience he has seen it all. John has an engineering background that led to his technical approach to trading ignoring fundamental analysis (with one important exception).
John strongly believes in cycles. He’d rather exit a trade when the cycle ends or a new one starts. He uses the MESA principle to make predictions about cycles in the market and trades one hundred percent automatically.
In the show John reveals:
• What is more appropriate than trading individual stocks
• The one thing he relies upon in his approach to the market
• The detail surrounding his unique trading style
• What important thing underpins the market and gives every trader an edge
About INVERSE FISHER TRANSFORM:
The purpose of technical indicators is to help with your timing decisions to buy or
sell. Hopefully, the signals are clear and unequivocal. However, more often than
not your decision to pull the trigger is accompanied by crossing your fingers.
Even if you have placed only a few trades you know the drill.
In this article I will show you a way to make your oscillator-type indicators make
clear black-or-white indication of the time to buy or sell. I will do this by using the
Inverse Fisher Transform to alter the Probability Distribution Function (PDF) of
your indicators. In the past12 I have noted that the PDF of price and indicators do
not have a Gaussian, or Normal, probability distribution. A Gaussian PDF is the
familiar bell-shaped curve where the long “tails” mean that wide deviations from
the mean occur with relatively low probability. The Fisher Transform can be
applied to almost any normalized data set to make the resulting PDF nearly
Gaussian, with the result that the turning points are sharply peaked and easy to
identify. The Fisher Transform is defined by the equation
1)
Whereas the Fisher Transform is expansive, the Inverse Fisher Transform is
compressive. The Inverse Fisher Transform is found by solving equation 1 for x
in terms of y. The Inverse Fisher Transform is:
2)
The transfer response of the Inverse Fisher Transform is shown in Figure 1. If
the input falls between –0.5 and +0.5, the output is nearly the same as the input.
For larger absolute values (say, larger than 2), the output is compressed to be no
larger than unity. The result of using the Inverse Fisher Transform is that the
output has a very high probability of being either +1 or –1. This bipolar
probability distribution makes the Inverse Fisher Transform ideal for generating
an indicator that provides clear buy and sell signals.

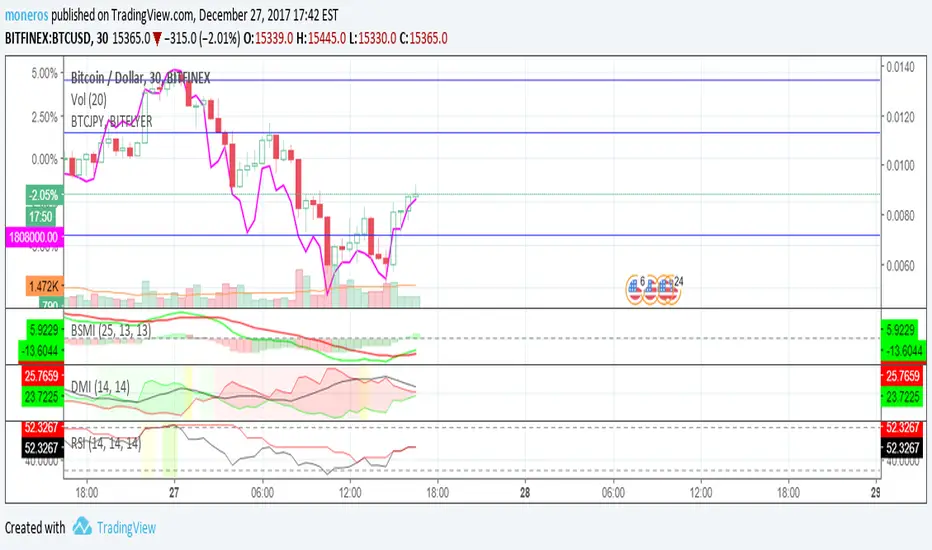
Bitcoin Momentum TSIChart based on True Strength Indicator
It was improved to show same information as Squeeze Momentum Indicator by LazyBear,
but it seems to have better and quicker response to changes and was tested on Bitcoin mainly.
Enjoy it!
BITFINEX:BTCUSD
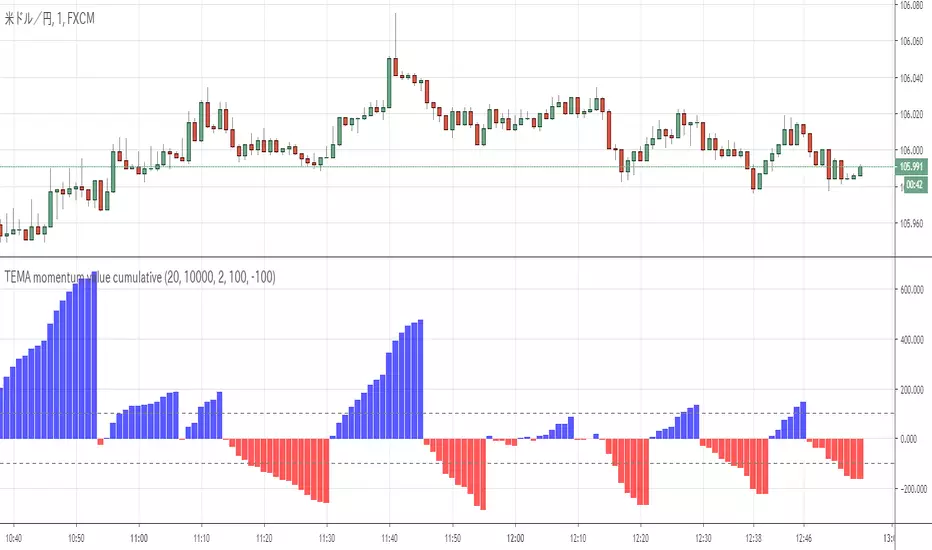
TEMA momentum value cumulativeTEMA momentum value cumulative
This indicator is show trend strong and change trend.
MT4 backtest EURUSD H1/M15 (japanese article)
mt4program.blogspot.jp
mt4program.blogspot.jp
mt4program.blogspot.jp
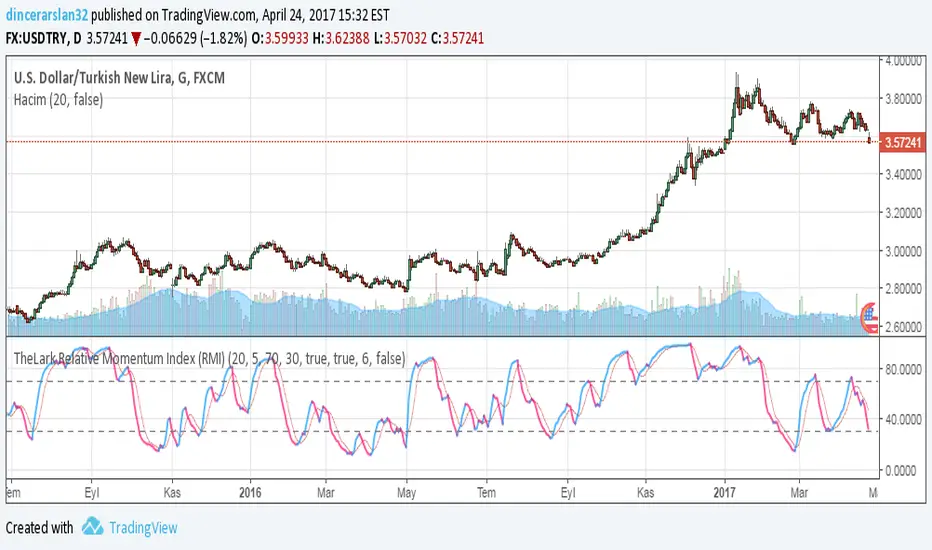
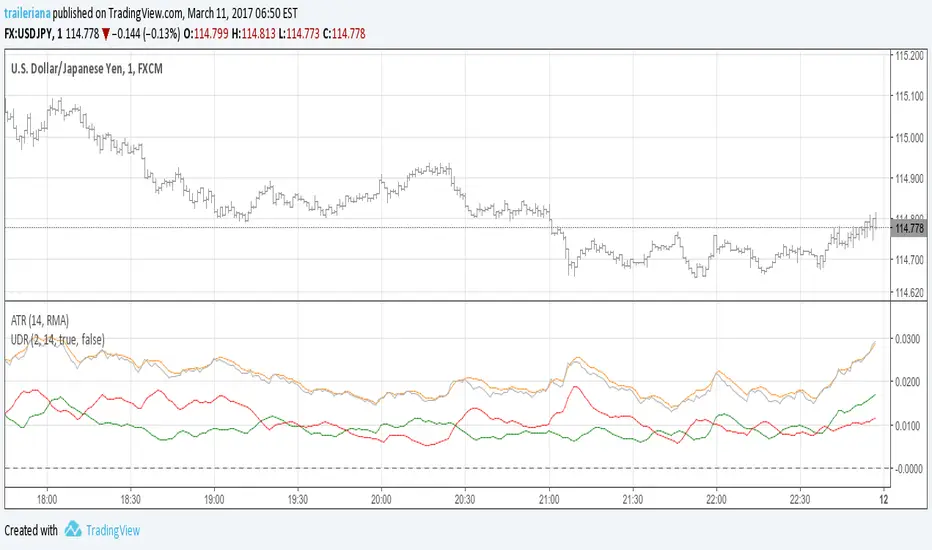
Up/Down RangeMeasuring the difference between the highs and lows from the average, this measure can serve as a proxy for the volatility, just like the ATR.
However, it breaks the range into an upward and a downward moving component, so it also gives information about the current trend direction.
In fact, I turned it into a momentum indicator here:
Stochastic Momentum IndexStochastic Momentum Index
William Blau "Momentum, Direction, and Divergence",
John Wiley and Sons, Inc. 1995, ISBN 0-471-02729-4, page 29:
SM(q) = close - 0.5*(HH(q) + LL(q))
SMI(q, r, s) = 100*(EMA(EMA(SM(q), r)), s)/(0.5*EMA(EMA(HH(q)-LL(q)), r), s)

UCS Squeeze Momentum Overlay with AlertsAll credit to the great ucsgears. His original indicator is on this page:
I just remixed the visuals and added alerts when price is released from the squeeze. I find it works well on lower timeframes for Forex and Bitcoin. Suggestions for other instruments and timeframes are welcome! When adding alerts use 'On Condition' to get the fastest alerts.
Best used in conjunction with the USC_SQZ_Opt Ooscillator from this page:
Possibly useful tip: the squeeze code here is great for identifying ranging markets, and can be used with other indicators to stop alerts firing in choppy markets.

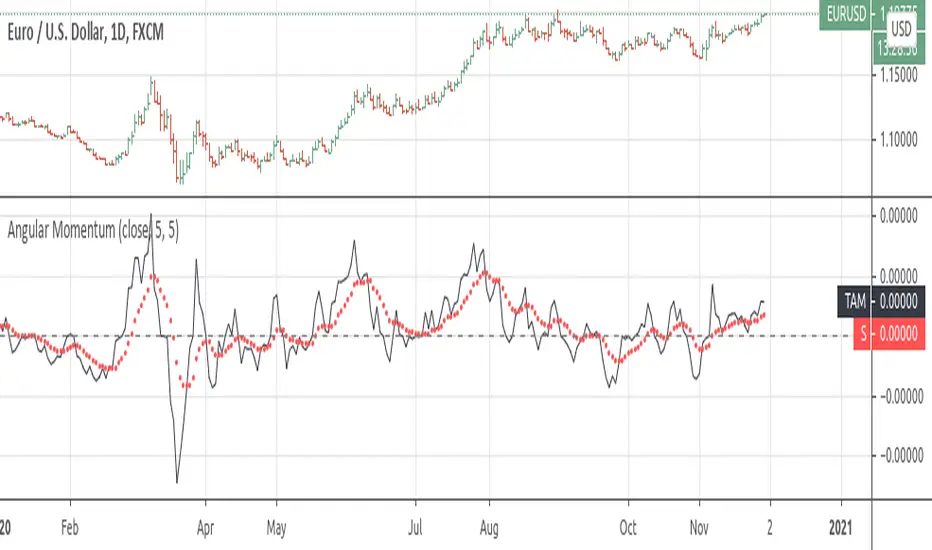
Angular MomentumEXPERIMENTAL:
Returns a smoothed non lagging(peaks are convergent time wise) angular motion.