Third-order moment by TonymontanovThe "Third-order moment" indicator is designed to help traders identify asymmetries and potential turning points in a financial instrument's price distribution over a specified period. By calculating the skewness of the price distribution, this indicator provides insights into the potential future movement direction of the market.
User Parameters:
- Length: This parameter defines the number of bars (or periods) used to compute the mean and third-order moment. A longer length provides a broader historical context, which may smooth out short-term volatility.
- Source: The data input for calculations, defaulting to the closing price of each bar, although users can select alternatives like open, high, low, or any custom value to suit their analysis preferences.
Operational Algorithm:
1. Mean Calculation:
- The indicator begins by calculating the arithmetic mean of the selected data source over the specified period.
2. Third-order Moment Calculation:
- A deviation from the mean is calculated for each data point. These deviations are then cubed to capture any asymmetry in the price distribution.
- The third-order moment is determined by summing these cubed deviations over the specified length and dividing by the number of periods, providing a measure of skewness.
3. Graphical Representation:
- The indicator plots the third-order moment as a column plot. The color of the columns changes based on the sign of the moment: green for positive and red for negative, suggesting bullish and bearish skewness, respectively.
- A zero line is included to help visualize transitions between positive and negative skewness clearly.
- Additionally, the background color shifts depending on whether the third-order moment is above or below zero, further highlighting the prevailing market sentiment.
The "Third-order moment" indicator is a valuable tool for traders looking to gauge the market's skewness, helping identify potential trend continuations or reversals. By understanding the dominance of positive or negative skewness, traders can make more informed decisions.
Search in scripts for "order"
Smart Money Setup 01 [TradingFinder]Double Order Blocks Proof🔵 Introduction
The Price Action, styled as the "Smart Money Concept" or "SMC," was introduced by Mr. David J. Crouch in 2000 and is one of the most modern technical styles in the financial world. In financial markets, Smart Money refers to capital controlled by major market players (central banks, funds, etc.), and these traders can accurately predict market trends and achieve the highest profits.
In the "Smart Money" style, various types of "order blocks" can be traded. This indicator uses a type of "order block" originating from "BoS" (Breakout of Structure). The most important feature of this indicator is the confirmation of two order blocks.
🟣 Important
For example, after the first "BoS" and the formation of the first Order Block, if a second "BoS" occurs before touching the price of the first Order Block and the formation of the second Order Block, a trading setup with 2 order blocks is formed, which confirms the dominant market trend.
For a better understanding of this subject, see the explanations in the following two images.
Bullish Setup Details :
Bearish Setup Details :
🔵 How to Use
After adding the indicator to the chart, you should wait for the formation of the trading setup. You can observe different trading positions by changing the "Time Frame" and "Pivot Period." Generally, the higher the "Time Frame" and "Pivot Period," the more valid the formed setup is.
Bullish Setup Details on Chart :
Bearish Setup Details on Chart :
You can access the "Pivot Period" input through the settings.

Strategy Multiple Orders + Statistics Template - EducationalHello traders
It's been a while
We're back in a bear market so I have a bit more time to publish new Pine scripts for the TradingView community
Special thanks to @fikira for his Multiple Orders script () and to @carnagecain for allowing me to publish this script we worked together on
I got widely inspired by @fikira's script for that one
This script is for educational purposes only - I wanted to show how we can add multiple TPs/SL + a table with custom statistics
In this Strategy template, users can define multiple take-profit and multiple stop-loss levels.
Basically, we have 4 trades per trend and each trade has its own SL/TP
Statistics
Stats are split per trade direction (Long, Short) and then consolidated
I put custom stats in that table such as:
- Probability of Win
- Probability of Loss
- Avg Profit/Loss per Trade
- APPT: (Probability of Win * Average Gross Profit) - (Probability of Loss * Average Loss)
- Number of times each TP/SL has been hit
I'm catching up with all recent pinescript features as we speak - more educational scripts template to come soon
Best Regards
Dave

Higher Order PivotsFirst order pivot points are defined as 3 or 5 bar "V" shaped patterns. For example a high with a lower high either side of the peak and in the case of the 5 bar variant with lower highs adjacent to a high below the peak.
Second order pivot points are defined by three first order pivots in the same manner. For example a peak pivot high with a lower pivot high to either side.
Third order pivots follow the same pattern, a peak second order pivot high with two adjacent second order pivot highs.
As it can take a significant and variable amount of time before higher order pivots are confirmed, it is generally inadvisable to use higher order pivots for live trading!
However they can be used for historical analysis. For example to delineate market structure of major market inflections.
For example :
Delineating market structure using 2nd order pivots derived from 3 bar, 1st order pivots
Major market inflections from 3rd order pivots derived from 5 bar, 1st order pivots

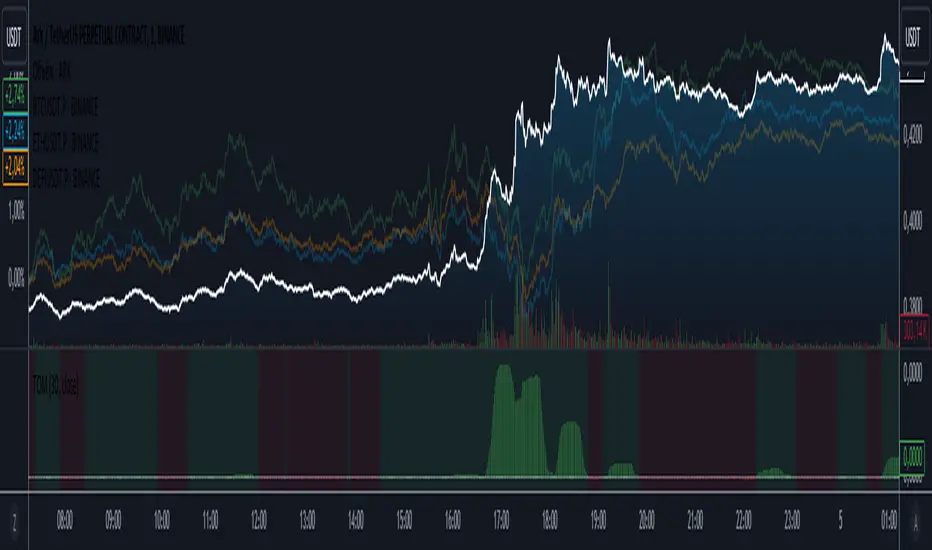
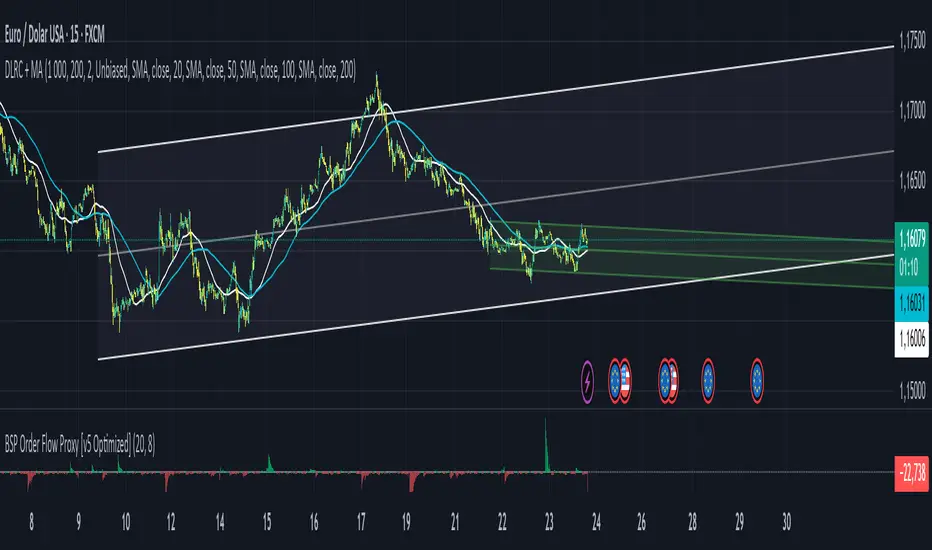
BSP Order Flow Proxy This indicator is a refined Buy/Sell Pressure (BSP) model designed to approximate order flow dynamics directly from price and volume data.
It estimates the relative dominance of buyers vs. sellers by analyzing candle structure and volume distribution — offering a simple yet powerful proxy for delta-based order flow.
You can toggle between two calculation modes:
• Tick Rule: compares current close vs. previous close (for assets with continuous volume flow).
• Candle Rule: compares close vs. open (for simpler candle-based estimation).
The result is a smoothed delta histogram:
• 🟩 Green bars — buying pressure dominates (demand > supply)
• 🟥 Red bars — selling pressure dominates (supply > demand)
• ⚫ Zero line — neutral or balanced order flow
The built-in HMA and EMA smoothing filters remove short-term noise and emphasize genuine momentum shifts in buyer/seller activity.
This tool is particularly useful for traders who want to:
• Gauge hidden shifts in market control (bullish or bearish pressure)
• Anticipate potential reversals or volume-driven continuations
• Combine volume analytics with technical price action
NX - ICT PD ArraysThis Pine Script indicator identifies and visualizes Fair Value Gaps (FVGs) and Order Blocks (OBs) based on refined price action logic.
FVGs are highlighted when price leaves an imbalance between candles, while Order Blocks are detected using ICT methodology—marking the last opposing candle before a displacement move.
The script dynamically tracks and updates these zones, halting box extension once price interacts with them. Customizable colors and lookback settings allow traders to tailor the display to their strategy.

Smart Order Blocks [Pro Version]Here’s a **clear, detailed "How It Works" explanation** for this indicator:
---
## ✅ **Smart Order Blocks \ – How It Works**
### **Purpose**
This indicator detects **Order Blocks (OBs)** based on **pivot highs and lows**, and automatically marks **Bullish** and **Bearish OB zones** on the chart with optional extensions and alerts. It is designed to help traders identify **institutional price levels** where liquidity is often engineered for future price moves.
---
### **Customization Options**
✔ **Source** → Choose between Wicks or Bodies for OB calculation.
✔ **Pivot Settings** → Adjust sensitivity for detecting pivots.
✔ **Extend OBs** → Keep zones visible until tapped, or fix a specific width.
✔ **Show Labels** → Displays OB type and strength on chart.
✔ **Colors** → Configure Bullish, Bearish, and Invalid OB colors.
---
### **Practical Usage**
* **Entry Strategy**:
* Wait for price to **revisit a Bullish OB** in an uptrend → Long entry.
* Wait for price to **revisit a Bearish OB** in a downtrend → Short entry.
* Combine with:
* **Market Structure (HH/HL or LH/LL)**.
* **Confirmation signals** (e.g., candlestick pattern, break of structure).
* **Risk Management** → Stop loss outside OB zone.
---
### ✅ **Summary in One Sentence**
The indicator automatically identifies **institutional OB zones**, shows their strength, extends them until mitigated, and alerts you when price interacts with these key liquidity levels, helping you trade like Smart Money.
---

Candle % High/Low Bar + HL Order + MA by Barty&PitPapcioWhat does the indicator show?
The "Candle % High/Low Bar + HL Order + MA by Barty&PitPapcio" indicator displays the percentage deviation of each candle’s high and low relative to its open price. The zero line represents the candle’s open — bars above zero show upward movement from the open (to high), bars below zero show downward movement (to low).
Additionally, the indicator plots a dot above or below each bar indicating which came first during the candle — the high or the low — based on data from a lower timeframe two steps below the current chart (for example, on a 1-hour chart it uses 15-minute data).
Finally, the indicator calculates and plots a user-selectable moving average (EMA, SMA, or WMA) of these "first high or low" signals, helping identify trends whether the first move is more often upwards or downwards.
Where do the data come from?
Percentage values are calculated directly from the current chart’s candles:
highPerc=(High−Open)/Open×100%,
lowPerc=(Low−Open)/Open×100%
The timing of the first high or low for each candle is retrieved from a lower timeframe, stepping down two levels from the current timeframe (e.g. from 1H to 15 min), providing better precision in detecting the order of highs and lows that may be blurred on higher timeframes.
Additional features:
Full customization of colors for bars, dots, zero line, grid, and thicknesses.
Background grid with adjustable scale and style.
Safety checks for missing lower timeframe data.
A moving average smoothing the sequence of first high/low signals to reveal directional tendencies.
Suggested strategy for technical analysis support
Identify dominant candle direction: If the dot often appears above the bar (first high), it indicates buying pressure; if below (first low), selling pressure dominates.
Use percentage deviations: Large percent bars indicate heightened volatility and potential reversal points.
Moving average on order signals: The EMA of high/low first signals smooths the noise, showing the dominant trend in the sequence of price moves, useful for filtering other signals.
Combine with other tools: This indicator can act as a directional filter on multiple timeframes, synergizing well with momentum indicators, RSI, or support/resistance levels to confirm move strength.
Lots of love, Bartosz

(OFPI) Order Flow Polarity Index - Momentum Gauge (DAFE) (OFPI) Order Flow Polarity Index - Momentum Gauge: Decode Market Aggression
The (OFPI) Gauge Bar is your front-row seat to the battle between buyers and sellers. This isn’t just another indicator—it’s a momentum tracker that reveals market aggression through a sleek, centered gauge bar and a smart dashboard. Built for traders who want clarity without clutter, it’s your edge for spotting who’s driving price, bar by bar.
What Makes It Unique?
Order Flow Pressure Index (OFPI): Splits volume into buy vs. sell pressure based on candle body position. It’s not just volume—it’s intent, showing who’s got the upper hand.
T3 Smoothing Magic: Uses a Tilson T3 moving average to keep signals smooth yet responsive. No laggy SMA nonsense here.
Centered Gauge Bar: A 20-segment bar splits bullish (lime) and bearish (red) momentum around a neutral center. Empty segments scream indecision—it’s like a visual heartbeat of the market.
Momentum Shift Alerts: Catches reversals with “Momentum Shift” flags when the OFPI crests, so you’re not caught off guard.
Clean Dashboard: A compact, bottom-left table shows momentum status, the gauge bar, and the OFPI value. Color-coded, transparent, and no chart clutter.
Inputs & Customization
Lookback Length (default 10): Set the window for pressure calculations. Short for scalps, long for trends.
T3 Smoothing Length (default 5): Tune the smoothness. Tight for fast markets, relaxed for chill ones.
T3 Volume Factor (default 0.7): Crank it up for snappy signals or down for silky trends.
Toggle the dashboard for minimalist setups or mobile trading.
How to Use It
Bullish Momentum (Lime, Right-Filled): Buyers are flexing. Look for breakouts or trend continuations. Pair with support levels.
Bearish Momentum (Red, Left-Filled): Sellers are in charge. Scout for breakdowns or shorts. Check resistance zones.
Neutral (Orange, Near Center): Market’s chilling. Avoid big bets—wait for a breakout or play the range.
Momentum Shift: A reversal might be brewing. Confirm with price action before jumping in.
Not a Solo Act: Combine with your strategy—trendlines, RSI, whatever. It’s a momentum lens, not a buy/sell bot.
Why Use the OFPI Gauge?
See the Fight: Most tools just count volume. OFPI shows who’s winning with a visual that slaps.
Works Anywhere: Crypto, stocks, forex, any timeframe. Tune it to your style.
Clean & Pro: No chart spam, just a sharp gauge and a dashboard that delivers.
Unique Edge: No other indicator blends body-based pressure, T3 smoothing, and a centered gauge like this.
The OFPI Gauge catches the market’s pulse so you can trade with confidence. It’s not about predicting the future—it’s about knowing who’s in control right now.
For educational purposes only. Not financial advice. Always use proper risk management.
Use with discipline. Trade your edge.
— Dskyz , for DAFE Trading Systems

N-Degree Moment-Based Adaptive Detection🙏🏻 N-Degree Moment-Based Adaptive Detection (NDMBAD) method is a generalization of MBAD since the horizontal line fit passing through the data's mean can be simply treated as zero-degree polynomial regression. We can extend the MBAD logic to higher-degree polynomial regression.
I don't think I need to talk a lot about the thing there; the logic is really the same as in MBAD, just hit the link above and read if you want. The only difference is now we can gather cumulants not only from the horizontal mean fit (degree = 0) but also from higher-order polynomial regression fit, including linear regression (degree = 1).
Why?
Simply because residuals from the 0-degree model don't contain trend information, and while in some cases that's exactly what you need, in other cases, you want to model your trend explicitly. Imagine your underlying process trends in a steady manner, and you want to control the extreme deviations from the process's core. If you're going to use 0-degree, you'll be treating this beautiful steady trend as a residual itself, which "constantly deviates from the process mean." It doesn't make much sense.
How?
First, if you set the length to 0, you will end up with the function incrementally applied to all your data starting from bar_index 0. This can be called the expanding window mode. That's the functionality I include in all my scripts lately (where it makes sense). As I said in the MBAD description, choosing length is a matter of doing business & applied use of my work, but I think I'm open to talk about it.
I don't see much sense in using degree > 1 though (still in research on it). If you have dem curves, you can use Fourier transform -> spectral filtering / harmonic regression (regression with Fourier terms). The job of a degree > 0 is to model the direction in data, and degree 1 gets it done. In mean reversion strategies, it means that you don't wanna put 0-degree polynomial regression (i.e., the mean) on non-stationary trending data in moving window mode because, this way, your residuals will be contaminated with the trend component.
By the way, you can send thanks to @aaron294c , he said like mane MBAD is dope, and it's gonna really complement his work, so I decided to drop NDMBAD now, gonna be more useful since it covers more types of data.
I wanned to call it N-Order Moment Adaptive Detection because it abbreviates to NOMAD, which sounds cool and suits me well, because when I perform as a fire dancer, nomad style is one of my outfits. Burning Man stuff vibe, you know. But the problem is degree and order really mean two different things in the polynomial context, so gotta stay right & precise—that's the priority.
∞

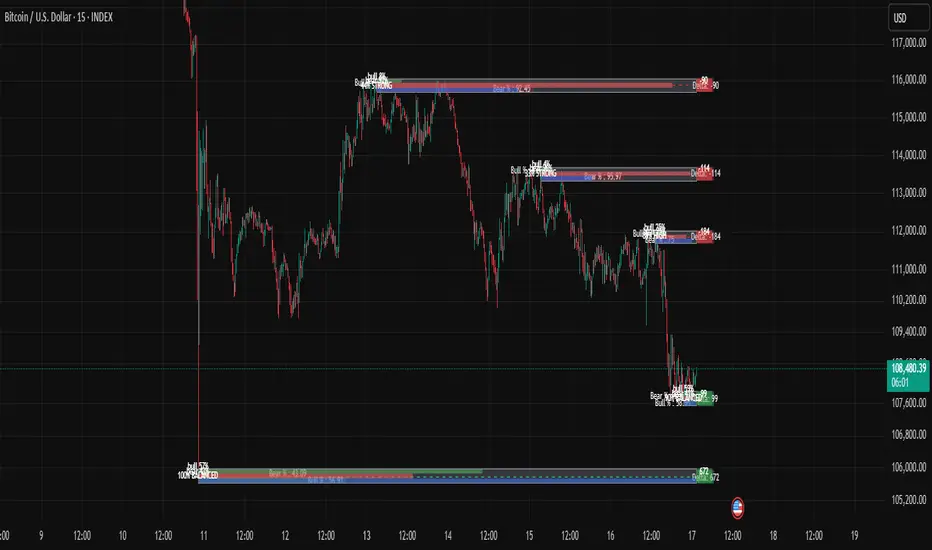
Volume Profile / Order Blocks + Demandas e Ofertas FortesThis indicator combines two powerful technical analysis tools into one: the Volume Profile Bar-Magnified Order Blocks and Strong Demands and Offers.
The Volume Profile Bar-Magnified Order Blocks identifies and highlights significant areas of volume and price on the chart, helping traders identify zones of high liquidity and potential trend reversal areas. With advanced customization features such as choice of mitigation method and grid adjustments, traders can tailor the indicator to their individual preferences.
Alongside the Volume Profile, Strong Demands and Offers add an additional layer of analysis, highlighting points of interest where buying or selling pressure is strongest. This helps traders identify key areas where the balance of power may shift, providing potential entry or exit signals.
Key Features:
Automatic identification of significant volume areas.
Highlighting of zones of high liquidity and potential trend reversal areas.
Advanced customization, including choice of mitigation method and grid adjustments.
Highlighting of strong demands and offers to identify key areas of buying or selling pressure.
How to Use:
Add the indicator to your chart.
Adjust the parameters according to your preferences.
Observe the highlighted areas of volume and price on the chart.
Look for entry or exit signals based on the identified areas of interest.
This indicator is a valuable tool for traders looking to enhance their technical analysis based on volume and market dynamics. Try it out in your trading strategy and discover how it can help you make more informed and accurate decisions.

ICT Institutional Order Flow (fadi)ICT Institutional Order Flow indicator is intended to provide wholistic view to better analyze order flow and where price may go to next. The concept follows ICT principles.
ICT Market Structure
ICT breaks down Pivot points into three categories:
Short Term High/Low (STH/STL) is a 3 candle pattern with a low with higher low on each side (STL), or a high with lower high on each side (STH)
Intermediate Term High/Low (ITH/ITL) uses the calculated STH/STL and marks any STH that has lower or STH on each side, and STL that has higher STL on each side
Long Term High/Low (LTH/LTL) uses the calculated ITH/ITL and marks any ITH that has lower or ITH on each side, and ITL that has higher ITL on each side
Note: ICT also states that if a STH wicks into and closes (almost?) a FVG, he marks it as ITH even if it does not have STH on reach side. This scenario is not covered by this indicator
Liquidity
liquidity is usually present under pivot points. The more prominent the pivot point, the more likely higher values liquidity pools reside under/above it. Liquidity under ITL and LTL as an example, will have better indication of which liquidity the price may seek next.
Displacement
Displacement registers above average move in the price resulting in strong visible move. If requiring a FVG is enabled (in settings), then the displacement could possibly (but never guaranteed) be used to visually recognize a move as it develops.
Full Credit: The calculation for Displacement is derived from TFO's Visualizing Displacement
Imbalances
Imbalances can come in different forms. This indicator identifies three type of imbalances:
1. FVG
2. Volume Imbalance
3. Open Gaps
Imbalances completes the picture by help visualize strong moves, where possible pivot points may develop, and how to enter or manage a trade.

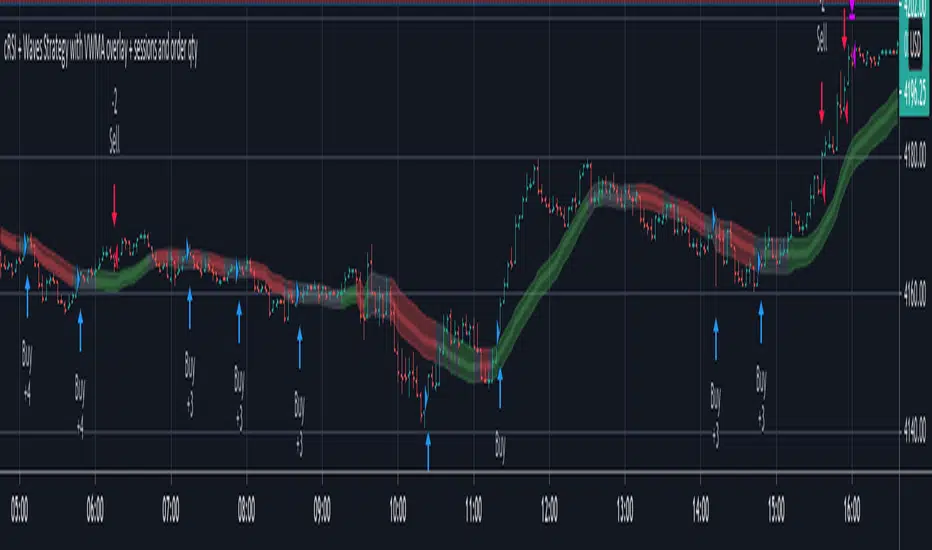
cRSI + Waves Strategy with VWMA overlay + sessions and order qtyThis is a fork of the cRSI + Waves Strategy with VWMA overlay strategy by Dr_Roboto , which adds two additional features, namely:
the ability to limit trade signals to certain defined periods of time ("Sessions") during the trading day and, optionally, to close any open position at the end of either or both "Sessions"
the ability to control the maximum order size suggested by the strategy on the "Inputs" tab of the strategy's "Settings" window
If you are trading on a daily chart (or longer) you must disable the Limit Signals to Trading Sessions? option in order for the strategy to produce signals.
All other features are identical to the original strategy (revision 2.0).
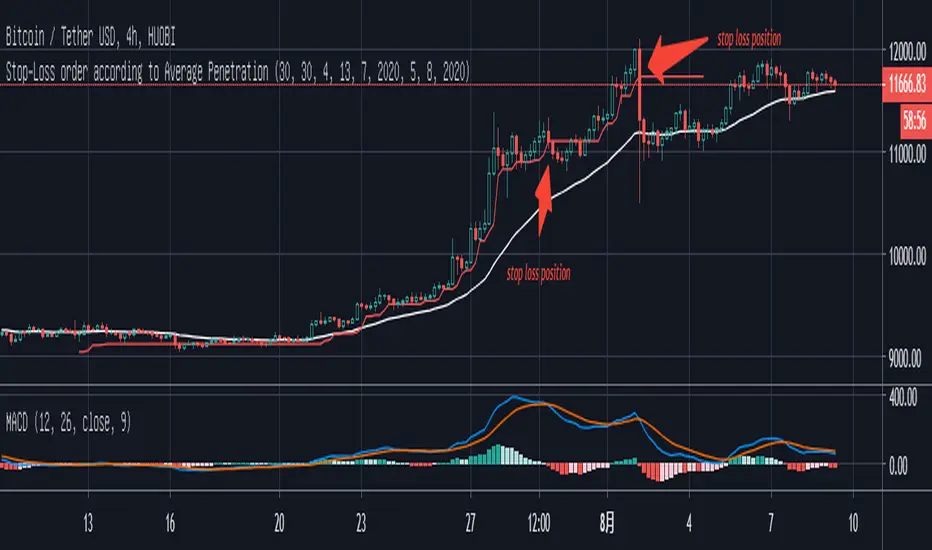
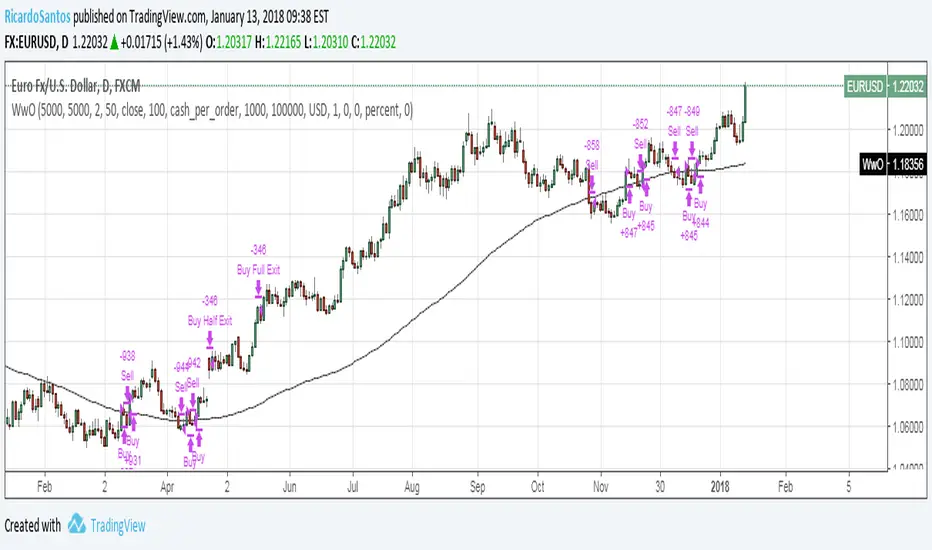
Stop-Loss order according to Average PenetrationAs a engineer, the view of signal and noise in the book of "Trading for a living"really interests me. For a trader the biggest issue is when should we enter and exit the market. The view of safety range stop loss may help to solve this problem for some beginner and give you a new idea of stoploss for you trade system
Here is the content from Trading for a Living
you may use the slope of a 22-day EMA to define the trend. You need to choose the length of the lookback period for measuring noise level. it has to be long enough to track recent behavior but short enough to be relevant for current trading. A period of 10 to 20 days works well, or we can make our lookback period 100 days or so if we want to average long-term market
if the trend is up, mark all downside penetrations during the look-back period, add their depths, and divide the sum by the number of penetrations。 This gives you the Average Downside Penetration for the selected look back
if today's low is lower than yesterday's, do not move your stop lower since we are only allowed to raise stops on long positions, not lower them
Reverse these rules in downtrends. When a 22-day EMA identifies a downtrend, count all the upside penetrations during the look-back period and find the Average Upside Penetration. Multiply it by a coefficient, starting with two. When you go short, place a stop twice he Average Upside Penetration above the previous day's high. Lower your stop whenever the market makes a lower high, but never raise it.
The important thing when you make an order is to hold your earning during a trending scenario. To avoid stopping loss by the variance in the market and to avoid big loss if the market shift to another direction in a short time.
From the graph there, I select the most recent trend up period in the Bitcoin and adjust the parameters according to this trend.
As you can see, the stop loss is away from the lowest price in bar, so that you will not be forced to exit the trade by small turbulence. You can hold your order and need to worry about missing the trend. But there are always sharp plunges in the uptrend. you can see two cursors on the graphic. The stop loss will help you avoid this plunge.
But in my opinion, this will be the hard stop loss in your trade. Help you to keep profit and avoid big loss. To maximize the profit, you had better to build you own strategy.
When I try to create this indicator, it is found that two rule for this indicator
1. you had better to use it in a clear trend range. Since the stop loss can only be higher in a long condition and lower in a short condition. If you use it in a volatile market., then stop loss doesn’t make any senses.
2. you need to adjust those parameters according to the market and the trend you are in. Some people like to avoid big loss, you can set them this depending on you experience
Last, this is getting from the view in the book, i didn’t do any back test for it. So please be careful to use it and let me know if you have any suggestions or ideas.
Scripting Tutorial 9 - TManyMA Strategy - Long Market Order OnlyThis script is for a triple moving average strategy where the user can select from different types of moving averages, price sources, lookback periods and resolutions.
Features:
- 3 Moving Averages with variable MA types, periods, price sources, resolutions and the ability to disable each individually
- Crossovers are plotted on the chart with detailed information regarding the crossover (Ex: 50 SMA crossed over 200 SMA )
- Forecasting available for all three MAs. MA values are forecasted 5 values out and plotted as if a continuation to the MA.
- Forecast bias also applies to all forecasting. Bias means we can forecast based on an anticipated bullish, bearish or neutral direction in the market.
- To understand bias, please read the source code, or if you can't read the code just send me a message on here or Twitter. Twitter should be linked to my profile.
- Ribbons added and on by default. Optional setting to disable the ribbons. 5 ribbons between MA1 and MA2 and another 5 between MA2 and MA3.
- Ribbons are alpha-color coded based on their relation to their default MAs.
- Ribbons are only visible between MAs if the MAs being compared share the same Type, Resolution, and Source because there is no way to consolidate those three in a simple manner.
- Ribbon values are calculated based on calculated MA Periods between the MAs.
- Converted the existing study into a strategy
- Strategy only enters long positions with a market order when MA crossovers occur
- Strategy exits positions when crossunders occur
- Trades 100% of the equity with one order/position by default
- Ability to disable trading certain crosses with input checks
This script is meant as an educational script with well-formatted styling, and references for specific functions.
*** PLEASE NOTE - THIS STRATEGY IS MEANT FOR LEARNING PURPOSES. DEPENDING ON IT'S CONFIGURATION IT MAY OR MAY NOT BE USEFUL FOR ACTUAL TRADING. THE STRATEGY IS NOT FINANCIAL ADVICE ***

[Tutorial][RS]Working with ordersa small tutorial to explain how to work with orders, comments in the script.
XAUUSD 5m — NY Supertrend+RSI Optimizer (1:2 RR) — $240k/orderThis strategy is built for XAUUSD (Gold) on the 5-minute timeframe, focusing exclusively on the New York trading session (08:00–17:00 NY time) — the most volatile and liquid hours of the day.
It combines a Supertrend trend filter with RSI momentum signals to identify high-probability entries, using a 1:2 risk–reward ratio for disciplined trade management.
🧠 Strategy Logic:
Buy Condition: RSI crosses above 55 while Supertrend indicates an uptrend
Sell Condition: RSI crosses below 45 while Supertrend indicates a downtrend
Session Filter: Trades only between 08:00 → 17:00 New York time
Risk/Reward: 1:2 (Take-Profit = 2× Stop-Loss distance from Supertrend line)
Position Size: $240,000 notional per order
Auto-Exit: Closes all trades at NY session end
⚡ Highlights:
Targets NY session volatility
Combines trend + momentum for cleaner entries
Strict 1:2 RR for consistent outcomes
Avoids overnight exposure
⚠️ Disclaimer:
This script is intended for educational and research purposes only.
Past performance is not indicative of future results.
Always forward-test on demo before using live capital.

ETH Smart Money Order Blocks Detector derek
This script helps identify potential Order Blocks (institutional price zones) on the chart based on Breaks of Structure (BOS).
It automatically highlights demand zones (green blocks) and supply zones (red blocks), making it easier to read institutional market flow.
Ideal for traders using Smart Money Concepts (SMC) or market structure analysis.
Compatible with any asset and timeframe.
🔹 Bullish OB = potential buy entry zone
🔹 Bearish OB = potential sell or resistance zone
Author: Derek 🧠💹

Mimic liquidity Order Blocks Modifiedits help to find liquidity order block and the bull bear percentage also delta
15m FVG Inversion + Order BlockThe indicator finds the inversion of the FVG 15 minutes and the order block, after which it gives an entry signal.
Liquidity levels + Order BlocksThis script mark liquidity levels, and monthly, weekly and daily candle open. The order blocks indicator is on construction.

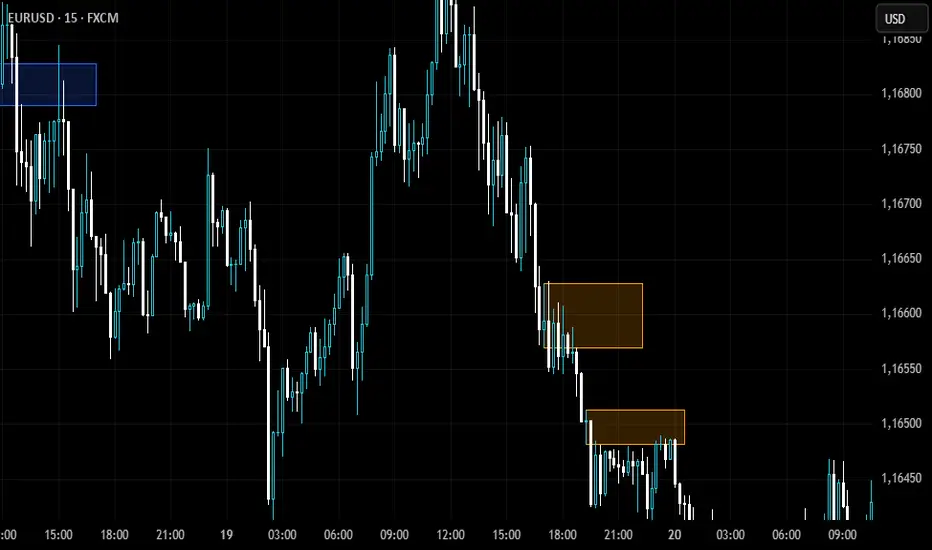
Gap + Order Blocks1️⃣ What the script does:
A. Price Gaps:
Detects a candle whose low is higher than the previous candle’s high → Bullish Gap.
Detects a candle whose high is lower than the previous candle’s low → Bearish Gap.
Users can choose:
Limited Extension: the rectangle only spans a set number of candles.
Infinite Extension: the rectangle automatically extends to the end of the chart.
B. Order Blocks (simplified version):
Bullish OB: the last bearish candle before a strong upward move.
Bearish OB: the last bullish candle before a strong downward move.
Drawn as colored rectangles for easy visualization of potential buy/sell zones.
2️⃣ Benefits of the script:
All gaps and OBs are drawn automatically on the chart.
Customizable colors for quick recognition of different zones.
Full control over gap extensions and OB length.
Suitable for both beginner and advanced traders.
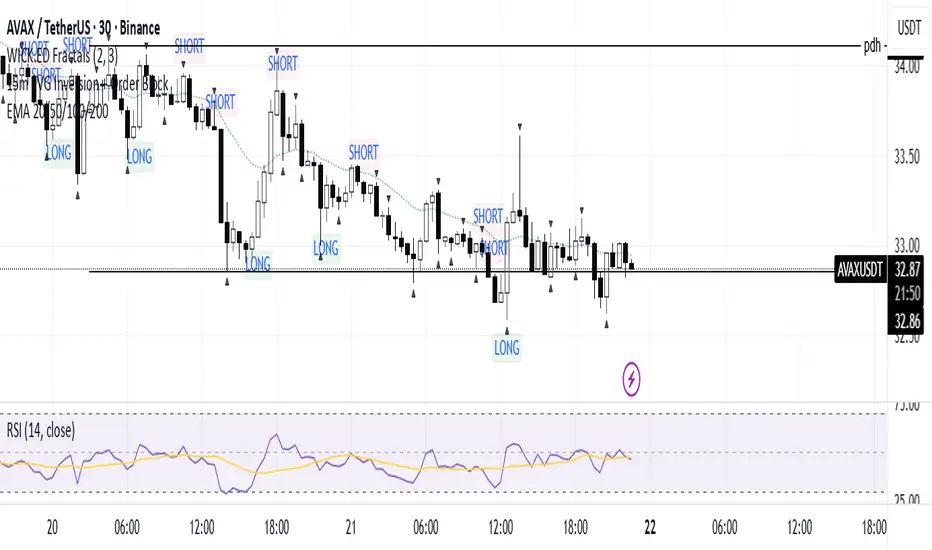
Stop Order Entry with Filters and Line📌 名称: Stop Order Entry with Filters (挂单入场辅助工具)
🧠 作者: Kuixi Zhu
🛠️ 功能简介:
本指标用于识别高质量的 Bull/Bear bar,并在其上方(或下方)自动绘制挂单入场线,帮助你基于 Price Action 策略设置 **buy stop / sell stop** 挂单。
✅ 特性:
- Bull bar:收盘靠近 high,且 bar 波动大于平均(ABR) → 在 high+1tick 画绿线(buy stop)
- Bear bar:收盘靠近 low,且 bar 波动大于平均 → 在 low-1tick 画红线(sell stop)
- 支持自定义线条长度、ABR周期、强度过滤标准
🔍 核心逻辑:
- `(close - low) / (high - low)` 衡量收盘靠近 high 的程度
- `barRange > avg(barRange)` 控制有效波动性
- 使用 `line.new` 动态画出可视化入场价格
📊 应用场景:
- 趋势交易中的顺势挂单策略
- price action 高质量 bar 的识别辅助
- 多头突破、空头反转结构的自动提示
⚙️ 参数可调:
- 最低收盘位置比例(default: 0.9)
- 最小 bar 波动倍数(相对 ABR)
- 横线绘制长度(default: 5 bars)
---
